Graph Partitioning Through a Multi-Objective Evolutionary Algorithm: A Preliminary Study Dilip Datta1
Department of Mechanical Engineering National Institute of Technology - Silchar Silchar - 788 010, India
José Rui Figueira
CEG-IST, Center for Management Studies Instituto Superior Técnico Technical University of Lisbon TagusPark, Av. Cavaco Silva
[email protected] 2780–990 Porto Salvo, Portugal
Carlos M. Fonseca1
DEEI, Faculdade de Ciências e Tecnologia Universidade do Algarve Campus de Gambelas 8005–139 Faro, Portugal
[email protected]
[email protected] Fernando Tavares-Pereira1
Departamento de Matemática Universidade da Beira Interior 6201–001 Covilhã, Portugal
[email protected]
ABSTRACT
General Terms
The graph partitioning problem has numerous applications in various scientific fields. It usually involves the effective partitioning of a graph into a number of disjoint sub-graphs/ zones, and hence becomes a combinatorial optimization problem whose worst case complexity is NP-complete. The inadequacies of exact methods, like linear and integer programming approaches, to handle large-size instances of the combinatorial problems have motivated heuristic techniques to these problems. In the present work, a multi-objective evolutionary algorithm (MOEA), a kind of heuristic techniques, is developed for partitioning a graph under multiple objectives and constraints. The developed MOEA, which is a modified form of NSGA-II, is applied to four randomly generated graphs for partitioning them by optimizing three common objectives under five general constraints. The applications show that the MOEA is successful, in most of the cases, in achieving the expected results by partitioning a graph into a variable number of zones.
Algorithms.
Keywords Multi-objective optimization, evolutionary algorithms, partitioning problems.
1. INTRODUCTION A graph can be defined by G = (V, E), where V = {1, 2, ., n} denotes a set of n nodes (e.g. geographical units), and E = {eij |i, j = 1, 2, ., n; i 6= j} denotes a set of edges with eij representing the connection between the nodes i and j. A pair of connected nodes, i and j, is compared through their weight wij , whose value usually depends on the type of connectivity of the nodes, e.g. the road distance between the nodes i and j, or the bus fare between them. The graph G is called directed if wij 6= wji (i 6= j), else it is undirected. Partitioning G is the task of grouping its n nodes into Z disjoint and non-empty sets in such a way that some given objective functions are optimized with respect to a set of given constraints. Thus, the graph partitioning becomes a multi-objective combinatorial optimization problem that has numerous applications in various fields of science and engineering. Its application has already been ranged from designing scientific components in laboratories to partitioning geographical territories or to analyzing biological data. The partitioning problem is NP-complete for Z > 2, where Z is the number of sets into which a graph is to be partitioned [2, 22]. Hence, the traditional exact methods, like linear and integer programming approaches, either fail or become computationally expensive in handling large-size instances of the problem, particularly a huge number of integer variables, a discrete search space and multiple objectives involved with the problem. Another reason of failure of the exact methods is the number of sets/zones to be obtained, which is generally not known in many cases, but depends on the natures
Categories and Subject Descriptors I.2.8 [Artificial Intelligence]: Problem Solving—Graph and tree search strategies, Heuristic methods. 1 Also associated with CEG-IST, Center for Management Studies, Instituto Superior T´ecnico, Technical University of Lisbon, TagusPark, Av. Cavaco Silva, 2780–990 Porto Salvo, Portugal.
Permission to make digital or hard copies of all or part of this work for personal or classroom use is granted without fee provided that copies are not made or distributed for profit or commercial advantage and that copies bear this notice and the full citation on the first page. To copy otherwise, to republish, to post on servers or to redistribute to lists, requires prior specific permission and/or a fee. GECCO’08, July 12–16, 2008, Atlanta, Georgia, USA. Copyright 2008 ACM 978-1-60558-130-9/08/07…$5.00.
625
of available data. Therefore, as the search space becomes larger and the problem scales up, an efficient approach is to obtain approximate solutions in polynomial time by using some heuristic techniques [3]. Various such techniques proposed for the partitioning problem include group swapping [19], eigenvector decomposition [17], network flow [26], simulated annealing [18], tabu search [5], genetic/evolutionary algorithms (GAs/EAs) [3, 6, 7], etc. However, an EA (GA is a kind of EA) is known as one of the most effective techniques to solve combinatorial optimization problems by simulating the process of natural evolution and natural genetics [16]. An EA is a population-based technique in which the candidate solutions retain the better characteristics of multiple solutions of the population of earlier generations [3]. This has motivated the present work to exploit the potentiality of the Non-dominated Sorting Genetic Algorithm (NSGA-II) [10], a multi-objective evolutionary algorithm (MOEA) that has gained huge popularity in recent years because of its successful application to a wide range of test problems as well as real-life problems, for solving the graph partitioning problem. However, a major modification is made to the original NSGA-II in order to handle this problem. The developed MOEA has two main advantages over those reported in the literature. Firstly, it can optimize simultaneously any number of objective functions (greater than one). Secondly, it can divide a graph into any number of zones within a user specified range. In order to evaluate the performance of the MOEA, four graphs of different sizes are generated randomly and those are then partitioned by optimizing three common objectives under five general constraints. The MOEA is found successful in achieving the expected results in three out of the four cases. Although the MOEA slightly deviates from the expectation in the fourth case, the obtained result is quite satisfactory.
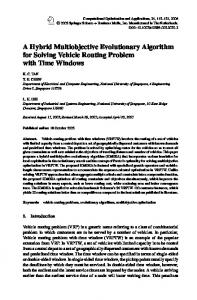
3. GRAPH PARTITIONING AS A MULTIOBJECTIVE OPTIMIZATION PROBLEM A diagrammatic representation of a graph G is shown in Figure 1(a), where 1,2,. . . ,20, inside circles, denote 20 nodes
w 5,6 5 1,5
13
,20
16 17
12
w1,2
8
2
w 2,3
w
3,9
9
18
10 w 10,18
w9,10
(a) A 20-node graph.
B
6
19
11
4
3
15
20
7
1
w
18, 19
A number of techniques has been proposed from time to time for the graph partitioning problem, such as simulated annealing [18], group swapping [19], eigenvector decomposition [17], network flow [26], genetic/evolutionary algorithms (GAs/EAs) [3, 6, 7, 12], etc. Kirkpatrick et al. [18] studied the simulated annealing where the objective function is analogous to energy in a physical system, and the iteration-wise move is analogous to changes in the energy of the system. The algorithm usually produces good results at the expense of very high computational time. The group swapping technique, investigated by Krishnamurthy [19], starts randomly with two subsets and then pairwise swapping is applied iteratively on all pairs of the nodes of a graph. In the eigenvector decomposition method of Hadley and Mark [17], the connections of the nodes are represented in a matrix, the eigenvectors of which define the locations of the nodes and thus derive various partitions. The method requires the transformation of every multi-edge node into several single-edge node before establishing the matrix. Yang and Wong [26] apply the network flow technique where, in order to separate a pair of nodes into two subsets, the minimum number of crossing edges is equalized to the maximum amount of flow from one node to the other node. Although this algorithm can find the optimum solution between any pair of nodes in a network, there is no constraint on the sizes of the resulting subsets, thus making it useless when two very unevenly sized subsets are generated. In the case of GAs, Chandrasekharam
15
6
w
RELATED WORKS
w14,15
5
w19,20
w6,14 14
w
2.
et al. [7] propose a GA for the graph partitioning problem with the applications in VSLI design. A hybrid GA is proposed by Bui and Moon [6], where a local search is applied for faster improvement. Moreover, an additional feature, known as the schemata theory [16], is also incorporated in their GA for improving the capability of searching the solution space. Both these GAs are single-objective where the total cut of edges, arising from the inclusion of two connected nodes in two different subsets, is minimized. In another GA, proposed by Baruch et al. [3], the traditional requirement is slightly improved by considering one more objective, where the sizes of the subsets are balanced by minimizing the difference in the numbers of edges in two subsets. However, their GA is also a single-objective one, where both the objectives are combined into one. Besides these, many other GAs/EAs are found in the literature, which are developed for applying in particular applications of the graph partitioning problem, such as parallel multi-processor scheduling [24], circuit design [3, 11], image segmentation in computer vision [23], production simulation [12], political districting of a territory [5], sales territory alignment [27], school districting [13], electrical power distribution [4], weapon target assignment [1], gene expression data [14, 15], gene ontology [21], etc.
15 20
13
16
7
A
1
14
12
11
4 8
2 3
D 17
9
19
C 18 10
(b) Partitioning the graph.
Figure 1: An example of a graph and its partitions. present in the graph, and wij , marked on the edge between the nodes i and j, denotes the weight of these two nodes (weights only of the outer edges are shown). As shown by A, B, C and D in Figure 1(b), the task of partitioning the graph involves the grouping of the nodes into some zones in such a way that a given set of objectives is met by satisfying a certain number of constraints. Many instances of the graph partitioning problem aim at minimizing the loss of edge values resulting from the inclusion of two connected nodes in two different zones [6, 7], balancing the sizes of the zones [3], and/or defining zones of compact shape [25]. Emphasizing such requirements, the following three objectives are considered in the present work: 1. Minimize the net loss in edge values resulting from the inclusion of two connected nodes in two different zones,
626
i.e.
6
6
Minimize
f1 =
X
wij .Xij ,
(1)
5
ei,j ∈E
Z X
| n′p − n′q | ,
8
3
3
g2 ≡ Hp = zp ; p = 1 to Z ,
δp ,
Hp = Hp ∪ {j},
if eij = 1, i ∈ Hp , j 6∈ Hp , j ∈ zp ; i, j = 1 to n, i 6= j .
Finally, Hp equals zp if all the nodes of zp are interconnected, otherwise zp \ Hp number of nodes of zp would be disconnected from its rest of the nodes. Figure 2(b) displays a graph, where the outer zone is not contiguous as the node 6 is not directly connected with any other node of the zone.
(3)
3. Number of zones: The number of zones in a graph should be within a certain range, i.e.
L U U and (xL p ,xp ) and (yp ,yp ) are, respectively, the ranges of the x- and y-coordinates in the zone zp . The purpose of f3 is to obtain a square-like zone by minimizing its width in one direction when it is greater than the width in the other direction. Instead of a square-like zone, a circular or an elliptical zone may also be preferred in order to compact it.
g4 ≡ Z min 6 Z 6 Z max , where, [Z zones.
min
,Z
max
(6)
] is the range for the number of
4. Size of a zone: The number of nodes in a zone should be within a certain range, i.e.
There may exist an unlimited number of constraints, among which the following five are common in most of the instances of the graph partitioning problem:
g5 ≡ n′pmin 6 n′p 6 n′pmax ,
p = 1 to Z ,
(7)
where, [n′pmin , n′pmax ] is the range for the number of nodes in the p-th zone.
1. Integrity of nodes: A node should belong to one and only one zone at a time, i.e. Yip = 1; i = 1 to n ,
(5)
where, Hp is a temporary set whose initial element is the first node of the zone zp . Hp is then gradually enhanced by a node of zp that still does not belong to Hp , but directly connected with one of its elements, i.e.
L U L U L where, δp = xU p − xp , if xp − xp > yp − yp L − x = ypU − ypL , if ypU − ypL > xU p , p
Z X
4 2
be any disconnected node in the zone. This constraint can be checked as below:
(2)
p=1
g1 ≡
10
Figure 2: Three invalid situations of a graph.
3. Minimize the spread of a zone in any particular direction in order to make the zone of compact shape, i.e. Z X
7
(a) No integrity of (b) A discon- (c) Two embednodes nected zone ded zones
where, and are the numbers of nodes in the zones zp and zq , respectively. Besides equalizing the numbers of nodes in the zones, the zones can also be homogenized in terms of the number/values of the edges in a zone, the area of a zone, and many more.
f3 =
9
1
8
2
3
n′q
Minimize
10 4
8
p=1 q=p+1
n′p
5
7
1
4
2. Minimize the net difference in the numbers of nodes in different zones in order to balance the sizes of the zones, i.e. Z−1 X
10
2
Xij = 1, if i ∈ zp , j ∈ zq , zp , zq ∈ Z, p 6= q = 0, otherwise .
f2 =
5
7
1
where, Z = {z1 , z2 , .., zp , .., zq , ..zZ } is the set of zones, and Z is the total number of the zones. Xij is a variable that decides whether the nodes i and j of the edge ei,j belong to the same zone or in different zones, i.e.
Minimize
9
6 9
4. NSGA-II FOR THE GRAPH PARTITIONING PROBLEM
(4)
p=1
The Non-dominated Sorting Genetic Algorithm-II [9, 10], or NSGA-II in short, which is a very popular MOEA because of its successful application to a wide range of benchmark as well as real-life problems, is chosen here to tackle the graph partitioning problem under some common objectives and constraints as stated in Section 3. It is known that a search technique needs to be problem specific, at least to certain extent, in order to speed up the search process in a complex problem [8, 20]. Therefore, in this work also, based on the considered graph partitioning problem, a chromosome representation, a crossover operator, and a mutation operator, are developed and used in NSGA-II for handling the
where, Yip is a variable that decides whether the node i belongs to the p-th zone (zp ), i.e. Yip = 1, if i ∈ zp = 0, otherwise . As an example, the situation shown in Figure 2(a) is not a valid graph as the node 4 falls in two zones at the same time. 2. Contiguity of zones: The nodes of a zone should be inter-connected with one another, i.e. there should not
627
problem. On the other hand, in the case of EAs in combinatorial optimization problems, it is observed that sometime a crossover operator performs well, sometime a mutation operator, while sometime the combined crossover and mutation operators perform well [8]. Therefore, for preserving the good solutions generated individually by the crossover and mutation operators, the original NSGA-II is further modified by applying its elitism mechanism after the application of each of these two operators (in the original NSGA-II, the elitism mechanism is applied only once after the application of both the crossover and mutation operators). All other features of the modified NSGA-II are kept the same with those of the original NSGA-II. The developed chromosome representation, crossover operator and mutation operator are explained in the following subsections.
14
12
D1 17
8 3
1
19
11
4 2
5
16
7
A1
1
6
20
13
5
14
15
B1
6
14
4.1 Chromosome Representation
5
c1
The success of an EA greatly depends on its chromosome/solution representation, which is preferred to be as simple and intuitive as possible. Keeping these in view, as shown in Figure 1(b), a chromosome is considered to represent a graph in its original shape. That is, a chromosome is a collection of n nodes, present in the graph, in a twodimensional landscape, where a node is specified by its location in the graph. Some similar chromosomes are used by Datta [8] to represent a landscape in the land-use management problem, and also by Tavares-Pereira et al. [25] to represent a territory in dividing it into a number of zones, where a zone is composed of a set of elementary territorial units. During the initialization of the proposed chromosome, instead of following the traditional rule – where the elements of a chromosome are assigned some random values, an attempt is made here to maintain the size of a zone (constraint g5 of Eq. (7)), as much possible, by including a sufficient number of nodes in the zone. This can be achieved by initially including a single node in a zone, and then by expanding the zone to the nearby nodes, which are not yet included in any other zone. This initialization technique is similar with that, used by Datta [8] in the land-use management problem, where the size of a patch under a land-use is attempted to maintain by scheduling the land use in a sufficient number of contiguous units of a landscape.
b1
1
8 3
9
5
d1 17
1 19
11
4
9
18
10
14 6 20
12
2
8
A2
(b) Second Parent (P2 ).
16
7
19
11
4
3
15
13
17
12
D2
20
16
7
10
9
B2
13
2
C1 18
(a) First parent (P1 ).
6
C2
15
a1=A2 18
10
(c) First offspring (O1 ).
b2
c2
15 20
13
16
7 12 4
17
d2=D1 19 11
8
2 3
9
a2
18 10
(d) Second offspring (O2 ).
Figure 3: Crossover operator where a zone from one chromosome is inserted into another chromosome.
ent (P1 ) for generating the first offspring (O1 ). During this insertion, the zone C1 of P1 is completely overlapped by A2, and hence, it is considered as replaced by A2 in O1 . However, since the zones A1 and D1 of P1 are partially overlapped by A2 (overlapped at the nodes 8 and 11, respectively), these two zones are redefined by excluding the overlapped nodes from them in O1 . There is no change in the zone B1 of P1 . Finally, all the four zones are relabeled in O1 (for illustrative purpose only) as a1, b1, c1 and d1. On the other hand, the zone D1 from P1 is inserted into P2 for generating the second offspring (O2 ). This insertion partially overlaps the zones A2 and B2 of P2 at the nodes 11, and 16, 17, 19 and 20, respectively. Since D1 does not completely overlap any zone of P2 , just redefining the partially overlapped zones, by excluding the overlapped nodes from them, will increase the number of zones in O2 . There is no problem if it is permitted. However, in this example, it is considered that the total number of zones is fixed at four. Hence, A2 is redefined in O2 by excluding the only overlapped node 11. On the other hand, since only node 15 is left in B2, it is merged in O2 with the nearby zone C2. Finally, all the four zones are relabeled in O2 as a2, b2, c2 and d2.
4.2 Crossover Operator The purpose of a crossover operator is to generate offspring (new chromosomes) by exploiting a search space, where some beneficial portion between two chromosomes are exchanged. Since any beneficial portion of a chromosome is generally not known beforehand, usually some random information is exchanged between the chromosomes. There is no harm even if no beneficial, rather poor, information is exchanged, because a selection operator sorts out all poor solutions and emphasizes good solutions only. Depending on this role of the selection operator, a new crossover operator is developed for the graph partitioning problem with the expectation of generating good offspring. The operator generates a new chromosome by inserting a random zone from one chromosome into another chromosome. It also takes care of any overlapping, during this insertion, by redefining the partially overlapped zones, as well as other zones, if required. The function of the operator is explained with the help of an example. As shown in Figure 3, the zone A2 from the second parent (P2 ) is inserted into the first par-
4.3 Mutation Operator The function of a mutation operator in an EA is to make a local search through small changes within a solution (chromosome), and also to maintain diversity among the solutions of a population. Since the various criteria of the graph partitioning problem can be fulfilled only by balancing the sizes of its zones, a mutation operator is developed for this problem to alter the sizes of various zones. The operator shifts a random boundary node of a zone to one of its adjacent
628
B
6 5
14
15
A
13
D 17
11
4 8
2
5
16
12
3
6
20
7
1
14
1
19
13
8 3
10
(a) Before mutation.
9
c
15
23
1
43
25
(b) After mutation.
2
14
28
17 27
45 34
48 46 3
44
9
6
10
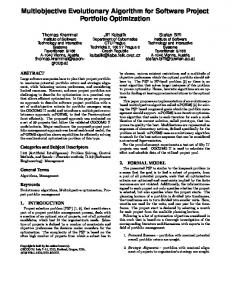
Figure 5: A 50-node graph. the graph into 4 zones, and f2 will seek 10 nodes per zone with a total of 5 zones, thus conflicting with each other. At the time of solving the problem, f1 and f2 are normalized by dividing, respectively, by the total weight and the total number of nodes in the graph. The obtained Pareto front, i.e. the set of the final non-dominated trade-off solutions in terms of the objective values, is shown in Figure 6(a). There are six solutions in the Pareto front, out of which thee solutions, marked in Figure 6(a) by the points A, B and C, are shown in Figures 6(b)-6(d), respectively. The graphs A and C rep-
NUMERICAL EXAMPLES
60
% difference in zone−size ( f 2 )
For evaluating the performance of the proposed algorithm, four virtual graphs of different sizes are generated. The first one is a very small graph which is composed of 50 nodes only. The second and third graphs are of intermediate sizes with 100 and 200 nodes, respectively. The fourth one is relatively a very big graph having 500 nodes. The (x,y) coordinates of the nodes of a graph are generated randomly, and different pairs of nodes of each graph are connected manually to obtain a connected graph. The 50-node graph is shown in Figure 5, where the numbers inside small circles indicate the serial numbers of the nodes. The linear distance between two connected nodes is taken as the weight (edge-value) between the nodes, e.g. the weight between the connected nodes i and q 2
39
8
1
node 7 of the zone A is shifted to the zone B. Similarly, the boundary node 8 of A is shifted to the zone C. The changes are shown in Figure 4(b) where the zones are relabeled as a, b, c and d. Since a node is just shifted from one zone to another, the integrity of the nodes are not disturbed in this operator, i.e. the status of the integrity constraint (g1 of Eq.(4)) remains the same. The proposed mutation operator is not a new one, but the same with the local search operator, used by Tavares-Pereira et al. [25] in the graph partitioning problem. A similar mutation operator is also used by Datta [8] in the land-use management problem.
38
29
26
Figure 4: Mutation operator where a node is shifted from one zone to another zone.
5.
33
20 19
10
41
42
47
21
11
5
35
4
50
18
12
31
19
11
4
24
40
d 17
32 16
30
16
7
13
22
20
12
a
37
7 49
15
2
C 18
9
b
18
36
zones, thus reduces the size of the first zone and increases that of the second zone. As shown in Figure 4, the boundary
2
j is (xj − xi ) + (yj − yi ) , where (xi ,yi ) and (xj ,yj ) are the coordinates of the nodes i and j, respectively. Then the graphs are partitioned by using the proposed algorithm under different conditions as given in Table 1. As the very first case, the 50-node graph is partitioned under two objectives: (1) minimizing the net loss in weight due to the inclusion of two connected nodes in two different zones and (2) minimizing the net difference in the numbers of nodes in different zones in order to homogenize the zones, i.e. f1 and f2 as given by Eqs. (1) and (2), respectively. It is guessed that the objective f1 will prefer minimum number of zones, while the objective f2 will prefer equal number of nodes in different zones, irrespective of the total number of the zones. Therefore, the above problem-based parameters are chosen in such a way that f1 will attempt to partition
A
50
B
40 30 20
C
10 0 23.5
24.0
24.5
25.0
25.5
26.0
26.5
27.0
% loss in weight ( f 1 )
(a) Pareto front 18
36
37
7 49
13
31 15
23
42
47
19
43
25
38
29
27
39
4
38
29
19
27
43
(b) Graph A
41 33
25
39
38
29 14
28
17 27
45
48
3
44 6
1 26
2
39 48
8
34
46
46 9
42 20
14
8
34
23
11
5
35
47
21
17 45
48 46 3
24 12
15
50
33
25
26
8
10
43
28
17 45
34
19
2
28
44
23
42
32 16
31 40
41
20 1
13
22
30
11
5
35
47
21
14
26 2
15
50
49
12
37
7
24
4
33
18
36
32 16
31 40
41
20 1
13
22
30
11
5
35
4
50
49
12
37
7
24
40
21
18
36
32 16
22
30
9
10
(c) Graph B
6
3
44
9
10
6
(d) Graph C
Figure 6: The 50-node graph under f1 and f2 .
1 A node of a zone is said to be a boundary node if any of its connected node belongs to another zone.
629
EA Related Problem related
Table 1: Problem and EA related numerical data. Data Problem-1 Problem-2 Problem-3 Number of nodes 50 100 200 Number of edges 133 282 575 Number of objectives 2, 3 3 3 Number of constraints 5 5 5 Range of zones [4,6] [5,10] [10,20] Range of nodes per zone [7,15] [7,25] [10,30] Population size 100 100 100 Maximum number of generations 1000 1500 2000 Crossover probability 80% Mutation probability Self-adaptive A
1.60 1.45 f 3 1.30 1.15 1.00
resent the extreme two solutions and the graph B represents an intermediate solution. Although it was guessed that the optimum f1 would prefer 4 zones (the minimum number), there are 5 zones in each of the six solutions of the Pareto front, irrespective of the values of f1 . However, as expected, the optimum f2 gives 5 zones with 10 nodes in each zone. The minimum value of f1 (23.87%) is obtained in the graph A, where the value of f2 is the maximum (52.00%). On the other hand, the minimum value of f2 (0%) is obtained in the graph C, where the value of f1 is the maximum (26.79%). Although such good conflicting solutions are obtained under the considered condition, many zones in the solutions of Figures 6(b)-6(d) are observed having some irregular shapes, particularly a huge spread along one direction compared to that along the other direction. Such a situation might have taken place as no condition was imposed for a zone to be of compact size. Therefore, the problem is solved again under all thee three objectives, f1 , f2 and f3 , as given by Eqs. (1)(3), where f3 prefers zones of compact size. Like f1 and f2 , f3 is also normalized by dividing it by the total spread of the graph along both the coordinate directions. All other problem and EA related parameters are kept the same as above. Out of 100 solutions in the population, 75 solutions are found in the final Pareto front. The three-dimensional Pareto front is shown in Figure 7(a), where the extreme three solutions, having the optimum values of f1 , f2 and f3 , are marked by points A, B and C, respectively. The graphs, corresponding to these three points, are shown in Figures 7(b)7(d), respectively. The objective values in the graphs A, B and C of Figure 7 are (0.22,0.52,1.50), (0.27,0.00,1.35) and (0.32,0.56,1.06), respectively. It is observed in Figures 7(b)7(d) that the zones of compact size, as expected, are obtained from the inclusion of f3 . Moreover, the optimum f1 , which is obtained in the graph A (Figure 7(b)), splits the graph into 4 zones as guessed. As earlier, the optimum f2 gives 5 zones with 10 nodes in each zone of the graph (Figure 7(c)). As better results are obtained under all the three objectives (f1 , f2 and f3 of Eqs. (1)-(3), respectively), the remaining three graphs are studied under these three objectives only, i.e. the two-dimensional cases are not considered in these graphs. The extreme three solutions of the 100-node graph, each of which contains one optimum objective value, are shown in Figures 8(a)-8(c). The objective values in these solutions are (0.18,0.68,1.56), (0.21,0.00,1.77) and (0.25,0.80,1.43), respectively. As expected, the optimum f1 divides the graph
Problem-4 500 1456 3 5 [10,20] [20,60] 100 5000
B C
0.9 0.80.7 .6 0 0.50.4 .3 0
f2
0 0 0.3 .34 0.2 0.28 .30 2 0.20.1 0 0.2 0.220.24 6
f1
(a) Pareto front 18
36
37
7 49
13
31 15
40
42
47
21
1
43
27
45
39
25
17 27
45
48
9
10
3
44
6
(b) Graph A
38
29 14
26 28
39
8
34
1
43
39 48
8
34
46
46 3
27
41 33
20 19
2
17 45
48
8
34
23
42
47
21
38
29
11
5
35
4
14
28
17
24 12
15
40 50
33
25
26 2
28
44
1
43
32 16
31
41
20 19
14
26 2
23
42
47
21
38
29
13
22
30
11
5
35
4
49
12
37
7
24
50
33
25
18
36
32 16
31 15
40
41
20 19
13
22
30
11
5
35
4
50
49
12
37
7
24
30
23
18
36
32 16
22
46
9
10
6
(c) Graph B
3
44
9
10
6
(d) Graph C
Figure 7: The 50-node graph under f1 , f2 and f3 .
(a) Minimum f1
(b) Minimum f2
(c) Minimum f3
Figure 8: The 100-node graph under f1 , f2 and f3 . into the minimum possible number of 5 zones (Figure 8(a)), while the optimum f2 puts equal number of nodes (20 nodes) in each of the 5 zones of the graph (Figure 8(b)). In the case of the 200-node graph also, the optimum f1 divides the graph into the minimum possible number of 10 zones, and the optimum f2 puts equal number of nodes (20 nodes) in each of the 10 zones of the graph. The extreme three solutions of this graph, each of which contains one optimum objective value, are shown in Figures 9(a)-9(c). The objective values in these three solutions are (0.22,1.12,1.99), (0.28,0.00,2.23) and (0.29,1.09,1.72), respectively. Finally, the 500-node graph is partitioned and its extreme three so-
630
Table 2: Brief results of the considered four graphs. Results Number of Solutions containing Whether the optimum Problems solutions the optimum values of objective values are exact ? searched f1 , f2 and f3 f1 f2 f3 (0.22,0.52,1.50) Problem-1 51669 (0.27,0.00,1.35) Not known Yes Not known (0.32,0.56,1.06) (0.18,0.68,1.56) Problem-2 75202 (0.21,0.00,1.77) Not known Yes Not known (0.25,0.80,1.43) (0.22,1.12,1.99) Problem-3 80163 (0.28,0.00,2.23) Not known Yes Not known (0.29,1.09,1.72) (0.14,1.34,2.41) Problem-4 349966 (0.17,0.06,2.73) Not known No Not known (0.22,0.22,2.12)
6. CONCLUSIONS
(a) Minimum f1
(b) Minimum f2
A multi-objective evolutionary algorithm (MOEA) is developed for solving the graph partitioning problem, which has a wide range of applications in various fields of science and engineering. The developed MOEA is a modified version of the well known NSGA-II. The major contributions in the MOEA are that it can optimize multiple objectives simultaneously and can divide a graph into any number of zones within a user specified range. In the present work, three objectives under five constraints are considered for illustrative purpose, depicting that the MOEA can be applied to work with any type and number of objectives/constraints. The performance of the MOEA is presented through its application to four randomly generated graphs of different sizes, varying from very small to very large. Initially the graphs were considered for two objectives – minimum loss in edge values and minimum difference in zone sizes. Due to some odd outcome, a third objective is also added to take into account the shape of a zone. The performance of the MOEA could not be judged fully as the optimum values of the first and third objectives are not known in any case. However, the exact optimum values of the second objective are obtained in three out of the considered four graphs. In the case of the fourth graph, which is the largest one among the considered four graphs, although the exact optimum value for the second objective could not be found, still a very good result with negligible deviation is obtained. Therefore, it can be concluded that, even if not an exact one, well acceptable results can be expected from the developed MOEA. In the future, the performance of the MOEA will be evaluated in some large-size real instances, as well as compared with those of existing algorithms.
(c) Minimum f3
Figure 9: The 200-node graph under f1 , f2 and f3 . lutions, containing the optimum f1 , f2 and f3 , are shown in Figures 10(a)-10(c), respectively. In this case, the problem-
(a) Minimum f1
(b) Minimum f2
(c) Minimum f3
Figure 10: The 500-node graph under f1 , f2 and f3 . based parameters are chosen in such a way that the preference of f1 to obtain 10 zones (the permitted minimum number) could be the preference of f2 also, giving 10 uniform zones with 50 nodes in each zone. However, there are 98 solutions in the final Pareto front, each of which divides the graph into 11 zones. The objective values in the extreme three solutions of the Pareto front, containing the optimum values of f1 , f2 and f3 , are (0.14,1.34,2.41), (0.17,0.06,2.73) and (0.22,0.22,2.12), respectively. The optimum f2 (Figure 10(b)) divides the graph into 11 zones with 45 nodes in 6 zones and 46 nodes in 5 zones. That is, although 10 uniform zones with 50 nodes in each zone could not be obtained, zones with almost uniform sizes could be achieved. The obtained results of all the considered four graphs are summarized in Table 2 which displays the total number of solutions searched, solutions containing the optimum objective values, and the natures of the obtained optimum objective values.
7. ACKNOWLEDGMENTS This work is carried out under the first author’s postdoctoral fellowship grant at Instituto Superior T´ecnico, Portugal, offered by the Funda¸c˜ ao para a Ciˆencia e a Tecnologia, Minist´erio da Ciˆencia, Tecnologia e Ensino Superior, Portugal, under the Bolsa Referˆencia: SFRH/BPD/34482/2006.
8. REFERENCES
[1] R. K. Ahuja, A. Kumar, K. C. Jha, and J. B. Orlin. Exact and heuristic algorithms for the weapon target
631
[2]
[3]
[4]
[5]
[6]
[7]
[8]
[9]
[10]
[11]
[12]
[13]
[14]
assignment problem. Operations Research, 55(6):1136–1146, 2007. K. Andreev and H. R¨ acke. Balanced graph partitioning. Theory of Computing Systems, 39:929–939, 2006. Z. Baruch, O. Cre¸t, and K. Pusztai. Genetic algorithm for circuit partitioning. In Fifth Int. Conf. on Engineering of Modern Electric Systems: Section Computer Science and Control Systems, pages 19–23, Oradea, 1999. P. K. Bergeya, C. T. Ragsdaleb, and M. Hoskotec. A decision support system for the electrical power districting problem. Decision Support Systems, 36:1–17, 2003. B. Bozkaya, E. Erkut, and G. Laporte. Discrete optimization: A tabu search heuristic and adaptive memory procedure for political districting. European Journal of Operational Research, 144:12–26, 2003. T. N. Bui and B. R. Moon. Genetic algorithm and graph partitioning. IEEE Transcations on Computers, 45(7):841–855, 1996. R. Chandrasekharam, S. Subhramanian, and S. Chaudhury. Genetic algorithm for node partitioning problem and applications in VLSI design. In IEE Proceedings on Computers and Digital Techniques, volume 140, pages 255–260, 1993. D. Datta. Multi-Objective Evolutionary Algorithms for Resource Allocation Problems. PhD thesis, Department of Mechanical Engineering, Indian Institute of Technology Kanpur (IIT-Kanpur), India, 2007. K. Deb. Multi-Objective Optimization using Evolutionary Algorithms. John Wiley & Sons Ltd, Chichester, England, 2001. K. Deb, S. Agarwal, A. Pratap, and T. Meyarivan. A fast and elitist multi-objective genetic algorithm: NSGA-II. IEEE Transactions on Evolutionary Computation, 6(2):182–197, 2002. S. Dutt and W. Deng. Probability-based approaches to VLSI circuit partitioning. IEEE Trans. Computer-Aided Design of Integrated Circuits & Systems, 19(5):534–549, 2000. R. Entriken and S. V¨ ossner. Genetic algorithms with cluster analysis for production simulation. In Proceedings of the 29th Conf. on Winter Simulation, pages 1307–1314, Atlanta, 1997. J. A. Ferland and G. Gu´enette. Decision support system for the school districting problem. Operations Research, 38(1):15–21, 1990. V. D. Ges´ u, R. Giancarlo, G. L. Bosco, A. Raimondi, and D. Scaturro. GenClust: A genetic algorithm for
[15]
[16]
[17]
[18]
[19]
[20]
[21]
[22] [23]
[24]
[25]
[26]
[27]
632
clustering gene expression data. BMC Bioinformatics, (6):289, 2005. G. Getz, H. Gal, I. Kela, D. A. Notterman, and E. Domany. Coupled two-way clustering analysis of breast cancer and colon cancer gene expression data. Bioinformatics, 19(9):1079–1089, 2003. D. E. Goldberg. Genetic Algorithms in Search, Optimization, and Machine Learning. Addison-Wesley, 1989. S. W. Hadley and B. L. Mark. An efficient eigenvector approach for finding netlist partitions. IEEE Transactions on Computer-Aided Design of Integrated Circuits and Systems, 11(7):885–892, 1992. S. Kirkpatrick, C. D. Gelatt, and M. P. Vecchi. Optimization by simulated annealing. Science, 220(4598):671–680, 1983. B. Krishnamurthy. An improved min-cut algorithm for partitioning VLSI networks. IEEE Transcations on Computers, 33(5):438–446, 1984. F. Mel´ıcio, J. P. Caldeira, and A. Rosa. Two neighbourhood approaches to the timetabling problem. In Proceedings of the Practice and Theory of Automated Timetabling V, Fifth International Conference, PATAT 2004, Pittsburgh, PA, USA, pages 267–282, 2004. R. M. Othman, S. Deris, R. M. Illias, Z. Zakaria, and S. M. Mohamad. Automatic clustering of gene ontology by genetic algorithm. Int. J. of Information Technology, 3(1):37–46, 2006. S. M. Sait and H. Youssef. VLSI Physical Design Automation. McGraw-Hill, 1995. J. Shi and J. Malik. Normalized cuts and image segmentation. IEEE Trans. Pattern Analysis & Machine Intelligence, 22(8):888–905, 2000. K. Tagawa, T. Fukui, and H. Haneda. Phenotypic genetic algorithm for partitioning problem. In IEEE Int. Conf. on Evolutionary Computation, pages 553–556, Indianapolis, 1997. F. Tavares-Pereira, J. R. Figueira, V. Mousseau, and B. Roy. Multiple criteria districting problems: The public transporation network pricing system of the Paris region. Annals of Operations Research, 154(1):69–92, 2007. H. H. Yang and D. F. Wong. Efficient network flow based min-cut balanced partitioning. IEEE Transactions on Computer-Aided Design of Integrated Circuits and Systems, 15(12):1533–1540, 1996. A. A. Zoltners and P. Sinha. Sales territory alignment: A review and model. Management Science, 29(11):1237–1256, 1983.