Sensors 2013, 13, 11184-11195; doi:10.3390/s130911184 OPEN ACCESS
sensors ISSN 1424-8220 www.mdpi.com/journal/sensors Article
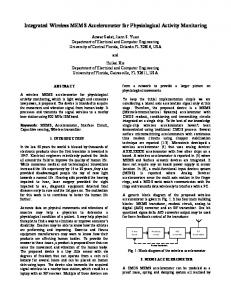
Identification of Capacitive MEMS Accelerometer Structure Parameters for Human Body Dynamics Measurements Vincas Benevicius, Vytautas Ostasevicius * and Rimvydas Gaidys Institute for Hi-Tech Development, Faculty of Mechanical Engineering and Mechatronics, Kaunas University of Technology, Studentu 65-209, Kaunas LT-51369, Lithuania; E-Mails:
[email protected] (V.B.);
[email protected] (R.G.) * Author to whom correspondence should be addressed; E-Mail:
[email protected]; Tel.: +370-698-12-588; Fax: +370-37-353-637. Received: 19 July 2013; in revised form: 12 August 2013 / Accepted: 16 August 2013 / Published: 22 August 2013
Abstract: Due to their small size, low weight, low cost and low energy consumption, MEMS accelerometers have achieved great commercial success in recent decades. The aim of this research work is to identify a MEMS accelerometer structure for human body dynamics measurements. Photogrammetry was used in order to measure possible maximum accelerations of human body parts and the bandwidth of the digital acceleration signal. As the primary structure the capacitive accelerometer configuration is chosen in such a way that sensing part measures on all three axes as it is 3D accelerometer and sensitivity on each axis is equal. Hill climbing optimization was used to find the structure parameters. Proof-mass displacements were simulated for all the acceleration range that was given by the optimization problem constraints. The final model was constructed in Comsol Multiphysics. Eigenfrequencies were calculated and model’s response was found, when vibration stand displacement data was fed into the model as the base excitation law. Model output comparison with experimental data was conducted for all excitation frequencies used during the experiments. Keywords: capacitive; accelerometer; MEMS; optimization; proof-mass; L-shaped beam
Sensors 2013, 13
11185
1. Introduction A new technology usually begins with experimentation. Anything that is ever built must be designed first. This is immediately followed by modeling as one wants to know how well the device works before it is built so that expensive experimentation can be reduced. Modeling techniques and tools enable analysis of an existing design. The design itself is largely dependent on the experience, expertise and the creativity of the designer. Optimal synthesis techniques have the potential to reduce this reliance on the human designer by automatically generating designs matching user-specified requirements [1]. Microaccelerometer synthesis algoritms have been successfully applied to the automatic layout of surface-micromachined accelerometers [2]. A prerequisite for synthesis was a set of lumped-parameters models that adequately linked device behaviour with physical design variables. Optimal synthesis enabled exploration of the entire design space given specific user-specified constraints, as has been shown with the accelerometer example. Concepts of multidisciplinary design and optimization were introduced in [3] for overall and preliminary design of a microgyroscope. Optimization of the design of such a system requires a thorough understanding of the coupling effects of their working environments, their physical structural parameters, their electronic construction, and their fabrication processes. A tuning fork gyroscope was taken as an exemple to demonstrate the principle for optimizing the necessary multidisciplinary design procedures in designing MEMS. Tay et al. presented a single crystal silicon low-g open loop microaccelerometer designed and fabricated through a spreadsheet optimization methodology [4]. The paper begins with the theoretical formulation and analysis of the differential capacitive accelerometer. The effects of the electrostatic spring constant on the natural frequency and sensitivity of the accelerometer have been thoroughly discussed. The ratiometric error for this system has been optimized. A topology optimization-based approach is used in [5] for the design of micromachined force amplifiers in inertial sensor applications. Technological constraints require that the results of the topology optimization mechanisms should be converted to beam element models and subjected to a further size and shape optimization. The dependence of geometrical and mechanical parameters on the optimization is studied. Paper [6] deals with the possibility of vibration mode control of MEMS devices having large potential in various micro-sensor/actuator applications. The presented numerical analysis focuses on the first three flexural vibration modes and their influence on dynamic characteristics. Advantages and drawbacks deriving from the use of MEMS accelerometers for hand-arm and whole-body vibration measurements are evaluated in [7]. Metrological performances of different transducers are assessed through the identification of their frequency response function, linearity, floor noise and sensitivity to thermal and electromagnetic disturbances. Experimental results highlighted a standard instrumental uncertainty with the single frequency calibration procedure. The temperature effect was negligible and the electromagnetic disturbances sensitivity was comparable to that of the piezoelectric accelerometers. The footstep vibration signals are measured in [8] by floor-mounted MEMS accelerometers deployed tangent to wall sides, for estimating the level of indoor physical activity. With growing concern about obesity in older adults and disabled people, this paper deals primarily with the estimation of energy expenditure in the human body. It also supports the localization of footstep sources, extraction of statistical parameters on daily living patterns, and identification of pathological gait patterns. Unlike other sensors such as cameras or microphones, MEMS accelerometer sensors can measure many
Sensors 2013, 13
11186
biomedical signatures without invoking personal privacy concerns. Accelerometers in [9] are commonly used in motion analysis systems to enable researchers to conduct studies outside of the traditional laboratory environment; however the available systems tend to be bulky and unsuitable for long-term studies. Therefore, a need exists for a physically robust, yet compact motion analysis system that can be easily worn for an extended time period without disrupting the person’s normal range of motion. The aim of this research work is to investigate the applicability of optimization techniques for identification of MEMS accelerometer structures for human body measurements, when any information available from the accelerometers’ producer is limited. The paper is organized as follows: Selection of accelerometer structure is made in Section 2, accelerometer model and its validation are presented in Section 3. Concluding remarks are provided in the final Section 4. 2. Selection of Accelerometer Structure The availability of a system capable of automatically classifying the physical activity performed by a human subject is extremely attractive for many applications in the field of healthcare monitoring and in developing advanced human-machine interfaces. The information on the human physical activity is valuable in the long-term assessment of biomechanical parameters and physiological variables. Serious estimation errors may occur when wearable sensor systems composed of motion sensors, such as accelerometers, are used without any regard to what the subject is actually doing [10]. In order to define digital acceleration signal characteristics and guidelines for the hardware selection and safe filtering thresholds to be used, body acceleration signals analysis must be performed in order to identify possible maximum accelerations and signal bandwidth. Such an analysis can only be performed with quantitative analysis methods such as photogrammetry, which allows precise and reliable measurements from images [11]. Cameras and markers are suggested for this analysis as the technique with least 3D space restrictions compared to radiography or magnetic resonance imaging. An experiment when the subject starts walking very slowly and gradually increases his speed to the level he can still cope with would completely cover the range of acceleration signals that can be produced during everyday physical activities considering acceleration signal bandwidth and amplitude. The results of human body acceleration signal analysis could suggest some guidelines for the accelerometer to be chosen. Vertical movement is a major component in everyday physical activities. Walking, running, sitting up and down among them are most common movements. Body locations, as defined in Figure 1, were tracked using six ProReflex MCU 500 Type 170 241 cameras with Qualisys Track Manager Software from Qualisys and utilizing Treadmill “Vision Fitness Premier” model T9450 HRT. The ProReflex MCU uses a 680 × 500 pixel CCD image sensor. The use of CCD technology results in very low-noise data compared to a higher resolution CMOS sensor which has a considerably higher pixel noise levels. By using a patented sub-pixel interpolation algorithm, the effective resolution of the ProReflex MCU is 20,000 × 15,000 subpixels in a normal setup, in some cases enabling the ProReflex MCU to discern motions as small as 50 µm [12]. Experiments started with slow 0.8 km/h walking, was gradually increased to 13 km/h intensive running and decreased back to 0.8 km/h. Speed was changed in increments/decrements of 0.1 km/h with a delay of 5 s. Three cycles were performed for each test subject. All motion data (direction x, y and z) was captured with data sampling rate of 500 Hz to keep raw data at the maximum resolution that was allowed by the
Sensors S 2013, 13
111887
hardware. h A All captured data was filtered usingg 20 Hz low w pass filter with 80 dB B attenuation n at 25 Hz as a bandwidth b oof 20 Hz is where w naturral human m movements occur. o F Figure 1. Set S of locatio ons to be traacked on the human bo ody during eexperimentss.
Residual analysis waas performeed for everyy data set in n the given bandwidth of 20 Hz by b employinng th he MATLA AB routine that was deeveloped. D During resid dual analysiis error ef w was calculatted for everry frequency f beetween 1 Hz and 20 Hzz:
e f = max( xi − yi
)
(11)
where w xi is measured data samplle, yi is filltered data sample usiing low paass filter with passbannd frequency f f. Values oof ef were monitored m while w f was gradually decreased d from f 20 Hzz in steps of 1 Hz. Saffe passband p freequency is considered such valuee of f that is i captured as soon ass ef starts to o nonlinearlly in ncrease whiile f decreasse. The anallysis suggessted safe paass band freq quency of 1 6 Hz (Table 1). Table 1.. Residual analysis a resuults for walk king/runnin ng task data samples. Data set Chest Back Right biceps Left bicepss Left hip Right hip Left wrist Right wristt Left thigh Right thigh h Left tarsus Right tarsuss
Suggessted pass ba and frequenccy, Hz 10 10 11 11 11 10 10 10 16 16 16 16
Sensors 2013, 13
11188
The differentiator filter was applied twice to obtain accelerations for every marker that was tracked. Maximum accelerations observed during experiments are given in Table 2. Ledoux and Hillstrom during their research [13] obtained that peak-to-peak accelerations in the tarsus area (talus) were up to 6.75 g. This is similar to the measurements that were aqcuired during this research, however the scope of analyzed movement was not only walking but also running up to 13 km/h. Also the choise of data filtering might be the reason of different maximum values obtained as high frequencies are removed (or left). Table 2. Maximum accelerations observed in three directions. Position Chest Back Biceps Hip Wrist Thigh Tarsus
Max (|ax|), m/s2 15.879 22.437 23.812 28.145 31.656 35.736 66.873
Max (|ay|), m/s2 38.277 38.587 19.476 37.636 32.347 36.232 24.016
Max (|az|), m/s2 35.708 18.750 39.375 45.645 71.700 39.749 56.383
According to Qu et al. [14] typical body acceleration amplitude can range up to 12 g. As industrial accelerometers that are available through major electronic components dealers (Farnell, Digikey, etc.) have ranges ±2 g, ±4 g, ±6 g, ±8 g, ±16 g, due to limitations in availability of ±12 g accelerometers, ±16 g acceleration data should be chosen. It is common for the MEMS accelerometer to have its sensing part fit into area of ~1 mm2 [10]. Thus the first model requirement is that sensing element must fit into area of 1–1.3 mm2. It is also common to use silicon as the primary material in the manufacturing process [15]. The manufacturing process also defines that the sensing part must be developed as a 2D structure. However, operation requirements specify that the sensing part should measure on all three axes as it is a 3D accelerometer and sensitivity on each axis must be equal, that’s why the lumped models for the main components of the proof-mass support were not be chosen. According to the values of the observed acceleration magnitudes and resulting guidelines the accelerometer that is to be identified should have a measuring range of ±16 g. The total non-linearity from the sensing element, electronics and from other sources should not be more than 1% of full scale output (FSO). The accelerometer should have a bandwidth (±3 dB) of >100 Hz and the cross-axis sensitivity should be limited to a maximum of 1% of FSO. The accelerometers bias stability and hysteresis values are specified as 0.15% of FSO each. Finally the accelerometer should have a response time of less than 1 ms and it should perform over a temperature range of −20 to 80 °C. The configuration of the capacitive accelerometer should be chosen in such a way, that the proof-mass should be free from squeeze damping effects and supported in vacuum on all four sides by shaped beams, that permit for a proof-mass piston-like movement and remain parallel to electrodes at all accelerations as well. Also any geometrical change in the beam length due to temperature variation limits the proof-mass to in-plane rotation only and it does not experience any out of plane bending. This configuration reduces the overall accelerometer chip size thereby improving the per wafer yield and also reduces the non-linearity associated with support structures. The most favorable beam configurations for this purpose are L-shaped cantilever beams (Figure 2). According to
Sensors S 2013, 13
111889
Yoshida Y et al. such a beam tends to give bbetter sensittivity [16]. Thus we ddefine addittional modeel requirementt: sensing part p model will be L L-shaped beeams as th he primary structure with w internaal damping d caapability. Based B on all a collectedd requirem ments we define initiaal accelerom meter modeel geometry g that is given in i Figure 2 and Table 33. F Figure 2. Co omputationaal scheme of o MEMS acccelerometeer.
Table 3. Initial acccelerometerr model pro operties. Propertyy Materiall Overall O size (top) L-shaped d beam crosss section sizee Proof mass size
Va alue Si S 1 mm m 2 50 × 50 µm 100 × 100 µm
3. 3 Accelerom meter Mod del and Its Validation V To invesstigate the applicability of the optimizatiion techniq que for ide dentification n of MEM MS acceleromet a ter structuree parameterss, the acceleerometer (F Figure 2) 3D D finite elem ment modell was createed using u Comssol with Maatlab finite element annalysis softw ware. MEM MS operatioon requirem ments speciffy th hat sensingg part shoulld measure on all threee directionss as it is 3D D accelerom meter and sensitivity s o on each e axis muust be equall. Consequeently the beaam cross seection and mass m densityy of proof-m mass materiaal were w chosenn as structurre parameterrs. Requirem ment of moddel’s sensitiv vity equality ty can be deefined as follows:
u (1, A ) = u (2, A) = u (3, A) u (i, A) ≠ 0
(22)
where w u(i,A A) is a dispplacement along a axis I = 1,2,3 (defines ax xis x, y annd z accord dingly) wheen acceleration a n of magnituude A is app plied to the m model along g the same axis. a
Sensors 2013, 13
11190
Error function can be defined as:
e(i, t ) = um (i, t ) − a(i, t )
(3)
Here I = 1,2,3 and defines axis x, y and z accordingly; um (i, t ) — acceleration that is showed by the model at the moment t. Here it is assumed that dynamic excitation is governed by a(i,t) = sin(2πft), where f is excitation frequency. Optimization problem that is to be solved in respect of accelerometer beam cross section height and mass density of proof-mass material:
min t ≥0
um (i, t , h, ρ ) −
d 2 (sin(2πft ) dt 2
(4)
where um (i, t , h, ρ ) —acceleration of proof-mass at the moment t with accelerometer beam cross section height h and mass density of proof-mass material ρ ; f—excitation frequency. Defined optimization problem has following constraints: f ∈ (0;20] u (i, A, h, ρ ) = u ( j , A, h, ρ ), i ≠ j u (i, A, h, ρ ) ≠ 0 A ∈ (−160;0) ∪ (0;160) i, j = 1,2,3 h ∈ (0;10 −4 ) 4 ρ ∈ (0;10 )
(5)
These constraints come both from requirements described earlier as well as real world conditions: • • • • •
•
f ∈ (0;20] : frequency is limited for example to 20 Hz; u (i, A, h, ρ ) = u ( j , A, h, ρ ), i ≠ j : is the axis sensitivity requirement; u (i, A, h, ρ ) ≠ 0 : a constraint to avoid the zero displacement condition where formally axis equal
sensitivity requirement would be met; 2 A ∈ (−160;0) ∪ (0;160) : maximum acceleration levels are limited to 160 m/s in both directions on any axis because it’s common for industrial accelerometers to have measurement range of ±16 g; h ∈ (0;10 −4 ) : beam cross section height constraint that corresponds to real world manufacturing process; ρ ∈ (0;10 4 ) : mass density of proof-mass material constraint.
The width w of cross section of accelerometers beam is explicitly set to be 4 µm as such dimension is used for mechanical springs in the accelerometers design [15]. Taking into consideration the origin of the problem it is possible to solve the problem for only one value of A. All other values would give the same result because the requirement for equality in sensitivity across all axes is set throughout all accelerometers operation range. Thus A is set to 10 m/s2. The problem in Equation (4) is redefined as:
min t ≥0
um (i, t , h, ρ ) −
d 2 (sin(2πft ) dt 2
(6)
Sensors S 2013, 13
111991 K ( h)u + C ( h )u = − M ( h, ρ )u u (0) = u (0) = 0 Fz (t ) = Fy (t ) = Fz (t ) = Am A a sin( 2πft )
(77)
The constraints becoome: f ∈ (0;20] u (i, h, ρ ) = u ( j , h, ρ ), i ≠ j u (i, h, ρ ) ≠ 0 i, j = 1,2,3 h ∈ (0;10 −4 ) ρ ∈ (0;10 4 )
(88)
Equation (7) is the governing g equation e off motion wh here K, C, M—matrice M es of structu ure stiffness, damping d annd mass, u , u, u —veectors of ddisplacemen nt, velocity y and accceleration. Body loadds ernal force//volume in all direction n with accelleration A multiplied m b by Fz (t ), Fy (t ), Fz (t ) prescrribed as exte a mass ma oof MEMS acceleromet a ter. The hilll climbing optimizatio on techniquee, which beelongs to thhe lo ocal search family, waas chosen to o solve the pproblem. Inittial variable values for tthe optimizaation problem m −5 3 were w h = 1 × 10 m, ρ = 2,000 kg/m k . Errorr function minimum m (E Equations 4 and 5) waas reached as a sensitivity s eequality waas satisfied d for h = 8.25·μm an nd mass density d of pproof-mass material of o 3 −−10 ρ = 9,083.2 2 kg/m alsoo yielding th he minimal error functiion value off 5.06 × 10 m. The material m witth 3 nearest n valuue of mass density d is copper c (Cu)), with ρ = 8,960 kg/m m , thereforee copper was w chosen as a proof-mass p m material. Fiinal model properties p aare given below in Tablle 4. Table 4. Final acccelerometerr model prop perties. Property P L-shaped beam mateerial Proof mass materi al Overrall size (top)) L L-shaped beaam cross secttion size Proo of mass size
Value V Si Cu 1.23 mm2 4 × 8.25 µm 100 × 100 × 100 µm m
Material model is issotropic. Sillicon (Si) hhas Young’ss modulus of o 170 GPaa, Poisson raation of 0.228 3 and a density of 2,329 kgg/m . Coppeer (Cu) has Young’s modulus m of 120 GPa, PPoisson ratio o of 0.34 annd 3 density d of 8,,960 kg/m . Figuree 3. Final acccelerometeer model geo ometry.
Sensors S 2013, 13
111992
The finaal model (F Figure 3) was w construucted in Co omsol Mulltiphysics ffollowing th he geometrry specification s ns that are given g in Tab ble 4. In orrder to veriffy that first resonant freequencies on o every axis are a outside tthe 20 Hz frrequency raange first thrree eigenfreequencies were w computted. Resultss are given in i 2 Table T 5. Thhe response when acceeleration off 10 m/s was w applied to t the modeel the displacement in z direction d waas 50.49 nm n (Figure 4), displaccement in y direction n was 50.555 nm (Fig gure 5) annd displacemen d nt in x direction was 50 0.54 nm (Figgure 6). Table 5. 5 Accelerom meter modeel eigenfrequencies. First threee eigenfrequ uencies In x direction In y direction In z direction
Vallue, Hz 2,2 238.81 2,2 239.11 2,2 244.52
Figure 4. D Displacemennts field in the t z directiion when 10 0 m/s2 accelleration is aapplied alon ng the z axiss.
Figure 5. Displacem ment field in n y directionn when 10 m/s m 2 acceleration is appplied along the t y axis.
Sensors S 2013, 13
111993
Figure 6. Displacem ment field in n x directionn when 10 m/s m 2 acceleration is appplied along the t x axis.
Displacem ment in thee x direction n differs by 0.090% fro om the disp placement inn the z direection and by b 0.006% 0 from m the displlacement in n the y direection whille displacem ment in thee y directio on differs by b 0.092%. 0 Theese results clearly c show w that equall sensitivity on all axes is achievedd in the mod del. Experimeental data thhat was acq quired by m monitoring uniaxial u vibrration standd movementt was used to t validate v the acceleromeeter model. Vibration V sttand displaccement dataa was fed innto the modeel as the basse excitation e laaw and moddel’s respon nse was obsserved. Acccelerations that t were accquired from the modeel output o were compared with w vibratiion stand acccelerationss during exp periment to see how weell the modeel fits f real worrld process. Proof-maass displaceements werre analyzedd for all accceleration ranges giveen by the optimizatioon problem p connstraints (4)). Results sh how that deppendence between disp placement aand acceleraation is lineaar, itt means that accelerattion converrsion into ddigital sign nal is possib ble by meaasuring thee capacitancce between b twoo plates whhere one iss on the boounding box x and other is on thee proof masss. Electricaal capacity c bettween two plates p is inv versely relatted to the diistance betw ween plates and linearly y depends on o th he area off overlap between theese plates. Model outp put comparrison with experimenttal data waas conducted c foor all excitattion frequen ncies that weere used durring experim ment. Table 6 shows thee results. Tab ble 6. Accellerometer’s model outpput comparisson with vib bration stannd acceleratiions. Frequen ncy, Hz 1 4 7 10 14 17 20
Exxcitation amplitude, mm 0.8813 0.9517 0.9510 1.0822 1.0335 0.9891 0.9241
Accelerration amplitud de, m/s2 0.34 80 0.67772 1.83 97 4.27225 7.99 67 11.28849 14.59920
Model M acceleeration amplitude,, m/s2 0.3169 9 0.6296 6 1.7461 1 4.1853 3 7.8770 0 11.1665 14.4876
E Error, % 9.82% 7.56% 5.36% 2.08% 1.52% 1.06% 0.72%
Error, |m/s2| 0.0311 0.0476 0.0936 0.0872 0.1197 0.1184 0.1044
Sensors 2013, 13
11194
The given results show that the model fits the experimental data quite well. Although relative errors go a little over 9% of the acceleration amplitude, absolute errors does not exceed 0.12 m/s2. This shows that the model is valid and stable throughout the bandwidth of 20 Hz. 4. Conclusions An accelerometer model was identified and validated. Silicon was used for L-shaped beams, copper for proof-mass. Overall top size was 1.23 mm2. L-shaped beam cross section size was 4 × 8.25 µm, proof mass size was 100 × 100 × 100 µm. It was shown that the model has first resonant frequencies (over 2,200 Hz) far from the bandwidth of interest (20 Hz). The model achieves equal sensitivity in all directions. Displacement in the x direction differed by 0.090% from displacement in the z direction and by 0.006% from displacement in the y direction when an acceleration of 10 m/s2 was applied to the accelerometer. Displacement in the y direction differed by 0.092% from displacement in the z direction. Validation of the model showed that in a frequency range up to 20 Hz modeled accelerations were up to 10% different from measured values with the absolute error being less than 0.12 m/s2. Acknowledgments High technology project funded by Lithuanian Agency for Science, Innovation and Technology “Development of the Sensor System Technology to Monitor Human Physiological Data Employing MEMS, IT and Smart Textiles Technologies”. Conflicts of Interest The authors declare no conflicts of interest. References 1. 2.
3. 4.
5. 6.
Ananthasures, G.K. Optimal Synthesis Methods for MEMS; Springer US: New York, NY, USA, 2003; p. 150. Mukherjee, T.; Zhou, Y.; Fedder, G.K. Automated Optimal Synthesis of Microaccelerometers. In Proceedings of the 12th IEEE International Conference on Micro Electro Mechanical Systems (MEMS’99), Orlando, FL, USA, 17–21 January 1999; pp. 326–331. Yuan, W.Z.; Chang, H.L.; Li, W.J.; Ma, B.H. Application of an optimization methodology for multidisciplinary system design of microgyroscopes. Microsyst. Technol. 2006, 12, 315–323. Tay, F.E.; Jun, X.; Logeeswaran, V.J. Optimization Methodology for Low-g Microaccelerometer. In Micromachining and Microfabrication; Chau, K.H., Parameswaran, M., Tay, F.E., Eds.; SPIE: Bellingham, WA, USA, 2000; Volume 4230, pp. 128–139. Pedersen, C.B.W.; Seshia, A.A. On the optimization of compliant force amplifier mechanisms for surface micromachined resonant accelerometers. J. Micromech. Microeng. 2004, 14, 1281–1293. Ostasevicius, V.; Gaidys, R.; Dauksevicius, R. Numerical analysis of dynamic effects of a nonlinear vibro-impact process for enhancing the reliability of contact-type MEMS devices. Sensors 2009, 9, 10201–10216.
Sensors 2013, 13 7. 8.
9.
10.
11. 12. 13. 14. 15.
16.
11195
Tarabini, M.; Saggin, B.; Scaccabarozzi, D.; Moschioni, G. The potential of micro-electro-mechanical accelerometers in human vibration measurements. J. Sound Vib. 2012, 331, 487–499. Lee, H.; Park, J.W.; Helal, A. Estimation of Indoor Physical Activity Level Based on Footstep Vibration Signal Measured by MEMS Accelerometer in Smart Home Environments. In Proceedings of the 2nd International Conference on Mobile Entity Localization and Tracking in GPS-Less Environments (MELT’09), Orlando, FL, USA, 30 September 2009; pp. 148–162. Bliley, K.E.; Schwab, D.J.; Holmes, D.R., III; Kane, P.H.; Levine, J.A.; Daniel, E.S.; Gilbert, B.K. Design of a Compact System Using a MEMS Accelerometer to Measure Body Posture and Ambulation. In Proceedings of the 19th IEEE International Symposium on Computer-Based Medical Systems (CBMS 2006), Salt Lake City, UT, USA, 22–23 June 2006; pp. 335–340. Bouten, C.V.C.; Koekkoek, K.T.M.; Verduin, M.; Kodde, R.; Janssen, J.D. A triaxial accelerometer and portable data processing unit for the assessment of daily physical activity. IEEE Trans. Biomed. Eng. 1997, 44, 136–147. Armin, G. Fundamentals of videogrammetry—A review. Hum. Mov. Sci. 1997, 16, 155–187. Benevicius, V.; Ostasevicius, V.; Gaidys, R. Human body rheology impact on measurements in accelerometer applications. Mechanics 2013, 19, 40–45. Ledoux, W.R.; Hillstrom, H.J. Acceleration of the calcaneus at heel strike in neutrally aligned and pes planus feet. Clin. Biomech. 2001, 16, 608–613. Qu, H.; Fang, D.; Xie, H.A. Monolithic CMOS-MEMS 3 axis accelerometer with low noise, low power dual chopper amplifier. IEEE Sens. J. 2008, 8, 1511–1518. Reilly, S.P.; Leach, R.K.; Cuenat, A.; Awan, S.A.; Lowe, M. Overview of MEMS Sensors and the Metrology Requirements for their Manufacture; NPL Report DEPC-EM 008; National Phsycial Laboratory: London, UK, October 2006. Yoshida, K.; Matsumoto, Y.; Ishida, M.; Okada, K. High-Sensitive Three Axis SOI Capacitive Accelerometer Using Dicing Method. In Proceedings of Technical Digest of the 16th Sensor Symposium, Toyohashi, Japan, 2–3 June 1998; pp. 25–28.
© 2013 by the authors; licensee MDPI, Basel, Switzerland. This article is an open access article distributed under the terms and conditions of the Creative Commons Attribution license (http://creativecommons.org/licenses/by/3.0/).