Mar 12, 2014 - where kspr and kv are the spring constants of the proof mass suspension and the V-beam respectively and mth is the thermal amplification ...
Mechanically amplified MEMS optical accelerometer with FPI readout Edward Daviesa, David S. Georgeb, Andrew S. Holmesa a Imperial College London, EEE Department, Exhibition Road, London SW7 2AZ, UK b AWE plc, Aldermaston, Reading, Berks RG7 4PR, UK ABSTRACT We have developed a silicon MEMS optical accelerometer in which the motion of the proof mass is mechanically amplified using a V-beam mechanism prior to transduction. The output motion of the V-beam is detected using a FabryPérot interferometer (FPI) which is interrogated in reflection mode via a single-mode optical fibre. Mechanical amplification allows the sensitivity of the accelerometer to be increased without compromising the resonant frequency or measurement bandwidth. We have also devised an all-optical method for calibrating the return signal from the FPI, based on photothermal actuation of the V-beam structure using fibre-delivered light of a different wavelength. A finite-element model has been used to predict the relationship between the incident optical power and the cavity length at steady state, as well as the step response which determines the minimum time for calibration. Prototype devices have been fabricated with resonant frequencies above 10 kHz and approximately linear response for accelerations in the range 0.01 to 15 g. Keywords: MEMS, optical accelerometer, Fabry-Pérot, photothermal actuation
1. INTRODUCTION Inertial sensors with optical readout are attractive for applications involving harsh environments due to their immunity to electromagnetic interference and their ability to operate without electrical signals or power. Devices of this type are mostly based around a proof mass supported by an elastic suspension inside a housing. Under applied acceleration, inertial forces cause the proof mass to be displaced relative to the housing and this displacement is measured by an optical transducer. Various types of transducer have been investigated, including optical fibre Bragg gratings1, 2, shutters/intensity modulators3, 4 and Fabry-Pérot interferometers (FPIs)5. MEMS-based FPI devices are particularly desirable because they are compatible with microfabrication6, 7 and have the potential for higher sensitivities than intensity-based devices. With all accelerometers employing a suspended proof mass, there is an inherent trade-off between bandwidth and sensitivity. The steady state proof mass deflection, x, under a constant applied acceleration, a, is given by x = a/ωo2, where ωo is the proof mass resonant frequency. Increasing the resonant frequency (and hence the available measurement bandwidth) therefore inevitably leads to a reduction in the mechanical sensitivity,x/a. The overall sensitivity of an FPI accelerometer (i.e. output signal per unit acceleration) can be improved by increasing the cavity finesse, but this can be challenging in a MEMS device where the mirrors tend to be formed by etched sidewalls. An alternative approach, which we have adopted in this work, is to insert a mechanical amplifier between the proof mass and the transducer; this allows a high resonant frequency to be combined with large displacement at the transducer input8, 9. The simplest, and fastest, way to interrogate an FPI transducer is to illuminate it with a narrow-band optical source and measure the reflected or transmitted output intensity. In this case it is necessary to calibrate the system so that the variation of intensity with cavity length is known precisely. If the functional form of the intensity variation is known apart from a scale factor and offset, then only the maximum and minimum intensities need be recorded. In previous work on FPI accelerometers this has typically been done by shaking the device vigorously to produce relatively large cavity length variations, ensuring that the entire intensity range in the FPI fringe pattern is explored. In earlier work we demonstrated a MEMS FPI accelerometer in which the proof mass motion is mechanically amplified by a V-beam mechanism10, 11. In this paper we present further experimental results for this device, and also demonstrate a novel method for remote calibration based on photothermal actuation using fibre-delivered light. The key features of the
MOEMS and Miniaturized Systems XIII, edited by Wibool Piyawattanametha, Yong-Hwa Park, Proc. of SPIE Vol. 8977, 89770Z · © 2014 SPIE CCC code: 0277-786X/14/$18 · doi: 10.1117/12.2040022 Proc. of SPIE Vol. 8977 89770Z-1 Downloaded From: http://proceedings.spiedigitallibrary.org/ on 03/12/2014 Terms of Use: http://spiedl.org/terms
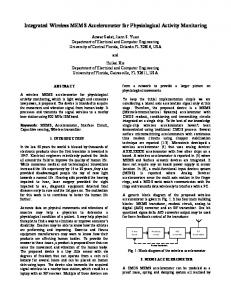
device are illustrated in Fig. 1. The Fabry-Pérot cavity is formed between the cleaved end of the interrogation fibre, which acts as both the input and the output mirror, and a gold-coated silicon mirror block located at the mid-point of the V-beam. A second optical fibre, located on the opposite side of the mirror block, is used to deliver near-infrared (NIR) light for photothermal actuation of the V-beam. This side of the silicon block is uncoated to allow effective absorption in the NIR. The wavelengths used in this work for interrogation and actuation were 1.55 m and 785 nm respectively.
Optical fibre (actuation)
Proof Mass suspension
Optical
fibre (interrogation)
Fig. 1. Schematic of the V-beam amplified accelerometer, showing FPI cavity formed between optical fibre and gold-coated silicon mirror, and second optical fibre delivering laser light for photothermal actuation.
The remainder of this paper is organised as follows. In section two, we briefly review the operating principle of the Vbeam mechanical amplifier, and discuss the use of finite element analysis (FEA) to study its photothermal response. Details of the FPI interrogation scheme used in this work are also given. Experimental methods used for fabrication, calibration and accelerometer performance testing are described in section 3, with experimental results and conclusions being presented in sections 4 and 5.
2. DEVICE THEORY AND OPERATION 2.1. V-beam mechanical amplifier The operational principle of the V-beam mechanical amplifier can be understood from Fig. 2a. Under an applied acceleration, the displacement, x, of the proof mass in the x-direction causes a compression of the V-beam structure along the x-axis. To accommodate this, the V-beam deflects laterally, resulting in an amplified displacement, y, at the mirror block. Assuming the displacements are small, the mechanical amplification factor of the V-beam can readily be shown to be11:
m
y (1 ) x 2(u / u )
(1)
where u = tan and α = (w/l)2. Here w and l are the width and length of the flexures that make up the V-beam structure, and is the V-beam angle. The maximum amplification achievable with a given value of w/l is approximately l/4w, which can be quite large in a MEMS device with long, slender beams. For example, m >10 is easily achievable. The behaviour of the structure under photothermal actuation is shown in Fig. 2b. In this case the V-beam undergoes thermal expansion due to heating at the mirror block, causing the proof mass to move in the negative x-direction i.e. away from the V-beam anchor. Equilibrium is reached when the elastic forces due to the proof mass suspension and the V-beam are balanced. The resulting compression of the heated V-beam leads to an amplified displacement at the mirror
Proc. of SPIE Vol. 8977 89770Z-2 Downloaded From: http://proceedings.spiedigitallibrary.org/ on 03/12/2014 Terms of Use: http://spiedl.org/terms
block of y = m(L – x), where L is the change in length (along x) that would occur in the V-beam if its thermal expansion were unconstrained. Eliminating the proof mass displacement, x, this becomes: y mth L ; mth m
k spr
(2)
k spr k v
where kspr and kv are the spring constants of the proof mass suspension and the V-beam respectively and mth is the thermal amplification factor, which we define as the ratio of the mirror displacement to the unconstrained thermal expansion of the V-beam. From eq. 2 we see that mth is lower than the mechanical amplification factor by an amount which depends on the relative magnitudes of the spring constants. For efficient photothermal actuation, the stiffness of the proof mass suspension should be greater than that of the V-beam.
Mirror block Anchor
Inertial
Ay Y
(a) x
Y
L x
heat
/Proof 1
mass
(b)
Is
Fig. 2. Schematics of V-beam amplifier, showing responses to (a) inertial force and (b) photothermal actuation. In each diagram the shadow shows the original position of the V-beam (before application of force/heat). The V-beam angle has been exaggerated for illustration.
2.2. Finite element analysis of photothermal response Photothermal actuation of the V-beam structure was studied by 3D FEA using COMSOL Multiphysics software. The temperature profile resulting from laser heating was calculated with the anchor points of the suspension springs and Vbeam set to a constant temperature of 293 K. The device fabrication method involves deep reactive ion etching (DRIE) of a bonded silicon-on-insulator (BSOI) wafer. As a consequence, the V-beam has adjacent bulk silicon on both sides and also beneath it, so conductive losses across the associated air-gaps had to be taken into account. These losses were modelled using appropriate heat transfer coefficients. The accelerometer design was similar to those reported by us in earlier papers10,11. The proof mass, with dimensions 1.978 1.978 mm2, was supported on a hammock suspension comprising six flexures, each 1.6 mm long and 78 µm wide. The V-beam flexures were 1.8 mm long and 20 µm wide, with an angle of 2, and the mirror block was 125 m × 60 m. The design was based on a requirement for a resonant frequency above 10 kHz, and with the above suspension and V-beam designs the mechanical and thermal amplification factors were expected to be ~12 and ~7.4 respectively. The depth of the BSOI mechanical layer, and hence of all the moving parts, was 79 m after processing, and the gap between the moving parts and the underlying substrate was 10 m. Other parameters required for the COMSOL modelling can be found in Table 1.
Proc. of SPIE Vol. 8977 89770Z-3 Downloaded From: http://proceedings.spiedigitallibrary.org/ on 03/12/2014 Terms of Use: http://spiedl.org/terms
The NIR laser beam incident on the silicon mirror block was assumed to have a Gaussian profile. For spot sizes lower than about 60 m (1/e2 radius), the incident light was almost entirely intercepted. For spot sizes in this range, differences in spot size only marginally affected the temperature in the irradiated region while having a negligible effect on the temperature distribution elsewhere in the structure. This is to be expected since the total input power delivered to the structure remained constant and highly localised compared to the length of the V-beam. With these factors in mind, an incident beam with a spot size of 30 μm was chosen for subsequent modelling. A typical example of the predicted temperature profile is shown in Fig. 3. The analysis shows that the proof mass acts as a very effective heat sink, with the majority of the temperature variation being confined to the V-beam. This is also to be expected since the proof mass has a large area and hence efficient thermal coupling to the underlying substrate. Table 1. Parameters used to model the V beam behaviour under photothermal actuation.
Description
Value
Thermal conductivity of air
2.6 10-2 Wm-1K-1
Thermal conductivity of silicon
130 Wm-1K-1
Silicon linear coefficient of thermal expansion
2.7 10-6 K-1
Reflection coefficient of silicon at λ = 785 nm
0.33
Absorption coefficient of silicon
1.12 105 m-1
30-
Proof mass
I
1
V -beam
§ 15
1
3
4
Length along device (mm) Fig. 3. Theoretically modelled temperature distribution along a line running the length of the device and taking in the proof mass and the V-beam. The model assumed an incident optical power of 30 mW at the mirror block.
The structural displacements during photothermal actuation were determined by applying the calculated temperature profile to a thermal expansion model in COMSOL. Fig. 4 shows a plot of the steady state displacement in the case where an input power of 32 mW is applied. The displacement at the mirror block is just over 800 nm which is more than sufficient for calibration of the FPI response when interrogating at 1550 nm. It is noted that the displacement of the mass is relatively small, which is consistent with the proof mass suspension having a higher spring constant than the V-beam. The dynamic response of the V-beam was also modelled by turning on the heat source and then recording the displacements at intervals of 0.5 ms over a period of 50 ms. From this it was established that the time-constant associated with the photothermal response was 5.3 ms. This parameter is of interest because it imposes a lower limit on the time taken for photothermal calibration of the device.
Proc. of SPIE Vol. 8977 89770Z-4 Downloaded From: http://proceedings.spiedigitallibrary.org/ on 03/12/2014 Terms of Use: http://spiedl.org/terms
800 700 600 500
400 300 200 100 0 Fig. 4. Modelled displacement of the entire device for an incident NIR laser power of 32 mW.
2.3. In-phase and Quadrature readout In FPI applications where larger cavity length changes are expected, it is necessary to use an interrogation method that is capable of operating over multiple interference fringes. In this work we used the In-phase and Quadrature (I&Q) technique7, where the FPI is interrogated simultaneously at two different wavelengths for which the round-trip phase shifts differ by π/2. Assuming a low-finesse FPI cavity interrogated at two different wavelengths λ1, λ2, the intensities I1, I2 of the returned signals will be approximately of the form:
I 1 a1 b1 cos(1 )
(3)
I 2 a 2 b2 cos( 2 )
where ai are the DC components, bi/ai are the fringe visibilities, and φi = 4πlc/λi are the round-trip phase shifts which depend on the cavity length lc . If the interrogation wavelengths are chosen such that the round-trip phase shifts differ by π/2 (for example, so that φ2 = φ1 – π/2), the variations of I1 and I2 with cavity length will be in quadrature. Given both of the signals I1 and I2, it is possible to measure changes in cavity length without the ambiguities that arise from the periodic nature of the FPI output. Once the parameters a1, b1, a2, b2 have been established by calibration of the system, the transducer signals can be normalised as I’1 = (I1 – a1)/b1 and I’2 = (I2 – a2)/b2 so that: I '1 cos(1 ) , I ' 2 sin(1 )
I '2 I '1
1 tan 1
(4)
3. EXPERIMENTAL METHODS 3.1. Device fabrication The accelerometer structure was defined by photolithography and DRIE in the mechanical layer of a BSOI wafer with an 85 µm-thick mechanical layer and a 4 μm oxide layer. The moving parts were released by HF vapour etching to remove the buried oxide layer. The DRIE process caused an undercutting of the silicon, which is typical when etching to a buried oxide layer. This increased the gap between the structure and substrate to 10 µm, giving a final mechanical layer depth of 79 m.
Proc. of SPIE Vol. 8977 89770Z-5 Downloaded From: http://proceedings.spiedigitallibrary.org/ on 03/12/2014 Terms of Use: http://spiedl.org/terms
A ~200 nm thick layer of gold was sputter coated onto the device following HF release to increase the mirror reflectivity and eliminate unwanted spurious multiple cavity effects. Selective etching was carried out using an iodine based gold etchant, with photoresist being applied to one mirror surface to act as a protective layer. Finally the resist was removed using acetone and the device was freeze dried to avoid stiction of the released structures. The optical fibres were positioned with their cleaved end-faces between 20 and 40 m from the silicon mirror block. For the interrogation optical fibre, this produced an FPI cavity with a free spectral range (FSR) between 60 nm and 30 nm at 1550 nm wavelength. This choice of FSR was compatible with the tunable filters used in the interrogation setup, and the cavity length ensured that the fibre was always at a safe distance from the mirror which was constrained to a maximum displacement of 10 m. Following alignment, the fibres were secured using Loctite 358 UV curable adhesive. An SEM image of the silicon mirror block on the final device, with both fibres in position, is shown in Fig. 5.
\' -beam
Gold
Optical fibre (interrogation)
tilir 100pn
w,
Optical fibre (actuation)
i:c,a blixk
w1..I 1E1x
-,:.
EHT.20.00kv
SipnY A SE1 WD
14 mm
Phoro No.
1897
pag :12 JJ 2013 Tirr :11;17:13
Fig. 5. SEM image of prototype device after HF release and with optical fibres glued in position. There is a large goldcoated region around the left-hand optical fibre, highlighting the location of the resist used to protect one side of the mirror block during the gold etching process.
3.2. Calibration and testing Prototype devices were calibrated and tested using the setup shown in Fig. 6. Interrogation of the FPI was carried out using light from a broadband source (type Agilent 834378A), centrally located at 1550 nm. This was coupled into the device via a circulator. The light reflected from the FPI was divided into two equal components using a 3 dB coupler; these were fed to separate amplified photodiodes via a pair of tuneable optical filters (Newport Corporation type TBF1550-1.0, 20 dB bandwidth of 3.5 nm) which were set to be I&Q with reference to the FPI spectrum of the device. The photodiode outputs were recorded using a National Instruments data acquisition module which allowed sampling at up to 24 kbits/s on each channel. Analysis of the recorded data was carried out using LabView. Photothermal actuation was achieved using a 785 nm laser with a single-mode fibre pig-tail (Thorlabs type LP785SF100). During the calibration process the output power of the laser was modulated over the range 0 to 30 mW while simultaneously recording the I&Q photodiode outputs. The I&Q datasets were then plotted against each other to form a Lissajous figure, and an ellipse was fitted to the data in order to determine the coefficients in eq. 3. Following calibration, the linearity of the relationship between laser power and cavity length was investigated. The laser power was manually stepped from 0 to 32 mW in 2 mW increments, and the reflection spectrum was recorded at each power setting using an optical spectrum analyser. The mode order was calculated from this and combined with the measured shift in the FPI fringes to calculate the induced change in cavity length. The dynamic response to the NIR laser was also measured. For this test the NIR laser power was stepped from zero to a constant level of 32 mW, and the time variation of the cavity length was recorded using the I&Q readout system. The performance of the device as an accelerometer was tested by mounting it on an aluminium block attached to a digitally controlled shaker table (IMV type PET-05). At a fixed frequency of 50 Hz, the shaker table was capable of producing a sinusoidal output with amplitude up to 15 g, zero-to-peak. The output acceleration of the shaker was controlled in a feedback loop using a commercial capacitive accelerometer mounted immediately adjacent to the device
Proc. of SPIE Vol. 8977 89770Z-6 Downloaded From: http://proceedings.spiedigitallibrary.org/ on 03/12/2014 Terms of Use: http://spiedl.org/terms
under test. The I&Q intensities were recorded for 10 seconds at each acceleration level and converted to an equivalent variation in phase. A fast Fourier transform (FFT) was then performed on the extracted phase signal and the magnitude of the spectral peak at 50 Hz was taken as a measure of the accelerometer’s response.
785 nm Laser
Accelerometer 0
1I
7 Broad band light source
Tuneable filters
Photodiodes
DAQ and computer acquisition
Circulator 3 dB coupler
Fig. 6. Experimental setup for I&Q interrogation and photothermal actuation.
4. RESULTS Fig. 7 shows a typical set of data from the photothermal calibration process. The raw I&Q signals from the two amplified photodiodes are plotted in Fig. 7a as a function of time as the power of the 785 nm laser is varied. The corresponding Lissajous diagram is shown in Fig. 7b along with the best-fit ellipse used to estimate the parameters for normalisation and removal of the DC components. It is noted that the experimental Lissajous figure is not perfectly elliptical, implying that the FPI fringe patterns are not pure sinusoids; this inevitably leads to linearity errors when eq. 4 is used to estimate the cavity length from the I&Q signals.
7
6 5
4
3 `JV
2
-Q data
2
Data
- Ellipse fit
-I data 1
10
0.5
1
1.5
2
2.5
2
3
4
5
Time (s)
Il Intensity (V)
(a)
(b)
6
7
Fig. 7. Typical photothermal calibration data acquired by manually tuning the 785 nm laser power from 0 to 30 mW: (a) raw I&Q photodiode signals captured during the laser intensity sweep; (b) corresponding Lissajous figure and best fit ellipse.
The measured variation of cavity length with NIR laser power over the range 0 to 32 mW is shown in Fig. 8a, along with the linear variation predicted by the FEA model. The overall trend in the experimental data is in good agreement with the
Proc. of SPIE Vol. 8977 89770Z-7 Downloaded From: http://proceedings.spiedigitallibrary.org/ on 03/12/2014 Terms of Use: http://spiedl.org/terms
theoretical prediction, with a cavity length change of 785 nm being produced at a laser power of 30 mW. The reason for the departures from linearity in the experimental data is currently unknown. The measured variation of cavity length with time following switch-on of the NIR laser is shown in Fig. 8b, together with a predicted response based on the COMSOL modelling work. The driver for the NIR laser was found to have a soft-start with a time-constant of ~12 ms, and combining this with the thermal time-constant of 5.3 ms from COMSOL gave an overall rise-time (to 63%) of 18.2 ms which was close to the experimental value 19.5 ms.
800
s
- Thermal modelling Experimental
600
Ú 400 c
- Experimental
it 200
200
- Model
cs ..=
U 00
10 20 Laser Power (mW)
30
20 30 Time (ms)
10
(a)
40
50
(b)
Fig. 8. Measured and modelled variations of (a) cavity length with NIR laser power in steady state, and (b) dynamic response during switch-on of NIR laser.
ln
Ó
ti
ro
n
> n
O
00
0 ó ó ó ir
Measured Phase (radians)
The performance of the device over a range of input accelerations is shown in Fig. 9. The accelerometer had a sensitivity of 0.081 rad/g and could operate down to 0.01 g and up to 15 g giving a dynamic range greater than 103. The device showed a near linear response over the range examined, with the departures from non-linearity being attributed mainly to the non-sinusoidal FPI response. This could in principle be corrected for by using the measured Lissajous figure to map the I&Q intensities to the phase.
Fig. 9. Measured accelerometer response for sinusoidal input accelerations in the range 0.01 to 15 g at 50 Hz, with a linear line of best fit through the data.
5. CONCLUSIONS A V-beam amplified FPI accelerometer has been presented which uses photothermal actuation for calibration of an I&Q readout system. The use of photothermal actuation allows remote calibration over optical fibre, allowing the advantages of an all-optical approach to be retained. Finite element analysis has been used to study the photothermal actuation process, and has been shown to be in good agreement with the measured results for both the steady state and dynamic responses. A prototype device was fabricated with a V-beam of length 1.8 mm, width 20 m and angle 2, giving a
Proc. of SPIE Vol. 8977 89770Z-8 Downloaded From: http://proceedings.spiedigitallibrary.org/ on 03/12/2014 Terms of Use: http://spiedl.org/terms
mechanical amplification ~12. A 785 nm laser with a power of up to 30 mW was used heat the structure, and was found to be capable of inducing a 785 nm cavity length change, which was more than sufficient to produce a full Lissajous figure at the measurement wavelength used. The accelerometer response was explored by applying 50 Hz sinusoidal input accelerations and measuring the amplitude of the extracted I&Q phase signal via a large sampled FFT. The response was found to be approximately linear and accelerations over the range 0.01 to 15 g could be recorded.
ACKNOWLEDGMENT The authors would like to thank AWE plc for supporting this research.
REFERENCES [1] Berkoff, T.A. and Kersey, A.D., “Experimental demonstration of a fiber Bragg grating accelerometer,” IEEE Photonics Technology Letters, 8(12), 1677-1679 (1996). [2] Fender, A., MacPherson, W. N., Maier, R., Barton, J.S., George, D.S., Howden, R.I., Smith, G.W., Jones, B., McCulloch, S., Chen, X., Suo, R., Zhang, L. and Bennion, I., “Two-axis temperature-insensitive accelerometer based on multicore fiber Bragg gratings,” IEEE Sensors Journal, 8(7), 1292-1298 (2008). [3] Llobera, A., Seidemann, V., Plaza, J.A., Cadarso, V.J. and Buttgenbach, S., “Integrated polymer optical accelerometer,” IEEE Photonics Technology Letters, 17(6), 1262-1264 (2005). [4] Rines, G.A., “Fiber-optic accelerometer with hydrophone applications,” Appl. Opt., 20(19), 3453-3459 (1981). [5] Ke, T., Zhu, T., Rao, Y. and Deng, M., “Accelerometer based on all-fiber Fabry–Pérot interferometer formed by hollow-core photonic crystal fiber,” Microwave and Optical Technology Letters, 52 (11), 2531-2535 (2010). [6] Zandi, K., Wong, B., Zou, J., Kruzelecky, R.V., Jamroz, W. and Peter, Y.A., “In-plane silicon-on-insulator optical MEMS accelerometer using waveguide fabry-perot microcavity with silicon/air bragg mirrors,” Proc. 23rd IEEE International Conf. on Micro Electro Mechanical Systems (MEMS), 839-842 (2010). [7] Pocha, M.D., Meyer, G.A., McConaghy, C.F., Swierkowski, S.P. and Wolfe, J.D., “Miniature accelerometer and multichannel signal srocessor for fiber optic Fabry-Perot sensing,” IEEE Sensors Journal, 7(2), 285-292 (2007). [8] Ya'akobovitz A. and Krylov, S., “Toward sensitivity enhancement of MEMS accelerometers using mechanical amplification mechanism,” IEEE Sensors Journal, 10(8), 1311-1319 (2010). [9] Zeimpekis, I., Sari, I. and Kraft, M., “Characterization of a mechanical motion amplifier applied to a MEMS accelerometer,” Journal of Microelectromechanical Systems, 21(5), 1032-1042 (2012). [10] Davies, E., George, D.S., Gower, M.C. and Holmes, A.S., “Optical accelerometer with mechanical amplification via a V-beam mechanism,” Proc. 26th IEEE International Conf. on Micro Electro Mechanical Systems (MEMS), 609-612 (2013). [11] Davies, E., George, D.S., Gower, M.C. and Holmes, A.S., “MEMS Fabry-Pérot optical accelerometer employing mechanical amplification via a V-beam structure,” Sensors and Actuators A: Physical, in press.
Proc. of SPIE Vol. 8977 89770Z-9 Downloaded From: http://proceedings.spiedigitallibrary.org/ on 03/12/2014 Terms of Use: http://spiedl.org/terms