Categories and Subject Descriptors. I.4.8 [Image Processing and Computer Vision]: Scene. Analysis. General Terms. Algori
Improved Saliency Detection Based on Superpixel Clustering and Saliency Propagation Zhixiang Ren, Yiqun Hu, Liang-Tien Chia and Deepu Rajan
School of Computer Engineering, Nanyang Technological University, Singapore
{renz0002,yqhu,asltchia,asdrajan}@ntu.edu.sg
ABSTRACT Saliency detection is useful for high level applications such as adaptive compression, image retargeting, object recognition, etc. In this paper, we introduce an effective region-based solution for saliency detection. We first use the adaptive mean shift algorithm to extract superpixels from the input image, then apply Gaussian Mixture Model (GMM) to cluster superpixels based on their color similarity, and finally calculate the saliency value for each cluster using compactness metric together with modified PageRank propagation. This solution is able to represent the image in a perceptually meaningful way and is robust to over-segmentation. It highlights salient regions with full resolution, well-defined boundary. Experimental results show that both the adaptive mean shift and the modified PageRank algorithm contribute substantially to the saliency detection result. In addition, the ROC analysis demonstrates that our approach significantly outperforms five existing popular methods.
Categories and Subject Descriptors I.4.8 [Image Processing and Computer Vision]: Scene Analysis
General Terms Algorithms, Experimentation, Performance
Keywords Saliency detection, Mean shift, Superpixel, Propagation
1.
INTRODUCTION
Visual saliency measures to what extent a region attracts human attention. Automatic saliency detection is useful in several applications such as adaptive compression, image retargeting, object recognition, etc. However, it remains a challenging problem due to the prior knowledge required and the complex visual attention mechanism of humans.
Permission to make digital or hard copies of all or part of this work for personal or classroom use is granted without fee provided that copies are not made or distributed for profit or commercial advantage and that copies bear this notice and the full citation on the first page. To copy otherwise, to republish, to post on servers or to redistribute to lists, requires prior specific permission and/or a fee. MM’10, October 25–29, 2010, Firenze, Italy. Copyright 2010 ACM 978-1-60558-933-6/10/10 ...$10.00.
Some researchers identify salient regions as those with high central-surround contrast in the image. Itti et al. [11] proposed to determine the contrast by the Difference of Gaussians (DoG). Hou and Zhang [10] calculated the contrast on frequency domain based on the difference of the original image and the smoothed image. In general, these contrastbased approaches could detect edges of salient regions but fail to recognize regions as a whole. To acquire homogeneous salient regions, Achanta et al. [1] applied segmentation after contrast-based saliency detection, but their method heavily depended on the segmentation results. Gopalakrishnan et al. [8] detected salient regions by exploring color and orientation distributions of the image. Graph-based methods were also proposed to formulate salient region detection as Markov random walks [9, 7]. In addition, Avraham and Lindenbaum [2] presented a stochastic graphical model to estimate the probability that a region is of interest. These graph-based methods usually generate low resolution saliency maps for computational efficiency. Most of the previous methods represent the input images in pixel-grid manner and scale it down for efficiency during saliency detection [11, 8, 10, 9]. They generate saliency maps with low resolution, poorly-defined boundary. Ren and Malik [12] pointed out that the pixel-grid manner is not a natural representation of visual scenes. It would be more natural to work with perceptually meaningful entities, named superpixels, by grouping pixels. In this paper, we advocate the use of superpixels as the basic units in saliency detection. We first use the adaptive mean shift algorithm to extract superpixels from the input image, then apply GMM to cluster superpixels based on their color similarity, and finally calculate the saliency value for each cluster using compactness metric together with modified PageRank propagation. Fig. 1 shows the overview of the proposed framework for salient region detection. Compared with previous works for saliency detection, three major contributions of our work are listed as follows: (1) Superpixels, the more perceptually meaningful units, are used to represent the input image, which could reduce the effects of outliers in the following clustering process. In contrast to Achanta’s work [1], we segment the image before clustering and saliency calculation, since successive steps may decrease the impact of imprecise segmentation. (2) The adaptive mean shift algorithm is implemented according to the variation of images. For complicated images, the adaptive algorithm could ignore insignificant disturbance, while for images with few changes, it could capture detailed information.
can greatly speed up the subsequent processing steps (especially for GMM) because of relatively few superpixels. The number of Gaussian components is fixed in advance and K-means is used to initialize the GMM model. After that, the Expectation Maximization (EM) algorithm is used to train GMM parameters [3]. Finally, the probability of ith superpixel SPi belonging to the kth cluster is calculated as Figure 1: The framework for saliency detection. (3) A modified PageRank algorithm is applied to refine the saliency estimation, which could alleviate the over-segmentation problem and generate preferable region-based saliency map.
2. 2.1
OUR APPROACH Superpixel Extraction and Clustering
2
σ Rc ), σt2
(1)
where σ 2 is the color variance of the input image, σt2 and Rc are empirical constants representing the threshold of color variance and maximum range radius respectively. In experiments, we fix σt2 to the average color variance of the 1,000 images available from [1]. It should be noted that we adaptively set different values of Rr for different images. For complicated images (those with large color variance), Rr is set to large value so as to capture the main color pattern but ignore insignificant variations. Moreover, we set an upper bound, Rc , of range radius to avoid under-segmentation. For simple images (those with small color variance), Rr is set to small value in order to capture detailed information and avoid objects and background blending together (see Fig. 3(b)). In the experiment section, we will show the effect of adaptive mean shift algorithm. The mean shift process is to segment the image into homogeneous regions. However, the pixels grouped by mean shift are restricted to be connected in spatial domain, e.g. cluttered background can not be grouped together. Furthermore, the number of extracted superpixels is often large, usually in hundreds. We can not solve this over-segmentation problems by simply modifying the parameters of mean shift without blurring the boundary between objects and background. To group similar but discontinuous regions together and alleviate the over-segmentation problem, we introduce GMM to cluster superpixels in color space. The reason why GMM is not directly used to cluster pixels is that GMM is sensitive to the presence of outliers, especially in messy regions (such as grassland, thick tree leaves). In addition, the illumination, reflection or minor distinction of pixels may affect the robustness of GMM. Whereas mean shift algorithms are more robust to handle regions with noise [6], which is more favorable in saliency detection. Although mean shift algorithms are computationally expensive, they
(2)
where πk is the mixing coefficient of the kth Gaussian components whose mean vector is µk and covariance matrix is Σk . We fix K = 8 in later experiments.
2.2
Given an input image, we perform mean shift algorithm [5] in Lab color space to extract superpixels. In mean shift algorithm, there are three parameters: Rs and Rr are the spatial and range radii of the search window respectively, Rm is the minimum point density that a resulting region must have. Similarl to [1], we use fixed parameters of 7, 20 for Rs and Rm respectively. For Rr , we set it according to the color variance of the given image as Rr = min(Rc ,
πk · N (SPi |µk , Σk ) Pk (SPi ) = PK k=1 πk · N (SPi |µk , Σk )
Salient Region Detection
Intuitively, background regions have larger spread in spatial domain compared to salient regions, i.e. the less the clusters are spread, the more salient they will be. Gopalakrishnan [8] proposed compactness metric to evaluate the spread of cluster in the spatial domain. In their method, the cluster compactness is measured based on inter-cluster distances as COM Pk = (
K X
dkj )−1 ,
(3)
j=1
where dkj is the distance between the kth cluster and the j th cluster. They define dkj as P − Cj ||2 · Pk (x) x ||X P dkj = , (4) x Pk (x) where X denotes the spatial coordinates of pixel x, and Cj denotes the spatial center of j th cluster. We adopt the same compactness metric except the probability Pk (x). In our model, if pixel x ∈ SPi , we let Pk (x) = Pk (SPi ) in equation (4). Finally, the saliency of kth cluster is defined as S˜k = COM Pk .
2.3
(5)
Saliency Refinement with Propagation
Even the best segmentation algorithms can not guarantee perfect separation of objects from each other without splitting them into small parts. In many cases, over-segmentation rather than under-segmentation is preferable, since we must avoid more than one objects within one segment. However, the compactness metric is based on the spread of clusters. If one (perceptually meaningful) cluster is over-segmented into many sub-clusters, the compactness may be highly distorted. Therefore, we propose a modified PageRank algorithm to propagate saliency between similar clusters. In web page link analysis, PageRank algorithm is applied to measure the relative importance of a page [4]. The original PageRank equation is as follows: X P R(pj ) 1 P R(pi ) = (1 − λ) + λ (6) N L(pj ) pj ∈M (pi )
where P R(pi ) is called the PageRank of any given page pi . M (pi ) is the set of pages that link to pi , L(pj ) is the number of outbound links on page pj , λ is damping factor and N is the total number of pages. From equation (6), a page linked by many pages with high PageRank receives a high rank itself. In saliency refinement, we treat a cluster as a web page, and assume that a cluster, which is similar to many
other clusters with high saliency, should also receive a high saliency. Under this assumption, we refine cluster saliency by propagating them between clusters based on following pairwise similarity: ( ¡ ||µ −µ ||2 ¢ exp − i2σ2j if i 6= j, µ (7) Aij = 0 otherwise,
AVERAGE RECIEVER−OPERATING CHARACTERISTICS (ROC) CURVE 1
0.9
0.8
TRUE POSITIVE RATIO
0.7
0.6
0.5
0.4
0.3
where µi is the mean color vector of ith cluster, σµ2 is the sum of the variance in each dimension of µ. Similar to the PageRank algorithm, our saliency propagation equation is
0.1
0
K X Si ∗ Aik , Sk = (1 − λ)S˜k + λ PK j=1 Ajk i=1
0
0.1
0.2
0.3
0.4
0.5
0.6
0.7
0.8
0.9
1
FALSE POSITIVE RATIO
(8)
where S˜k is the initial saliency value computed from the compactness of kth cluster (see Section 2.2), and λ is a tradeoff parameter between the initial saliency and the saliency contributed from other clusters (set to 0.5 in experiments). It should be noted that we modify the original PageRank formula in three aspects. (1) Every page is uniformly assigned a prior probability N1 in the PageRank formula, while we assign the initial saliency S˜ as the prior saliency for each cluster. (2) The PageRank algorithm uses binary transition matrix, while we use weighted transition matrix. (3) The transition contribution of one page is normalized by its outbound links in original PageRank, while we normalize the saliency of a cluster by its inbound links. This is because using the outbound normalization will bias toward the clusters which have more similar clusters. We solve equation (8) directly by analytical method. In matrix form, the refined saliency vector S is ˜ S = (1 − λ)(I − λA)−1 S,
SR ITTI GB FT COD OURS
0.2
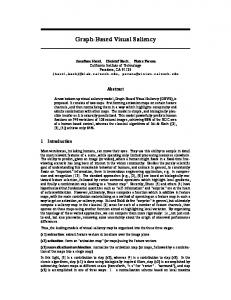
Figure 2: Average ROC curves of all methods on 1000 images with contour ground truths. Table 1 gives the experimental results of different superpixel representation schemes. From this table, we can see that superpixel representation shows much superior performance compared to pixel representation. Comparing the results of mean shift and adaptive mean shift, the latter algorithm is able to handle various levels of image complexity and achieve higher recall.
3.2 Refinement vs. Non-refinement As mentioned in previous sections, propagation could refine saliency values especially in the over-segmentation cases. In this section, we exploit the performance of refinement on different segmentation levels: extreme segmentation using pixels instead of superpixels (PX), severe over-segmentation by setting Rc = 5 (SO), and moderate over-segmentation by setting Rc = 10 (MO).
(9)
where I is the identity matrix, S˜ denotes the initial cluster saliency vector. After the saliency values of clusters are calculated, the saliency of superpixels can be obtained by accumulating contributions from all clusters according to its cluster distribution Pk (SPi ): µX ¶ K Sal(SPi ) = exp Sk Pk (SPi ) . (10)
P R F0.3
Table 2: Refinement Experiments PX N PX Y SO N SO Y MO N MO Y 0.591 0.721 0.781 0.791 0.836 0.840 0.865 0.756 0.736 0.785 0.747 0.790 0.638 0.729 0.771 0.789 0.814 0.828
We conduct three comparison experiments on the database of 1, 000 images with accurate object-contour based ground truth, which is available from [1]. Similar to [1, 7], we use (P )recision, (R)ecall, F0.3 metrics to evaluate the performance of saliency map.
Table 2 shows the experimental results, where the suffix “Y/N” denotes whether the refinement is adopted. From this table, refinement by modified PageRank propagation achieves better performances in all segmentation levels than those without refinement. Comparing the improvements of different segmentation levels (improvement of 9.1, 1.8, 1.4 points in F0.3 ), we can see that the more severe the over-segmentation is, the more improvement the propagation could gain. This observation is reasonable because the modified PageRank algorithm could propagate saliency between regions with similar colors, thus alleviating the deficiency of over-segmentation.
3.1
3.3 Comparison with Existing Methods
k=1
3.
EXPERIMENTS
Mean Shift vs. Adaptive Mean Shift
We compare the performance of different superpixel representation schemes: pixel (PX), superpixel extracted by mean shift (MS), and superpixel extracted by adaptive mean shift (AMS). For all these experiments, we fix Rc = 10 and use the same propagation method. Table 1: Superpixel Experiments PX MS AMS P 0.721 0.838 0.840 R 0.756 0.769 0.790 F0.3 0.729 0.821 0.828
We also compare our method with previous methods including Itti’s method (ITTI) [11], Spectral Residual method (SR) [10], Graph-based saliency method (GB) [9], Frequencytuned method (FT) [1] and the salient region detection method based on color and orientation distributions (COD) [8]. Note that only the same color feature is used for all methods except for Itti’s method. Fig. 2 gives the average ROC curves of all methods. Compared to other methods, the area under our ROC curve is much larger than the others, which indicates the salient regions detected by our method show a better consistency with the human-labeled ground truth.
Figure 3: Comparing saliency maps generated from different methods. The first row from left to right: the input images, SR method [10], GB method [9], COD method [8]. The second row: the ground truth, Itti’s method [11], FT method [1], our method. To obtain a visual comparison among the above approaches, we show some examples in Fig. 3. Unlike other methods, our saliency maps highlight salient regions with well-defined boundaries and full resolution. It is worth noting that, despite applying the same GMM model and compactness metric, the COD method generates saliency maps with rather poor quality in contrast with ours, which in some extent proves the effectiveness of the adaptive mean shift and propagation. Furthermore, our method outperforms other methods especially for complicated images (such as Fig. 3(a)) or images with texture background (such as Fig. 3(d) and (e)).
4.
[2]
[3] [4] [5]
CONCLUSIONS
This paper proposes a promising saliency detection approach which can generate accurate saliency maps with full resolution and well-defined boundary. To avoid interference from insignificant pixels, our method exploits adaptive mean shift algorithm to extract natural and meaningful superpixels. We also refine the saliency values by the modified PageRank algorithm for propagation between similar clusters. Experiments show that these two strategies can improve the saliency detection. Furthermore, our method significantly outperforms the existing methods on an accurate object-contour based database. In our future work, we will further investigate the application of superpixel representation in visual attention mechanism and seek more useful information for saliency detection.
Acknowledgments This research was supported by the Media Development Authority under grant NRF2008IDM-IDM004-032.
[6]
[7]
[8]
[9] [10] [11] [12]
5.
REFERENCES
[1] R. Achanta, S. H. F. Estrada, and S. Susstrunk.
Frequency-tuned salient region detection. In Proceedings of the IEEE Conference on Computer Vision and Pattern Recognition, June 2009. T. Avraham and M. Lindenbaum. Esaliency (extended saliency): Meaningful attention using stochastic image modeling. IEEE Transactions on Pattern Analysis and Machine Intelligence, 32:693–708, April 2010. C. M. Bishop. Pattern Recognition and Machine Learning. Springer, 1 edition, 2007. S. Brin and L. Page. The anatomy of a large-scale hypertextual web search engine. In Seventh International World-Wide Web Conference, April 1998. C. M. Christoudias, B. Georgescu, and P. Meer. Synergism in low level vision. In In International Conference on Pattern Recognition, August 2002. D. Comaniciu and P. Meer. Mean shift: A robust approach toward feature space analysis. IEEE Transactions on Pattern Analysis and Machine Intelligence, 24:603–619, 2002. V. Gopalakrishnan, Y. Hu, and D. Rajan. Random walks on graphs to model saliency in images. In Proceedings of the IEEE Conference on Computer Vision and Pattern Recognition, June 2009. V. Gopalakrishnan, Y. Hu, and D. Rajan. Salient region detection by modeling distributions of color and orientation. IEEE Transaction on Multimedia, 11(5):892–905, August 2009. J. Harel, C. Koch, and P. Perona. Graph-based visual saliency. In Advances in Neural Information Processing Systems 19, December 2007. X. Hou and L. Zhang. Saliency detection: A spectral residual approach. In Proceedings of the IEEE Conference on Computer Vision and Pattern Recognition, June 2007. L. Itti, C. Koch, and E. Niebur. A model of saliency-based visual attention for rapid scene analysis. IEEE Transactions on Pattern Analysis and Machine Intelligence, 20(11). X. Ren and J. Malik. Learning a classification model for segmentation. In Proceedings of the International Conference on Computer Vision, October 2003.