Dec 26, 2000 - The City College of New York, NY, 10031, USA. {swang15, ytian}@ccny.cuny.edu. Abstract. Object detection plays a very important role in ...
Indoor Signage Detection Based on Saliency Map and Bipartite Graph Matching Shuihua Wang and Yingli Tian Department of Electrical Engineering, The City College of New York, NY, 10031, USA {swang15, ytian}@ccny.cuny.edu Abstract Object detection plays a very important role in many applications such as image retrieval, surveillance, robot navigation, wayfinding, etc. In this paper, we propose a novel approach to detect indoor signage to help blind people find their destinations in unfamiliar environments. Our method first extracts the attended areas by using a saliency map. Then the signage is detected in the attended areas by using bipartite graph matching. The proposed method can handle multiple signage detection. Experimental results on our collected indoor signage dataset demonstrate the effectiveness and efficiency of our proposed method. Furthermore, saliency maps could eliminate the interference information and improve the accuracy of the detection results.
1
Introduction
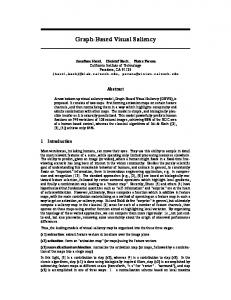
Based on the study of the World Health Organization (WHO), there were about 161 million visually impaired people around the world in 2002, about 2.6% of the total population. Among these statistics, 124 million had low vision and 37 million were blind [17]. Robust and efficient indoor object detection can help people with severe vision impairment to independently access unfamiliar indoor environments and avoid dangers [18]. Context information (including signage and other visual information) plays an important role in navigation and wayfinding for unsighted persons. As shown in Figure 1, signage is particularly important for discriminating between similar objects in indoor environments such as elevators, bathrooms, exits, and office doors. Object detection is a computer technology related to computer vision and image processing that deals with detecting instances of a priori objects of a certain class (such as faces, signs, buildings, etc) in digital images and videos captured by cameras [1]. Camera-based indoor signage detection is a challenging problem due to the following factors: 1) large variations of appearance and design (shape, color, texture, etc.) of signage in different buildings; and 2) large variations in the camera view and image resolution of signage due to changes in position and distance between the blind user with wearable cameras and the targeted signage.
(a)
(b)
(c)
(d)
Figure 1: Typical indoor signage: (a) a bathroom, (b) an exit, (c) a laboratory, (4) an elevator.
Object detection and recognition is a fundamental component for scene understanding. The human visual system is powerful, selective, robust, and fast [20]. It is not only very selective, which allows us to distinguish among very similar objects, such as the faces of identical twins, but also robust enough to classify same category objects with large variances (e.g. changes of position, scale, rotation, illumination, color, occlusion and many other properties). Research shows that the human visual system can discriminate among at least tens of thousands of different object categories [19]. Object recognition processes in the human visual system are also very fast: it can take as little as 100 to 200 ms [21-23]. However, it is extremely difficult to build robust and selective computer vision algorithms for object recognition which can handle very similar objects or objects with large variations. For example, state-of-the-art object detection methods require hundreds or thousands of training examples and very long durations to learn visual models of one object category [24-26]. Many disability and assistive technologies have been developed to assist people who are blind or visually impaired. The vOICe vision technology for the totally blind offers sophisticated image-to-sound renderings by using a live camera [27]. The Smith-Kettlewell Eye Research Institute developed a series of camera phone-based technological tools and methods for the understanding, assessment, and rehabilitation of blindness and visual impairment [28-32], such as text detection [32], crosswatch [29, 31], and wayfinding [30]. To help the visually impaired, Zandifar et al. [33] used one head-mounted camera together with existing OCR
techniques to detect and recognize text in the environment and then convert the text to speech. Everingham et al. [34] developed a wearable mobility aid for people with low vision using scene classification in a Markov random field model framework. They segmented an outdoor scene based on color information and then classified the regions of sky, road, buildings etc. Shoval et al. [35] discussed the use of mobile robotics technology in the GuideCane device, a wheeled device pushed ahead of the user via an attached cane for the blind to avoid obstacles. When the GuideCane detects an obstacle it steers around it. The user immediately feels this steering action and can follow the GuideCane's new path. Pradeep et al. [36] describes a stereo-vision based algorithm that estimates the underlying planar geometry of the 3D scene to generate hypotheses for the presence of steps. Although many efforts have been made, how to apply this vision technology to help blind people understand their surroundings is still an open question. Scholars tend to combine the window-sliding technique with the classifier to detect regions of an image at all locations and scales that contain the given objects. However, the window sliding method suffers from two shortcomings [3]: 1) high processing time; and 2) inaccuracy of detection results due to different background. Therefore, we propose a new method to detect indoor signage which first employs the saliency map [4-5] to extract attended areas and then applies bipartite graphic matching [6-8] to recognize indoor signage only at the attended areas instead of the whole image, which can increase the accuracy and reduce the computation cost. Detection of indoor signage can help blind people to find their destinations in unfamiliar environments. In this paper, we propose a new method to detect indoor signage by combining saliency map based attended area extraction and bipartite graph matching based signage recognition. The paper is organized as following: Section 2 describes the methodology of our proposed algorithm, including 1) calculating the saliency map to detect attended area, and 2) the bipartite graph matching for pattern recognition. Section 3 displays our experimental results and demonstrates the effectiveness and efficiency of the proposed algorithm. Section 4 concludes the paper.
2
Figure 2. Flow chart of the proposed algorithm
Build Saliency Maps
Saliency maps are used to represent the conspicuity at every location in the visual field by a scalar quantity and
Figure 3. Architecture of building saliency maps
Method of Indoor Signage Detection
Our method consists of two phases as shown in Figure 2. In the first phase, attended areas are detected via saliency map based on color, intensity, and orientation. Then, the scaled patterns are detected within attended areas using bipartite graph matching. To localize the patterns, a window sliding method is employed to search the attended areas.
2.1
to guide the selection of attended locations based on the spatial distribution of saliency [9]. In analogy to the center-surround representations of elementary visual features, bottom-up saliency is thus determined by how different a stimulus is from its surround, in many sub-modalities and at many scales [10]. Saliency at a given location is determined primarily by how different this location is from its surroundings in color, orientation, motion, depth, etc.
As shown in Figure 3, the different visual features that contribute to attentive selection of a stimulus (color, intensity, and orientation) are combined into one saliency map. The saliency map which integrates the normalized information from the individual feature maps into one global measure of conspicuity. The detailed procedures are discussed in following sections. 2.1.1
Initialization
We first resize the input color images at 640 × 480 resolution. Then, for each image, nine spatial scales are
created using dyadic Gaussian pyramids, which progressively low-pass filter and sub-sample the input image, yielding horizontal and vertical image-reduction factors ranging from 1:1 to 1:256 in eight octaves. We compute saliency maps based on intensity, color, and orientation for each pixel by linear ‘center-surrounded’ operations similar to visual receptive fields. Center-surround feature extraction is implemented in the function of the difference between fine and coarser scales; the center is a pixel at the scales c {2,3, 4} , and the surround is a pixel at scale s=c+δ, with δ {3, 4} . The across-scale difference between two maps is gained by interpolation to the finer scale and point-by-point subtraction. Using several scales for both c and δ = s-c yield truly multi-scale feature extraction, by including different size ratios between the centers and surround regions. 2.1.2
Intensity-based Saliency Map
With r, g, and b being the red, green, and blue channels of the input image, respectively, an intensity image I is achieved as I = (r+g+b)/3. Here I is used to create a Gaussian pyramid I(σ), where {0,1, 2,...8} denotes the scale. The r, g, and b channels are normalized by I in order to decouple hue from intensity. However, the hue variation are not perceivable at very low luminance (and hence are not salient), so normalization is only applied at the locations where I is larger than 10% of its maximum over the entire image and other locations yield zero. Four broadly-tuned color channels are created: R = r-(g+b)/2 for red, G = g-(r+b)/2 for green. B = b-(r+g)/2 for blue, and Y = (r+g)/2-|r-g|/2-b for yellow, and negative values are set to zero for the R, G, B and Y values gained from above equations, 4 Gaussian pyramids R( ) , G ( ) , B( ) , and Y ( ) are created from these color channels. Center-surround differences between a ‘center’ fine scale c and a ‘surround’ coarser scale s yield the feature maps. The first group of feature maps is concerned with intensity contrast, which is detected by neurons sensitive either to dark centers on bright surrounds or to bright centers on dark surrounds. In this paper, both types of sensitivities are simultaneously computed by using a rectification in six maps I(c,s). I (c, s ) | I (c) I ( s ) | (1)
2.1.3 Color-based Saliency Map The second group of saliency maps is similarly built for the color channels, which in cortex are represented by a so-called “color double-opponent” system: in the center of their receptive fields, neurons are excited by one color such as red and inhibited by another such as green, while the converse is true in the surround [11]. Such spatial and chromatic opponency exists for the red/green, green/red, blue/yellow, and yellow/blue color pairs in human
primary visual cortex. Accordingly, maps RG(c,s) are created in the function to simultaneously account for red/green and green/red double opponency (2) and BY(c,s) for blue/yellow and yellow/blue double opponency (3). RG (c, s ) | ( R(c) G (c)) ! (G ( s ) R ( s )) | (2) BY (c, s ) | ( B (c) Y (c)) ! (Y ( s ) B( s )) | (3) 2.1.4
Orientation-based Saliency Map
Local orientation information is gained from I by oriented Gabor pyramids O(σ, θ) where σ [0, 1, …, 8] represents the scale and {0 , 45 ,90 ,135 } stands for the preferred orientation. Gabor filters are the product of a cosine grating and a 2D Gaussian envelope, approximating the receptive field sensitivity profile of orientation-selective neurons in primary visual cortex. Orientation feature maps O(s, c, θ) encode local orientation contrast between the center and surround scales. O (c, s, ) | O (c, ) O( s, ) | (4) In total, 42 feature maps are created: 6 from intensity, 12 from color, and 24 from orientation. 2.1.5
Combination of Saliency Maps
The difficulty in combining different maps is that they represent a priori not comparable modalities, with different dynamic ranges and extraction mechanisms [12]. Furthermore, because all 42 maps are combined, salient objects which are strong in only a few maps may be masked by noise or by less-salient objects present in a larger number of maps. Because of the absence of top-down supervision, a map normalization operator N (.) is proposed, which globally promotes maps in which a small number of strong peaks of activity is present, meanwhile globally suppressing maps which contain numerous comparable peak responses. N (.) consists of: (1) Normalizing the values range in the map to a fixed range [0, …, M], in order to eliminate modality dependent amplitude differences; (2) Finding the location of the map’s global maximum M and computing the average m of all its other local maxima; (3) Globally multiplying the map by ( M m) 2 . Only local maxima activities are considered, such that N (.) compares responses associated with meaningful ‘active spots’ in the map and ignores homogeneous areas. Comparing the maximum activity in the whole map to the average overall activity measures the difference between the most active location and the average. If the difference is large, the most active location stands out, and the map is strongly promoted. Otherwise, the map contains nothing unique and is suppressed.
Feature maps are combined into three “conspicuity maps”, I for intensity (5), C for color (6), and O for orientation (7), at the scale 4 of the saliency map. They are gained by across-scale addition which consists of reduction of each map to scale four and point-by-point addition. 4
I
c4
N ( I (c, s))
(5)
c 2 s c 3
4
(6)
c 2 s c 3
For orientation, 4 intermediary maps are created by combining the six maps for a given and then are combined into a single orientation conspicuity map:
4
c4
N ( I (c, s))
(7)
{0 ,45 ,90 ,135 } c 2 s c 3
The motivation of the creation of three separate channels ( I , C , and O ) is based on the hypothesis that similar features compete strongly for saliency, meanwhile different modalities contribute separately to the saliency map. The three conspicuity maps are normalized and grouped into the final input S to the saliency map. 1 S N ( I ) N (C ) N (O) (8) 3 From above equations, we get the most salient image locations based on the maximum of the saliency map. We can simply detect the attended areas as the connected points by comparing the value of the saliency map and a threshold.
2.2 2.2.1
Bipartite Graph Matching Based Indoor Signage Detection Detecting Signage in Attended Areas
(a) (b)
2.2.2
Bipartite Graph Matching
c4
C N (RG(c, s )) N ( BY (c, s ))]
O
suppression is applied to the output to remove multiple detections of the same object. In order to improve the efficiency, our method scans the attended areas as the shaded circle in Figure (b). Our method reduces the scan areas, which helps to reduce the sliding window algorithm’s processing time.
To detect indoor signage, we employ the “Bipartite Graph Matching (BGM)” algorithm to compare the query patterns and the slide-windows at the attended areas. The detailed procedures of the BGM algorithm can be found at papers [15-16]. Suppose A denotes the window and B denotes the sub-image covered by window A. The BGM algorithm first calculate the edges of the window and the sub-image, followed by evaluating the degree of the match as
BGM ( A, B)
(9) N Where ω denotes the sum of the pixels that exist in the edge images of both A and B, and N denotes the size of the window. Larger values of function (9) correspond to a better match, therefore, the BGM algorithm scans the image and finds the location with the largest matching score: (10) B* arg max BGM ( A, B ) The maximization can be solved by a gradient-based optimization technique. However, the function (10) is non-convex and multi-modal, so the gradient-based optimization technique is easy to mislead in local extreme. In this paper, an exhaustive searching method is employed to find the global maxima.
2.3
Figure 4. Applying window sliding method in attended areas improves computation efficiency: (a) Traditional (b) Our approach.
Figure 4 shows the concept of the window sliding method [13], which is a popular technique for identifying and localizing objects in an image. The traditional approach involves scanning the whole image as the shaded area in Figure 4(a) with a fixed-size rectangular window and applying a classifier to the sub-image defined by the window. The classifier extracts image features within the window and returns the probability that the window bounds a particular object. The process is repeated on different scales so that objects can be detected at any size [14]. Usually non-maximal neighborhood
Generalization to Multi-pattern Detection
Our method can handle both single signage and multiple signage detection. The pseudo-codes of multi-pattern detection are listed below, which is based on multi runs of aforementioned single pattern detection described above. Here, I denotes original image; Pi denotes ith pattern; S denotes the saliency map; BGM denotes the value of bipartite graph matching; Li denotes the location found by ith pattern. Step 1 Step 2 Step 3
Initialization. Input I, P1, P2, … PN; S=GetSaliencyMap(I); for i=1: N [BGMi, Li]=SinglePatternDetection(I, S, Pi); end
Step 4 Step 5
i*=argmax {BGM i } ; Output i* and Li*.
3
Experiments and Discussion
The experiments are carried on the Windows XP
operation system with 2GB Hz processor and 1GB memory. We also developed an in-house GUI as a friendly interface between human and computers. The GUI can run on any computer with Matlab.
3.1
Single Pattern Detection
Independent travel is well known to present significant challenges for individuals with severe vision impairment, thereby reducing quality of life and compromising safety. Based on our survey with blind users, detection of indoor signage such as elevator buttons and restrooms has high priority. Therefore, our experiments focus on the detection of signage. Figure 5 displays detection of elevator buttons. The camera-captured image of six different elevator buttons is shown in Figure 5(a). Figure 5(b) is the corresponding saliency map extracted from the original image by using intensity, color, and orientation. The bright pixels indicate the attended areas. Figure 5(c) and Figure 5(e) show the query symbols of “open” and “close” buttons which are recorded in the query database of indoor signage. Figure 5(d) and Figure 5(f) demonstrate the final detection results (the red rectangular boxes). Similarly, the detection of restroom signage is displayed in Figure 6 as (a) shows the original image including the signage of both “Women’s” and “Men’s” restrooms; (b) shows the saliency map of the original image where the bright regions indicate the attended areas; (c) and (e) are the query patterns; (d) and (f) are the final detection signage results of the “Men’s” and “Women’s” restroom.
Figure 6. Restroom signage detection: (a) Original image; (b) Saliency map; (c) Query pattern of “Men’s” signage; (d) Detected “Men’s” signage; (e) Query pattern of “Women’s” signage; and (f) Detected ‘Women’s” signage.
Figure 7. Multi-pattern detection results. First row: Multiple query patterns; Second row: Original image, Saliency map, and the detected result of pattern 2 (signage of Men’s restroom); Third row: Original image, Saliency map, and the detected result of pattern 1 (signage of Women’s restroom).
Figure 5. Elevator button detection: (a) Original image; (b) Saliency map; (c) Query pattern of “Open” symbol; (d) Detected “Open” symbol; (e) Query pattern of “Close” symbol; and (f) Detected “Close” symbol.
3.2 Multi-Pattern Detection We further extend our algorithm to detect multiple patterns. In this case, the blind user will give multiple query patterns. As shown in Figure 7 (first row), the query patterns include both “Men’s” and “Women’s” restroom. We need to detect the patterns as well as recognize which pattern is found. The original image, corresponding saliency map, and the detected signage are shown in (the
second row) for a “Men’s” and a “Women’s” restroom (the third row) respectively. We further evaluate the multi-pattern method to detect the four emergency exit signage of up, down, left, and right directions. The detection results are demonstrated in Figure 8.
signage (20 women and 20 men). In this experiment, 14 “Women’s” signs, 16 ‘Men’s’ signs, 18 “Up” directions, 16 “Down” directions, 15 “left” directions and 19” right” directions are correctly detected from the original image. As shown in Table 2, the multi-patterns detection has a lower successful rate than those of single pattern detection. Normal
(a)
Low resolution
Special angle
Men’s
Wome n’s
(b) Eleva -tor Button s
(c) Up
(d)
Down
Left
(e) Figure 8. Emergency exit signage detection: (a) Query patterns of direction symbols; (b) original image, saliency map, and detection result of the “Down” symbol; (c) original image, saliency map, and detection result of the “Right” symbol; (d) original image, saliency map, and detection result of the “Left” symbol; and (e) original image, saliency map, and detection result of the “Up” symbol.
Right
Figure 9. Example images of our indoor signage dataset.
Table 1. Accuracy of single pattern detection
3.3
Experimental Results
Our proposed method is evaluated by a database of 162 indoor signage images with 8 different types of signage including restrooms (Men’s and Women’s), elevator buttons (Open and Close), and exit directions (left, right, up, and down). Some examples are shown in Figure 9 which contains variations in lighting, resolution, and camera angle. In single-pattern detection, we use 40 restroom sign images (20 women’s and 20 men’s) and 40 elevator button images (20 close and 20 open). We correctly detected 18 “Women’s” signs, 16 ‘Men’s’ signs, 17 “Close” signs, and 17” open” signs as shown in Table 1. In multi-pattern detection, we use 82 direction signage (20 up, 20 down, 20 left, and 22 right) and 40 restroom
Women Men Close Open Average
Total number 20 20 20 20 80
Success number 18 16 17 17 68
Success rate(%) 90 80 85 85 85
Table 2. Accuracy of multi patterns detection
Women Men Up Down Right Left Average
Total number
Success Number
20 20 20 20 22 20 122
14 16 18 16 19 15 98
Fail(to other types) 2 1 0 2 1 2 8
Success rate (%) 70 80 90 80 86.3 75 80.3
The wrong signage detections fall into the following two categories. 1) When we build the saliency map, the query pattern will be ignored because of low resolution of the original images. 2) The bipartite graph matching method is sensitive to the resolution, perspective projection, and angle of the camera views. It is difficult to distinguish different types of signage and the success rate of the detection decreases if the image resolution is too low or captured with an extreme camera view. As shown in Figure 10, the “close” signage is not detected as attended area in the saliency map due to the low image resolution. Figure 11 demonstrates that “Men” signage is correctly detected by the saliency map, but is missed by the bipartite graph matching method.
57.5% (without using saliency maps) to 75% (with saliency maps). Saliency map can effectively eliminate disturbing information which would decrease the accuracy of the bipartite graph matching method.
3.5
Computation Cost Reduction
We further evaluate the computation time of the proposed method by comparing it to the traditional method of sliding window. The computation time for indoor signage detection and recognition is listed in Table 4. Our proposed method reduces computational cost by about 20% compared to the traditional method. This ensures real-time processing for developing navigation and wayfinding systems to help blind users. Table 4. Computation Time Comparison (s) Experiment Traditional Our’s Ratio Button Detection (Open) 0.3247 0.2727 84.00% Button Detection (Close) 0.3194 0.2760 86.40% “Men” signage 0.4119 0.3472 78.46% “Women” signage 0.2711 0.2319 85.55%
(a)
4
(b)
Figure 10. “Open” button of elevator: (a) Original image; (b) Saliency map
(a)
(b)
(c)
Figure 11. “Men” restroom: (a) Original image; (b) Saliency map; (c) Detection result
Table 3. Effectiveness of Saliency Map for Indoor Signage Detection Men Women Total Accuracy
3.4
Total 20 20 40
BGM only 11 12 23 57.5%
SM and BGM 14 16 30 75%
In this paper, we have proposed a novel object detection method for indoor signage recognition. The approach employs both saliency maps and bipartite graph matching. The system’s ability to recognize elevator buttons and restroom signage demonstrates the effectiveness and efficiency of the proposed method. Our future work will focus on extending our object detection method to handle larger changes of perspective projection, scale, point view, etc. We will also develop a prototype system of indoor signage detection and address the significant human interface issues associated with way finding for blind users.
Acknowledgement This work was supported by NSF grant IIS-0957016, EFRI-1137172, and NIH 1R21EY020990.
References [1]
Effectiveness of Saliency Map
To evaluate the effectiveness of a saliency map for the indoor signage detection, we compare the detection results with and without using saliency map detection by using the “Women’s” and “Men’s” restroom signage. As shown in Table 3, only 11“Men’s” and 12 “Women’s” restroom signs are correctly detected by applying bipartite graph matching on the image without performing saliency map based attended area detection. However, with saliency maps, we correctly detected 14 “Men’s” and 16 “Women” restroom signs. The accuracy is increased from
Conclusions
[2]
[3]
[4]
A. Neves, A. Pinho, D. Martins, and B. Cunha, "An efficient omnidirectional vision system for soccer robots: From calibration to object detection," Mechatronics, March 2011. Vol. 21, No. 2, pp. 399-410. Y. Wang, W. Lin, and S. Horng, "A sliding window technique for efficient license plate localization based on discrete wavelet transform," Expert Systems with Applications, April 2011, Vol. 38, No. 4, pp. 3142-3146. W. Tsao, A. Lee, Y. Liu, T.-W. Chang, and H. -H. Lin, "A data mining approach to face detection," Pattern Recognition, March 2010, Vol. 43, No. 3, pp. 1039-1049. S. Leyk, R. Boesch, and R. Weibel, "Saliency and semantic processing: Extracting forest cover from
[5]
[6]
[7]
[8]
[9]
[10]
[11]
[12]
[13]
[14]
[15]
[16]
[17]
[18] [19
[20]
[21]
historical topographic maps," Pattern Recognition, May 2006, Vol. 39, No. 5, pp. 953-968. H. Shi, and Y. Yang, "A computational model of visual attention based on saliency maps," Applied Mathematics and Computation, May 2007, Vol. 188, No. 2, pp. 1671-1677. K. Makino, T. Takabatake, and S. Fujishige, "A simple matching algorithm for regular bipartite graphs," Information Processing Letters, Novermber 2002, Vol. 84, No. 4, pp. 189-193. K. Riesen, and H. Bunke, "Approximate graph edit distance computation by means of bipartite graph matching," Image and Vision Computing, June 2009. Vol. 27, No. 7, pp. 950-959. Y. D. Zhang, and L. N. Wu, "Pattern recognition via PCNN and Tsallis entropy," Sensors, 2008. Vol. 8, No. 11, pp. 7518-7529. C. Davies, W. Tompkinson, N. Donnelly, L. Gordon, and K. Cave, "Visual saliency as an aid to updating digital maps," Computers in Human Behavior, July 2006. Vol. 22, No. 4, pp. 672-684. S. J. Park, K. H. An, and M. Lee, "Saliency map model with adaptive masking based on independent component analysis," Neurocomputing, December2002, Vol. 49, No. 1-4, pp. 417-422. A, Shokoufandeh, I. Marsic, and S. J. Dickinson, "View-based object recognition using saliency maps," Image and Vision Computing, April 1999. Vol. 17, No. 5-6, pp. 445-460. C. Kayser, C. I. Petkov, M. Lippert, and N. K. Logothetis, "Mechanisms for Allocating Auditory Attention: An Auditory Saliency Map," Current Biology, 8. Novemember 2005, Vol. 15, No. 21, pp. 1943-1947. F. Davignon, J. F. Deprez, and O. Basset, "A parametric imaging approach for the segmentation of ultrasound data," Ultrasonics, December 2005, Vol. 43, No. 10, pp. 789-801. A. Noureldin, A. El-Shafie, and M. R Taha, "Optimizing neuro-fuzzy modules for data fusion of vehicular navigation systems using temporal cross-validation," Engineering Applications of Artificial Intelligence, February 2007. Vol. 20, No. 1, pp. 49-61. C. R. Pranesachar, "A class of matching-equivalent' bipartite graphs," Discrete Mathematics, May 1999. Vol. 203, No. 1-3, pp. 207-213. N. Kakimura, "Matching structure of symmetric bipartite graphs and a generalization of Pólya's problem," Journal of Combinatorial Theory, Series B, Novemember 2010, Vol. 100, No. 6, pp. 650-670. I. Kocur, R. Parajasegaram, and G. Pokharel, Global Data on Visual Impairment in the Year 2002. Bulletin of the World Health Organization, 82, pp.844-851, 2004. A. Baker, Blind Man is Found Dead in Elevator Shaft, The New York Times, City Room, May 2010. Biederman, I. 1987, “Recognition-by-Components: A Theory of Human Image Understanding,” Psychological Rev., vol. 94, pp. 115-147, 1987. G. Kreiman, 2008, “Biological object recognition,” Scholarpedia, 3(6):2667. http://www.scholarpedia.org /article /Biological_object_recognition. M. Potter and E. Levy, Recognition memory for a rapid sequence of pictures. Journal of Experimental
[22]
[23]
[24]
[25]
[26]
[27] [28]
[29]
[30]
[31]
[32]
[33]
[34]
[35]
[36]
Psychology, 1969. 81: 10-15. S. Thorpe, D. Fize, and C. Marlot, Speed of processing in the human visual system. Nature, 1996. 381: 520-522. C. Hung, G. Kreiman, T. Poggio, and J. DiCarlo, Fast Read-out of Object Identity from Macaque Inferior Temporal Cortex. Science, 2005. 310: 863-866. H. Schneiderman and T. Kanade. A statistical approach to 3d object detection applied to faces and cars. In IEEE Conference on Computer Vision and Pattern Recognition (CVPR’00), 2000. P. Viola and M. Jones. Rapid object detection using a boosted cascade of simple features. In IEEE Conference on Computer Vision and Pattern Recognition (CVPR’01), 2001. M. Weber, M. Welling, and P. Perona, “Unsupervised Learning of Models for Recognition,” Proc. European Conf. Computer Vision, vol. 2, pp. 101-108, 2000. Seeing with Sound – The vOICe, http://www.seeingwithsound.com/ The Smith-Kettlewell Rehabilitation Engineering Research Center (RERC) develops new technology and methods for understanding, assessment and rehabilitation of blindness and visual impairment. http://www.ski.org/Rehab/ V. Ivanchenko, J. Coughlan and H. Shen. "Crosswatch: a Camera Phone System for Orienting Visually Impaired Pedestrians at Traffic Intersections." 11th International Conference on Computers Helping People with Special Needs (ICCHP '08). 2008. R. Manduchi, J. Coughlan and V. Ivanchenko. "Search Strategies of Visually Impaired Persons using a Camera Phone Wayfinding System." 11th International Conference on Computers Helping People with Special Needs (ICCHP '08). 2008 V. Ivanchenko, J. Coughlan and H. Shen. "Detecting and Locating Crosswalks using a Camera Phone." Fourth IEEE Workshop on Embedded Computer Vision, in conjunction with Computer Vision and Pattern Recognition (CVPR ‘08). 2008 H. Shen and J. Coughlan. "Grouping Using Factor Graphs: an Approach for Finding Text with a Camera Phone." Workshop on Graph-based Representations in Pattern Recognition, 2007. A. Zandifar, R. Duraiswami, A. Chahine, L. Davis, “A video based interface to textual information for the visually impaired”. In: Proc. IEEE 4th international conference on multimodal interfaces, 2002. M. Everingham, B. Thomas, and T. Troscianko, “Wearable Mobility Aid for Low Vision Using Scene Classification in a Markov Random Field Model Framework,” International Journal of Human Computer Interaction, Volume 15, Issue 2, 2003 S. Shoval, I. Ulrich, and J. Borenstein, “Computerized Obstacle Avoidance Systems for the Blind and Visually Impaired.” Invited chapter in "Intelligent Systems and Technologies in Rehabilitation Engineering.” Editors: Teodorescu, H.N.L. and Jain, L.C., CRC Press, ISBN/ISSN: 0849301408, Publication Date: 12/26/00, pp. 414-448. V. Pradeep, G. Medioni, and J. Weiland, Piecewise Planar Modeling for Step Detection using Stereo Vision, Workshop on Computer Vision Applications for the Visually Impaired, 2008