April 3, 2008
16:3
WSPC/Trim Size: 11in x 8.5in for Proceedings
XNCSB08
1
Improved SAR Models - Exploiting the Target-Ligand Relationships
Xia Ning ∗ , Huzefa Rangwala † and George Karypis‡
Abstract Small organic molecules, by binding to different proteins, can be used to modulate (inhibit/activate) their functions for therapeutic purposes and to elucidate the molecular mechanisms underlying biological processes. Over the decades structure-activity-relationship (SAR) models have been developed to quantify the bioactivity relationship of a chemical compound interacting with a target protein, with advances focussing on the chemical compound representation and the statistical learning methods. We have developed approaches to improve the performance of SAR models using compound activity information from different targets. The methods developed in the study aim to determine the candidacy of a target to help another target in improving the performance of its SAR model by providing supplemental activity information. Having identified a helping target we also develop methods to identify a subset of compounds that would result in improving the sensitivity of the SAR model. Identification of helping targets as well as helping compounds is performed using various nearest neighbor approaches using similarity measures derived from the targets as well as active compounds. We also developed methods that involve use of cross-training a series of SVM-based models for identifying the helping set of targets. Our experimental results show that our methods show statistically significant results and incorporate the target-ligand activity relationship well. Keywords: SAR model, supervised machine learning, target-ligand relationship
1. Introduction The pioneering work of Hansch et al. 1, 2 which demonstrated that the biological activity of a chemical compound can be mathematically expressed as a function of its physicochemical properties, led to the development of quantitative methods for modeling structureactivity relationships (SAR). Since that work, many ∗
[email protected],
different approaches have been developed for building such structure-activity-relationship (SAR) models. These models have become an essential tool for predicting biological activity from the structural properties of a molecule. In particular, these models quantify the activity of the small molecule directed against a particular protein, called a target. Many of these methods represent the chemical compounds using various descriptors and then apply statistical and machine learning approaches to learn the SAR models. Over the years, the approaches that have been employed to learn the SAR models have evolved from the initial regression-based techniques used by Hansch et al, to approaches that utilize more complex statistical model estimation procedures. These procedures include partial least squares 3 , linear discriminant analysis 4 , Bayesian models 5 , and approaches that employ various machinelearning/pattern recognition methods such as recursive partitioning 6–8 , neural networks 9–12 , and support vector machines (SVM)13–15 . A similar evolution has occurred on the descriptors that have been developed and used to represent the compounds. These descriptors range from physicochemical property descriptors 16–18 , to topological descriptors derived from the compound’s molecular graph 19–24, 14, 25, 15, 26, 27 , to 2D and 3D pharmacophore descriptors that capture interactions which are critical to protein-ligand binding 28–32 . Traditional SAR models quantify the relationship between a single protein target and a certain set of active chemical compounds. Such models suffer from a drawback that they only learn the information from a limited set of compounds, without any consideration of other related protein targets or related compounds, thus these models might not be able to discover novel active compounds. Earlier work 33 hypothesized the SARAH framework, by which protein targets could be classified within the same group if they showed similar activity with a common set of compounds. Conceptually, the
Dept. of Computer Science and Engineering, University of Minnesota, Minneapolis, 55414 Dept. of Computer Science and Engineering, University of Minnesota, Minneapolis, 55414 ‡
[email protected], Dept. of Computer Science and Engineering, University of Minnesota, Minneapolis, 55414 †
[email protected],
April 3, 2008
16:3
WSPC/Trim Size: 11in x 8.5in for Proceedings
XNCSB08
2
SARAH framework allows us to identify pairs of assays that would benefit by integration while building their respective SAR models. In this paper, we propose a novel framework to build improved SAR models by incorporating activity information from other targets. We develop a set of methods which are effective in identifying protein targets and selecting compounds that can be potentially utilized to build an improved SAR model. We perform a comprehensive set of experimental evaluation by building and testing such models using the support vector machine (SVM) framework. Our studies show that selectively incorporating compounds can improve SAR model performance significantly. They also show that an effective way to identify the best enriching or helping target would be to train SAR models using the compounds associated with the target in conjunction with the compounds of the original SAR model. In particular, a nearest neighbor approach to select compounds for incorporation is 26% times better than incorporating all the compounds from the helping target. Our nearest-neighbor selection approaches are motivated by the observation that the performance of machine learning techniques can be improved by incorporating additional positive examples that fill the gaps between existing positive examples in the feature space 34 . These additional positive examples provide extra support to preexisting positive examples 35 thus they help describe the subspace around positive examples and strengthens the positive signals from that subspace. The rest of the paper is organized as follows. In Section 2 we describe the key notations and definitions used in this study. Section 3 defines the problem statement and Section 4 and Section 5 describes the methods developed and tools used in this work, respectively. The experimental results are presented in Section 6 with the collusions and plans of future work described in Section 7. 2. Definitions and Notations In this paper we use T to represent a single protein target, T to represent a set of targets. For each target T i , we use C i to represent its set of experimentally determined active compounds. We will use C to represent the union of active compounds over all targets in T . The most widely used method for experimentally identifying a set of active compounds is to perform an assay using high-throughput screening methods36 and for this reason we will refer to each (T i , C i ) pair as an assay. We
use SARi (X) to denote a structure-activity-relationship (SAR) model trained for target T i using as positive the compounds in the set X. Throughout the paper we will represent each compound by a topological descriptor-based representation37, 16 . In this representation, each compound is modeled as a frequency vector of certain subgraphs (descriptors) present in its molecular graph. Each dimension’s frequency counts the number of times (i.e., embeddings) the corresponding subgraph is present in the compound’s molecular graph. Given a pair of compounds x and y, we will use sim(x, y) to denote their similarity. We will compute the similarity between two compounds using the Tanimoto coefficient38 (also known as the extended Jaccard similarity), which is the most widely used method for measuring the similarity between the descriptor-based representation of compounds. The Tanimoto coefficient is given by: P xk yk k P , (1) sim(x, y) = P 2 P xk + yk2 − xk yk k
k
k
where k goes over all the dimensions of the descriptor space and xk is the number of times descriptor k occurs in compound x. Given a compound x and a set of compounds Y , we denote the k most similar compounds of Y to x by nbrsk (x, Y ) and refer to them as x’s k nearest-neighbor in Y . Analogously, for two sets of compounds X and Y , the union of the k nearest-neighbors of each compound x ∈ X in Y will be denoted by Nbrsk (X, Y ). That is, S Nbrsk (X, Y ) = x∈X nbrsk (x, Y ). 3. Problem Statement Historically a structure-activity-relationship model for target Ti is built by taking into account only its set of active compounds Ci (i.e., we build the SARi (Ci ) model). In this paper we focus on the problem of building better SAR models by incorporating information from other protein targets. Specifically, we are focusing on the following two problems: Problem 3.1 (Helping Target Identification) Given a target T i ∈ T identify a target Ti∗ ∈ T (T i 6= Ti∗ ) such that incorporating information about Ti∗ ’s active compounds into T i ’s SAR model will improve the performance of the SAR model. Problem 3.2 (Helping Compounds Selection) Given a target T i and a helping target Ti∗ with active
April 3, 2008
16:3
WSPC/Trim Size: 11in x 8.5in for Proceedings
XNCSB08
3
compounds Ci∗ , select a subset Hi∗ of the Ci∗ ’s compounds such that by incorporating them into T i ’s SAR model its performance improves. We will refer to target Ti∗ as the helping target for T i , and to the set of compounds Hi∗ as the helping compounds from Ti∗ for T i . Note that in this paper we only focus on the problem of improving the SAR model of a target by incorporating information from a single other target. Extending the framework developed in this paper to the general case in which information from multiple targets are used to improve the quality of a SAR model is left for future research. 4. Methods We develop methods to improve the performance of SAR models by identifying for each target T i a helping target Ti∗ and then selecting from it a set of helping compounds. The helping target Ti∗ is identified as the most similar target to T i based on different target-to-target similarity measures. These measures take into account the similarity of the underlying protein sequences, the similarity of their active compounds, and the benefit obtained by incorporating the helping compounds selected from Ti∗ ’s compounds (Ci∗ ) into T i ’s SAR model. The helping compounds Hi∗ are selected using either the entire set of Ti∗ ’s active compounds or by employing nearestneighbor schemes designed to identify compounds that increase the density around each active compound. In the rest of this section we first describe how we build the SAR models, followed by a description of the methods for helping compound selection and helping target identification. 4.1. Construction of SAR Models We build the SAR models using the support vector machine (SVM)39 classification framework. Given a set of positive training instances (active compounds) C + and a set of negative training instances (inactive compounds) C − , the SVM framework learns a classification function f (x) of the form f (x) =
X ci ∈C +
λ+ i K(x, ci ) −
X
λ− i K(x, ci )
(2)
is computed over the various training-set and test-set instances. Given this function, a new compound x is predicted to be positive or negative depending on whether f (x) is positive or negative. All the SAR models in this study use the Tanimoto coefficient as the kernel function (Equation 1) to capture similarities between compounds that are represented using a standard chemical descriptor representation (described in Section 5.3). It has been shown that the Tanimoto coefficient is a valid kernel function 40 . The standard SVM formulation is designed to solve a binary classification problem and requires positive and negative labeled training instances. For building a SAR model for a given assay (T i , C i ) we use the compounds in C i as positive instances. The negative instances (i.e., inactive compounds) are determined by randomly selecting a subset of the active compounds from the other targets. This is only an approximation as some of the selected inactive compounds may actually be active against T i , as not all compounds in C have been tested against all targets. This approximation will tend to make the classification problem harder but it is a widely-used methodology in Cheminformatics 41 . Note that we restricted our random selection of negative compounds to only the set C (that includes compounds that are active against at least one of the targets in T ) because we wanted to ensure that the SAR models being learned do not trivially differentiate between active compounds and compounds that are in general not active (e.g., large molecules, unfavorable interactions). Another approach might be to use the one-class SVM 41 formulation to train SAR model using only the active compound definitions. The one-class SVM recursively trains different SVM classifier using different samples of the positive data to identify suitable negative instances 41 . However, such an approach is computationally expensive. Nevertheless, we plan to investigate these methods in our future research.
4.2. Helping Compound Selection We developed three methods for determining the helping set Hi∗ from the active compounds of Ti∗ , which are defined as follows:
ci ∈C −
− where λ+ i and λi are non-negative weights that are computed during training by maximizing a quadratic objective function, and K(., .) is called the kernel function that
Hi∗ = Ci∗ , Hi∗ Hi∗
=
(3)
Nbrsk (C i , Ci∗ ),
= Nbrsk (C i , C i ∪
(4) Ci∗ ).
(5)
April 3, 2008
16:3
WSPC/Trim Size: 11in x 8.5in for Proceedings
XNCSB08
4
In all of these selection methods, the selected compounds are incorporated into Ti ’s SAR model by treating them as additional active compounds while learning the SVMbased SAR model for Ti ; i.e., the model learned is SAR(C i ∪ Hi∗ ). The first method (Equation 3) simply selects all of Ti∗ ’s active compounds and treats them as additional positive instances when building Ti ’s SAR model. This selection approach assumes that both Ti and Ti∗ have a high affinity in binding similar compounds, which can happen if their ligand binding sites are very similar. We will refer to this selection approach as hcsALL. The second method (Equation 4) restricts the compounds of Ci∗ that are selected to those belonging in the k nearest-neighbor list of at least one compound in Ci . Thus, it only selects compounds that are sufficiently similar to the active compounds of Ti . We will refer to this selection approach as hcsKNN . The motivation behind this approach is that for the cases in which the ligand binding sites of Ti and Ti∗ are somewhat different, then by not selecting compounds that are dissimilar to those in Ci , we do not erroneously include as actives those compounds from Ci∗ that bind to Ti∗ ’s unique binding-site characteristics. However, in some cases, hcsKNN may select a compound y ∈ Ci∗ , that even though it is among the k most similar compounds to at least a compound x ∈ Ci , the actual similarity between x and y is significantly lower than the similarity between x and other compounds in Ci . In such cases, the inclusion of y into Hi∗ may lead to the same problems associated with the hcsALL method discussed earlier (i.e., include compounds that are different from the true active compounds of Ti ). The third method (Equation 5) addresses this problem by imposing additional restrictions on the selected compounds as it requires them to be among the most similar k compounds in Ci ∪ Ci∗ to at least one compound in Ci . For each compound x ∈ Ci , this method eliminates the compounds selected by hcsKNN that are not among the k overall most similar compounds of x. We will refer to this selection approach as hcsKNN − . All of these helping compound selection methods are inspired by research on active learning 34 and are motivated by the observation that the performance of machine learning techniques can be improved by incorporating additional positive examples that fill the gaps between existing positive examples in the feature space. These additional examples tend to help SVM-based classification algorithms to build models that have a higher classification
accuracy and better generalization characteristics. Also, the resulting SAR models are similar to the cluster kernel 35 where unlabeled data is used to supplement the labeled data. The cluster kernel assumes that unlabeled data within the neighborhood of the labeled data should be used with the same labels. This is based on the “cluster assumption” namely that the class labels do not change in the region of high density 35 . 4.3. Helping Target Identification In the previous section we introduced methods for identifying helping compounds to improve Ti ’s SAR model. In this section, we discuss how to identify Ti ’s helping target Ti∗ . We developed two general classes of methods. The first, identifies Ti∗ as the most similar target to Ti using various similarity measures derived from the amino acid sequence of the targets themselves or their active compounds. The second, identifies Ti∗ by building a series of SVM-based SAR models that evaluate (on a separate model-selection subset of the data) the gains achieved by using each target Tj as a candidate for Ti∗ and then selecting the target that achieved the best performance. We will refer to the former class as similarity-based methods and to the latter class as model-based methods. 4.3.1. Similarity-Based Methods Target Sequence Similarity Protein targets that have similar ligand binding sites (both in terms of their amino acid composition and their 3D structure) show similar binding affinity towards a similar set of compounds 28, 29 . Thus, a natural way of identifying a helping target for Ti , is to rank the various targets based on their binding site’s sequence and structural similarity to Ti ’s binding site. However, knowledge of a protein’s ligand binding site requires its 3D structure, which is not available for most of the proteins. Moreover, many pharmaceutical relevant protein targets (e.g., G protein coupled receptor protein families), have very few available reliable structures 42 . As a result, we cannot directly compare the ligand binding sites for most proteins, limiting the applicability of approaches that focus entirely on the ligand binding site. An alternate approach, is to compare the targets by taking into account only their entire amino acid sequence, which forms the basis of the sequence-based similarity method that we developed. Specifically, we compute pairwise sequence similarity using the standard SmithWaterman local alignment 43 algorithm, with a sensitive profile-based 44 scoring scheme. This profile-to-profile
April 3, 2008
16:3
WSPC/Trim Size: 11in x 8.5in for Proceedings
XNCSB08
5
scheme, called PICASSO 45 , captures sequence conservation signals between proteins, and has shown to detect homologous pairs 46 . We will refer to this method as htiSEQ. Common Active Compounds Pairwise similarities between targets can also be inferred by considering the set of compounds that are active in both sets of targets. If two targets Ti and Tj have a large number of common active compounds then most likely their corresponding ligand binding sites share certain common characteristics. As a result, Tj ’s active compounds that are not present in the list of Ti ’s active compound can potentially be good candidates from which to select a set of helping compounds. Such targets have been hypothesized as to be homologous in the work of Frye et al 33 . Motivated by this, we developed a method, referred to as htiAsy, that determines Ti∗ as the target Tj whose active compounds have the highest amount of overlap with Ti . We computed the degree of overlap (i.e., similarity) between a pair of targets Ti and Tj using a binary version of the Tanimoto coefficient given by htiAsy(Ti , Tj ) =
|C i ∩ C j | . |C i ∪ C j |
(6)
Compound Similarity Rather than determining the similarity between Ti and each other target Tj as a function of their common compounds, we developed schemes that determine this target-to-target similarity by taking into account the similarity between their active compounds. Specifically, we developed three such similarity measures. The first measure, referred to as htiAllAVG, is given by P P x∈C i y∈C j sim(x, y) htiAllAVG(T i , T j ) = , (7) |C i ||C j | and determines the similarity between Ti and Tj as the average pair-wise similarity of their active compounds. The second measure, referred to as htiKnnAVG, is given by htiKnnAVG(T i , T j ) = (8) nbrsk (x,Cj ) sim(x,y) , k|Ci | and determines the similarity between Ti and Tj by only averaging the similarities of the k most similar compounds in Cj for each compound of Ci . This similarity measure was motivated from the observation that in the cases in which Tj contains a relatively large number of P
x∈
Ci
P
y∈
active and diverse compounds, htiAllAVG will tend to be quite small as it represents the overall average. This will hold, even if Ci and Cj contain a large number of similar compounds and as such Tj may be a good candidate for Ti∗ . By restricting the averaging to only include the compounds pairs that are most similar to compounds in Ci , we eliminate this problem. Finally, the third scheme, referred to as htiMKnnAVG, extends htiKnnAVG to also include the k nearest neighbor similarities of Cj compounds in Ci . In this case for every compound in Cj the k most similar compounds in Ci are also determined and their similarities are averaged. The htiMKnnAVG similarity is given by htiMKnnAVG(Ti , Tj ) = htiKnnAVG(Ti , Tj )+ (9) htiKnnAVG(Tj , Ti ). The motivation behind this approach is to provide the target-to-target similarity function the ability to differentiate between a pair of targets T j and T k that have similar htiKnnAVG(Ti , Tj ) and htiKnnAVG(Ti , T k ) values but T k contains a large number of compounds that are not very similar to any of the compounds in Ti . In such cases, we will like the similarity between Ti and T k to be lower than that between Ti and Tj , as T k contains active compounds that due to their differences from those in Ci , may not be useful for improving Ti ’s SAR model. Note that for all three target-to-target similarity measures, the compound-to-compound similarities (Equations 7, 8, and 9) are computed using a descriptor-based representation and the Tanimoto coefficient (Equation 1). Relative Compound Similarity In addition to the target-to-target similarities that take into account the similarity of their respective active compounds, we also developed two similarity measures that quantify the changes in the k nearest neighbors of Ci ’s compounds due to the addition of the compounds from Cj . These methods are motivated by the hcsKNN − scheme for identifying helping compounds described in Section 4.2. The first method, referred to as htiKchg, captures the difference in the neighborhood list for every compound in Ci after incorporating the compounds from Cj . This essentially quantifies how the neighborhood list would change by the introduction of new compounds from Tj and is given by htiKchg(T i , T j ) = P x∈
C i |nbrsk (x,C j )|−|nbrsk (x,C i )| . k|C i |
(10)
April 3, 2008
16:3
WSPC/Trim Size: 11in x 8.5in for Proceedings
XNCSB08
6
The second method measures the difference in the compound similarities of the new set of compounds within the neighborhood. We refer to this measure as htiKgain and is given by htiKgain(T i , T j ) = P x∈
C i nbrsimk (x,C i )−nbrsimk (x,C j ) . k|C i |
(11)
where nbrsimk (x, Y ) is the sum of the similarities between compound x and the compounds in the set nbrsk (x, Y ) given by X nbrsimk (x, Y ) = sim(x, y). (12) y∈nbrsk (x,Y ) 4.3.2. Model-Based Methods Cross-SAR Model One way of identifying Ti∗ , is to select the target Tj such that Tj ’s SAR model is the most similar to Ti ’s SAR model. Since the SAR model is designed to capture the activity-related structural properties of the compounds, then if two targets have very similar SAR models it follows that their active compounds have similar structural properties and as such they are good candidates for being the helping targets for each other. In order to develop a helping target identification method based on this principle, we need to first build a SAR model for each target and then devise a method to assess their similarity. In the context of SVM-based SAR model construction, the extent to which SAR-to-SAR similarities can be easily determined is a function of the kernel function being used. For some kernel function (e.g., linear kernel), it is relatively easy to obtain the primal form of the model and compare them directly. However, for other kernels (including the Tanimoto kernel used in this paper), the model is available only in its dual form, making it hard to directly compare them. However, the similarity between Ti ’s and Tj ’s SAR models (SARi and SARj ) can be estimated by first using one to predict the other’s compounds and then comparing the classification performance obtained in this fashion over that obtained by its own model (i.e., comparing the performance achieved for classifying Ti ’s compounds on both SARi and SARj ). This observation forms the basis of the cross-SAR (denoted by xSAR) helping target identification method that we developed. For each target, Tj , we build its SARj model and use it to classify Ci . The target that achieved the best classification performance is selected as the helping target Ti∗ . Note that this approach requires that the
training and evaluation of the different models is done in such a way so that the same compounds are not used both for training and evaluation. Details on our experimental methodology that addresses this issue are provided in Section 5.5. Integrated-SAR Model We also developed an alternate class of approaches to identify Ti∗ by building a SAR model for Ti using the helping compound selection schemes described in Section 4.2 for each target Tj . For example, using the hcsALL selection method, this approach will treat each target Tj as the helping target and build a model for Ti using Ci ∪ Cj as the positive class. The classification performance of each of these models will be assessed (using an independent evaluation set), and the target Tj that achieved the best performance will be used as the helping target Ti∗ . We refer to this approach as integrated-SAR (iSAR). Note that there are three iSAR approaches, one for each of the three helping compound selection schemes that we developed; i.e., hcsALL, hcsKNN , and hcsKNN − . Comparing the iSAR with xSAR approaches we expect that iSAR to perform better as it integrates into helping target selection the subsequent helping compound selection step and identifies the target based on the overall classification performance. However, iSAR’s disadvantage is its higher computational requirements. In order for iSAR to identify the helping targets for each of the targets in T it requires the training of |T |2 models, whereas xSAR requires only |T | models. 5. Materials 5.1. Datasets We evaluated our SAR models using a set of assays derived from a wide variety of databases that store the bioactivity relationship between a target and a set of small chemical molecules or ligands. In particular, these databases provide us target-ligand activity relationship pairs. We use the PubChem 47 database to extract targetspecific dose-response confirmatory assays. For each assay we choose compounds that show the desired activity and confirmed as active by the database curators. We filter compounds that show different activity signals in different experiments against the same targets and they are deemed to be inconclusive and so not used in the study. Duplicate compound entries are removed by comparing the SMILES 23 representations of these molecules. We
April 3, 2008
16:3
WSPC/Trim Size: 11in x 8.5in for Proceedings
XNCSB08
7
also incorporate target-ligand pairs from other databasesBindingDB 48 , DrugBank 49 , PDSP Ki database 50 , KEGG BRITE database 51 , and an evaluation sample of the WOMBAT database 52 . After the above integration and filtering steps our final dataset contains 238 targets, and 15030 ligands with a total of 21203 target-ligand active pairs, resulting on an average of 89 active compounds per target. Also, certain compounds may show activity in relation with two or more targets as well. All the protein target sequences are mapped to a unified identifier by searching the UniProtKB database 53 using the BLAST 54 sequence-based search program. Amongst the 238 protein targets, there are 45 GPCRs, 36 protein kinases, 130 enzymes, and 27 unknown which is not surprising, as large number of targets found useful in drug discovery studies lie in the GPCR, kinases, and enzyme families 55 .
5.2. Evaluation Metrics We measure the quality of the SAR models using the standard receiver operating characteristic (ROC)56 scores. The ROC score is the normalized area under the curve that plots the true positives against the false positives for different thresholds for classification. Since we train a model multiple times by randomly choosing negative class, the performance of the model is the average of ROC score of all tests. The focus of this paper is to improve the performance of the SAR model, hence we report the improvement achieved in the classifier performance (using ROC) in comparison to the SARi (C i ) model.
5.3. Chemical Compound Descriptor In our study we use the AFGEN-based 57, 58 descriptor space to represent chemical compounds. These descriptors are generated using the AFGEN59 program, that uses a quick and efficient subgraph mining algorithm to enumerate the number of occurrences of fragments or subgraphs of size four to seven prevalent within the chemical compounds. The AFGEN descriptors were shown to be more sensitive to other geometry-based descriptors like ECFP6 60 and the commercial Chemaxon fingerprints 61 in previous studies 57, 58 . Due to the previous studies and some preliminary results (not shown here) we chose only to use the AFGEN-based descriptors for representing the chemical compounds.
5.4. Support Vector Machines We use the publicly available support vector machine tool SVMlight 62 which implements an efficient soft margin optimization algorithm. In all of our experiments, we use the default parameters for solving the quadratic programming problem, and we use the default regularization parameter C which controls the margin width and the misclassification cost. In our case since there is a difference in the size of the positive and negative examples (i.e., number of actives and inactives for training the SAR model) the SVM model can be biased towards the larger class. We avoid this by setting the misclassification cost j parameter in SVMlight to be dependent on the class size distributions. 5.5. Training and Selecting the Inactives To construct a SAR model for T i we use the SVM-based binary classifier. The construction of the SARi (C i ) model uses the compounds in the set C i as actives (positive instances) and the inactives (negative instances) are randomly selected from the compounds in the set C − C i . In this study, however we study the performance of the SAR models by incorporating compounds from a single other target. In this case, to train a iSAR model using Ti and Tj , the active compounds are from the set C i ∪ C j whereas the inactive compounds are randomly selected from the set {C − (C i ∪ C j )}. For training the crossSAR model xSAR the set of inactive compounds are the same as in the previous case, however the training positive instances are obtained exclusively from the set C j and the test positive instances are in the set C i . For each of the SAR models the evaluation is performed using five iterations where randomly half the compounds in the positive and negative instance sets are assigned to be part of the training and evaluation set. Since we evaluate the performance of our SAR models for every target using the SARi (C i ) as the baseline we ensure that the evaluation and training data remain the consistent for each iteration and parameter. 6. Results In this section we evaluate the various schemes for identifying helping targets and selecting helping compounds described in Sections 4.2 and 4.3 and report the improvements achieved by the corresponding SAR models over the performance achieved by the models that do not incorporate such information. In the following tables, k
April 3, 2008
16:3
WSPC/Trim Size: 11in x 8.5in for Proceedings
XNCSB08
8
always refers to the number of nearest neighbors considered when the corresponding scheme depends on such a number as a parameter. For all our experiments we also perform the Student’s t-test and have found the improvements reported in this study to be statistically significant. 6.1. Helping Target Identification 6.1.1. Similarity-based Methods Table 1 shows the average ROC performance improvements achieved by the various similarity-based helping target identification schemes. These results were obtained using the hcsALL scheme for selecting the helping compounds (Hi∗ ) for each target. Comparing the performance of the first three schemes, which do not depend on the number of neighboring compounds k, we see that htiAsy performs the best, achieving an average ROC improvement of 2.7%, whereas the htiAllAVG performs the worse (average ROC improvement of 0.7%). The performance of the sequence-based scheme (htiSEQ) is between those two (average ROC improvement of 1.6%). These results indicate that the number of common active compounds across targets provides a good indication as to whether the corresponding targets are biologically related and share a certain level of common binding affinity to similar active compounds. Also, the fact that the sequence-based scheme did not perform as well indicates that a strictly sequence-based target comparison that does not take into account the binding site of the targets is not very effective in identifying helping targets. Table 1. Performance of similarity-based helping target identification schemes. htiAsy htiSEQ htiAllAVG htiKnnAVG htiMKnnAVG htiKgain htiKchg
2.7 1.6 0.7 -
k=1 2.9 2.5 3.1 3.2
k=2 3.2 2.4 3.3 3.0
k=3 3.1 2.6 3.4 2.7
k=4 3.1 2.8 3.3 2.2
k=5 3.0 2.8 3.4 1.3
The results correspond to the ROC percentage improvement achieved by SAR models that incorporate information from helping targets over the ROC obtained by SAR models trained only on the active compounds of each target. The results are the average improvements over the 238 protein targets. All results used the hcsALL helping compound selection scheme. The entries marked as ‘-’ correspond to cases that are not applicable for that scheme. Bold-faced entries correspond to the best performing scheme.
Comparing the performance of the four schemes that
utilize absolute or relative compound similarity, we see that htiKgain achieves the overall best results (average ROC improvement of 3.4%), even though the performance of the other schemes is not substantially lower (at least for some values of k). Moreover, all these schemes outperform htiAsy for some value of k. Analyzing the sensitivity of the various schemes in relation to the value of k, we see that with the exception of htiKchg, the performance of the other schemes is reasonably uniform as k increases from one to five.
6.1.2. Model-based Methods Table 2 shows the performance improvements achieved by the two classes of model-based schemes for identifying helping compounds. The iSAR results for each one of the compound selection schemes (hcsALL, hcsKNN , and hcsKNN − ) were obtained by building SAR models using the respective selection scheme, whereas the results for the xSAR scheme were obtained by using the xSAR approach to identify the helping target and then building SAR models by selecting from that target compounds according to the three selection schemes. These results show that the best overall performance, an average ROC improvement of 8.6%, was achieved by the iSAR approach using the hcsKNN − compound selection scheme, whereas the hcsKNN scheme achieves the second best results (average ROC improvement of 8.2%). Comparing the xSAR against the iSAR scheme, we see that the performance achieved by the former is considerably worse. However, comparing the performance of the different compound selection approaches in the context of xSAR, we see that hcsALL does considerably better than the other two. This result may be surprising at first, but it can be easily understood if we consider the types of helping targets that xSAR selects. Since xSAR will select as the helping target for each Ti , the one that has the most similar SAR model with it, it essentially selects a target whose majority of the compounds can help target Ti . As a result, the helping target selection is biased towards the hcsALL compound selection scheme, which can explain the results. Comparing the performance achieved by the similarity- and model-based schemes, we see that the latter does considerably better. This is because by coupling target identification along with compound selection makes it possible to explore a larger search space of potential compound subsets to be incorporated. This is a direct consequences of the fact that the xSAR model re-
April 3, 2008
16:3
WSPC/Trim Size: 11in x 8.5in for Proceedings
XNCSB08
9 Table 2.
Performance of model-based helping target identification schemes.
hcsALL xSAR iSAR
5.6 6.8
k=1 2.5 7.5
k=2 2.6 7.9
hcsKNN k=3 k=4 2.6 2.7 7.9 8.0
k=5 2.4 8.2
k=1 2.8 8.6
hcsKNN − k=2 k=3 k=4 2.8 4.1 3.5 8.0 8.6 8.0
k=5 4.0 8.1
The results correspond to the ROC percentage improvement achieved by SAR models that incorporate information from helping targets over the ROC obtained by SAR models trained only on the active compounds of each target. For each helping compound selection scheme, the results for the iSAR scheme were obtained by the corresponding helping compound selection scheme. Bold-faced entries correspond to the best performing scheme.
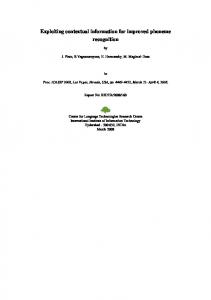
quires |T | models versus the |T |2 models for the iSAR. 6.2. Helping Compounds Identification The results in Table 2 also help illustrate the relative performance differences of the three helping compound selection schemes that we developed. Specifically, the results for the iSAR target identification scheme illustrate that the nearest neighbor-based schemes, when coupled with a sophisticated helping target identification method considerably outperform the hcsALL scheme. Moreover, among the two nearest neighbor-based schemes, hcsKNN − does better. The relative advantage of hcsKNN − over hcsKNN can also be seen from the results obtained for the xSAR scheme, in which hcsKNN − did considerably better. These results confirm our earlier observations (Section 4.2) that selecting compounds that try to fill the gaps between the active compounds of a particular target is a good strategy for improving the performance of SAR models. 6.3. Best Performance Comparison To better illustrate the performance gains achieved by some of the best performing schemes across the different protein targets in our dataset, Figure 1 shows a histogram of the amount of improvement across the different targets. From these results we can see that the modelbased helping target identification schemes lead to significant improvements for a larger number of targets than the similarity-based schemes. For example, the iSAR scheme using hcsKNN − leads to improvements that are greater than 15% for 47 out of the 238 targets. Thus, even though its average improvement over the entire set of targets is 8.6%, there is a considerable subset of protein targets for which the improvements are quite high. 7. Conclusion In this paper, we focussed on the problem of improving the performance of the structure-activity-relationship
(SAR) models by incorporating information from other targets. We developed methods to identify the target that will lead to the best improvement and methods to select from these target’s compounds to be used as additional positive instances during the SAR model construction. Our experimental evaluation showed that significant performance gains can be obtained for a large fraction of protein targets. Methods that carefully identify the right set of compounds so as to fill the gap between existing positive examples in the feature space coupled with a model-based target identification method achieve the most promising results. Acknowledgments. This work was supported by NSF EIA-9986042, ACI0133464, IIS-0431135, NIH RLM008713A, the Digital Technology Center and Minnesota Supercomputing Institute at the University of Minnesota. References 1. C. Hansch, P. P. Maolney, T. Fujita, and R. M. Muir. Correlation of biological activity of phenoxyacetic acids with hammett substituent constants and partition coefficients. Nature, 194:178–180, 1962. 2. C. Hansch, R. M. Muir, T. Fujita, C. F. Maloney, and Streich M. The correlation of biological activity of plant growth-regulators and chloromycetin derivatives with hammett constants and partition coefficients. Journal of American Chemical Society, 85:2817–1824, 1963. 3. S. Wold, E. Johansson, and M. Cocchi. 3d qsar in drug design: Theory, methods and application. ESCOM Science Publishers B.V, 1993. 4. M. Otto. Chemometrics. Wiley-VCH, 1999. 5. Xiaoyang Xia, Edward G Maliski, Paul Gallant, and David Rogers. Classification of kinase inhibitors using a bayesian model. J Med Chem, 47(18):4463–4470, Aug 2004. 6. Xin Chen, Andrew Rusinko, and Stanley S. Young. Recursive partitioning analysis of a large structure-activity data set using three-dimensional descriptors. Journal of Chemical information and Computer Science, 38(6):1054–1062, November 1998. 7. Andrew Rusinko, Mark W. Farmen, Christophe G. Lambert, Paul L. Brown, and Stanley S. Young. Analysis of a
16:3
WSPC/Trim Size: 11in x 8.5in for Proceedings
XNCSB08
10
200 htiKchg(3) - hcsALL xSAR - hcsALL iSAR - hcsALL iSAR - hcsKNN-(3)
150
Target distribution
April 3, 2008
100
50
0 2.5
7.5
12.5
17.5 22.5 27.5 32.5 37.5 42.5 Percentage performance improvement
47.5
52.5
57.5
Fig. 1. SAR model performance percentage improvement distribution using hti-hcs.
8.
9.
10. 11. 12. 13.
large structure/biological activity data set using recursive partitioning. Journal of Chemical information and Computer Science, 1999. A. An and Y. Wang. Comparisons of classification methods for screening potential compounds. In IEEE International Conference on Data Mining, 2001. T. A. Andrea and Hooshmand Kalayeh. Applications of neural networks in quantitative structure-activity relationships of dihydrofolate reductase inhibitors. Journal of Medicinal Chemistry, 34:2824–2836, 1991. D. J. Livingstone. Neural networks in qsar and drug design. Acemedic Press, London, 1996. J. Zupan and J. Gasteiger. Neural networks for Chemists. VCH Publisher, 1993. J. Devillers. Neural networks in QSAR and Drug Design. Acemedic Press, London, 1996. Evgeny Byvatov, Uli Fechner, Jens Sadowski, and Gisbert Schneider. Comparison of support vector machine and artificial neural network systems for drug/nondrug classification. Journal of Chemical Information and Computer Science, 43(6):1882–1889, 2003.
14. M. Deshpande, M. Kuramochi, N. Wale, and G. Karypis. Frequent substructure-based approaches for classifying chemical compounds. IEEE Transactions on Knowledge and Data Engineering, 17(8):1036–1050, 2005. 15. Nikil Wale, Ian A. Watson, and George Karypis. Comparison of descriptor spaces for chemical compound retrieval and classification. Knowledge and Information Systems, (in press), 2007. 16. Gianpaolo Bravi, Emanuela Gancia ; Darren Green, V.S. Hann, and M. Mike. Modelling structure-activity relationship. In H.J. Bohm and G. Schneider, editors, Virtual Screening for Bioactive Molecules, volume 10. WileyVCH, August 2000. 17. D. J. Livingstore. The characterization of chemical structures using molecular properties. a survey. Journal of Chemical information and Computer Science, 2000. 18. Jurgen Bajorath. Integration of virtual and high-throughput screening. Nat Rev Drug Discov, 1(11):882–894, Nov 2002. 19. S. C. Basak, V. R. Magnuson, J. G. Niemi, and R. R. Regal. Determining structural similarity of chemicals using graph
April 3, 2008
16:3
WSPC/Trim Size: 11in x 8.5in for Proceedings
XNCSB08
11
20.
21.
22.
23. 24. 25.
26.
27.
28.
29.
30.
31.
32.
33.
34.
35.
theoretic indices. Discrete Applied Mathematics, 19:17– 44, 1988. L. H. Hall and L. B. Kier. Electrotopological state indices for atom types: A novel combination of electronic, topological, and valence state information. Journal of Chemical information and Computer Science, 1995. F. Yang, Z. D. Wang, Y. P. Huang, and H. L. Zhu. Novel topological index f based on incidence matrix. J. Comp. Chem., 24(14):1812–1820, 2003. R. E. CarHart, D. H Smith, and R. Venkataraghavan. Atom pairs as molecular features in atructure-activity studies: Definition and applications. Journal of Chemical information and Computer Science, 25(2):64–73, May 1985. Daylight Inc., Mission Viejo, CA, USA. http://www.daylight.com. MDL Information Systems Inc. San Leandro, CA, USA. http://www.mdl.com. Tamas Horvath, Thomas Grtner, and Stefan Wrobel. Cyclic pattern kernels for predictive graph mining. In ACM SIGKDD Intl Conference on Knowledge Discovery and Data Mining, pages 158–167, 2004. J. Hert, P. Willet, D. Wilton, P. Acklin, K. Azzaoui, E. Jacoby, and A. Schuffenhauer. Comparison of topological descriptors for similarity-based virtual screening using multiple bioactive reference structures. Organic and Biomolecular Chemistry, 2:3256–3266, 2004. D. Rogers, R. Brown, and M. Hahn. Using extendedconnectivity fingerprints with laplacian-modified bayesian analysis in high-throughput screening. J. Biomolecular Screening, 10(7):682–686, 2005. R. P. Sheridan, M. D. Miller, D. J. Underwood, and S. J. Kearsley. Chemical similarity using geometric atom pair descriptors. Journal of Chemical information and Computer Science, 1996. E. K. Davies. Molecular diversity and combinatorial chemistry: Libraries and drug discovery. American Chemical Society, 118(2):309–316, January 1996. M. J. Ashton, M. C. Jaye, and J. S. Mason. New perspectives in lead generation ii: Evaluating molecular diversity. Drug Discovery Today, 1996. Stephen D. Pickett, Jonathan S. Mason, and Iain M. McLay. Diversity profiling and design using 3d pharmacophores: Pharmacophore-derived queries (pdq). Journal of Chemical information and Computer Science, 1996. Nikolaus Stiefl, Ian A. Watson, Kunt Baumann, and Andrea Zaliani. Erg: 2d pharmacophore descriptor for scaffold hopping. J. Chem. Info. Model., 46:208–220, 2006. S. Frye. Structure-activity relationship homology(sarah): a conceptual framework for drug discovery in the genomic era. Chemistry and Biology, pages R3–R7, 1999. S. Joshua Swamidass, Jonathan Chen, Jocelyne Bruand, Peter Phung, Liva Ralaivola, and Pierre Baldi. Kernels for small molecules and the prediction of mutagenicity, toxicity and anti-cancer activity. Bioinformatics, 21(1):359– 368, 2005. J. Weston, A. Elisseeff, D. Zhou, C. Leslie, and W. S. Noble. Protein ranking: from local to global structure in protein similarity network. PNAS USA, 101:6559–6563, 2004.
36. Handen J.S. High-throughput screening - challenge for the future. Drug Discovery World, pages 47–50, 2002. 37. H.J. Bohm and G. Schneider. Virtual Screening for Bioactive Molecules, volume 10. Wiley-VCH, August 2000. 38. Peter Willett. Chemical similarity searching. J. Chem. Info. Model., 38(6):983–996, 1998. 39. V. Vapnik. Statistical Learning Theory. John Wiley, New York, 1998. 40. J. M. Barnard P. Willett and G. M. Downs. Chemical similarity searching. Journal of Chemical Information and Computer Sciences, 38:983–997, 1998. 41. D.K. Agrafiotis, D. Bandyopadhyay, J.K. Wegner, and H. vanVlijmen. Recent advances in chemoinformatics. Journal of Chemical Information and Modeling, 47(4):1279–1293, 2007. 42. MH¨uller G. Towards 3d structures of g protein-coupled receptors: a multidisciplinary approach. Current Medicinal Chemistry, 7:861–888, 2000. 43. T. F. Smith and M. S. Waterman. Identification of common molecular subsequences. Journal of Molecular Biology, 147:195–197, 1981. 44. S. F. Altschul, L. T. Madden, A. A. Schffer, J. Zhang, Z. Zhang, W. Miller, and D. J. Lipman. Gapped blast and psi-blast: a new generation of protein database search programs. Nucleic Acids Research, 25(17):3389–402, 1997. 45. A. Heger and L. Holm. Picasso:generating a covering set of protein family profiles. Bioinformatics, 17(3):272–279, 2001. 46. Huzefa Rangwala and George Karypis. Profile-based direct kernels for remote homology detection and fold recognition. Bioinformatics, 21(23):4239–4247, Dec 2005. 47. pubchem.ncbi.nlm.nih.gov. The PubChem Project. 48. Lin X.Wen R.N.Jorrisen T. Liu, Y. and M.K. Gilson. Bindingdb: a web-accessible database of experimentally determined protein-ligand binding affinities. Nucleic Acids Research 00(Database Issue), pages D1–D4, 2006. 49. David S. Wishart, Craig Knox, An Chi Guo, Savita Shrivastava, Murtaza Hassanali, Paul Stothard, Zhan Chang, and Je nnifer Woolsey. DrugBank: a comprehensive resource for in silico drug discovery and exploration. Nucl. Acids Res., 34(suppl1):D668–672, 2006. 50. S Patel BL Roth, WK Kroeze and E Lopez. The multiplicity of serotonin receptors: Uselessly diverse molecules or an embarrasment of riches? The Neuroscientist, 6:252– 262, 2000. 51. http://www.genome.jp/kegg/brite.html. 52. L. Ostopovici R. Rad A. Bora N. Hadaruga I. Olah M. Banda Z. Simon M. Mracec M. Olah, M. Mracec and T.I. Oprea. Wombat: World of molecular bioactivity. Chemoinformatics in Drug Discovery. Wiley-VCH, New York, pages 223–239, 2004. 53. http://beta.uniprot.org/. 54. S. F. Altschul, W. Gish, E. W. Miller, and D. J. Lipman. Basic local alignment search tool. Journal of Molecular Biology, 215:403–410, 1990. 55. Lead optimization strategies an analysis of novel molecular targets to develop innovative new therapeutics. January 2005.
April 3, 2008
16:3
WSPC/Trim Size: 11in x 8.5in for Proceedings
XNCSB08
12
56. Tom Fawcett. Roc graphs: Notes and practical considerations for researchers, 2004. 57. N. Wale M. Deshpande, M. Kuramochi and G. Karypis. Frequent substructure-based approaches for classifying chemical compounds. IEEE Transactions on Knowledge and Data Engineering. 58. I. A. Watson N. Wale and G. Karypis. Comparison of descriptor spaces for chemical compound retrieval and classification. Knowledge and Information Systems, 2007. 59. Nikil Wale and George Karypis. Afgen. Technical report,
Department of Computer Science & Enigneering, University of Minnesota, 2007. www.cs.umn.edu/ karypis. 60. D. Rogers and R. D. Brown. Using extended-connectivity fingerprints with laplacian-modified bayesian analysis in high-throughput screening. Journal of Biomolecular Screening, 10:682–686, 2005. 61. ChemAxon Inc. Budapest, Hungary. www.chemaxon.com. 62. T. Joachims. Making large-scale svm learning practical. advances in kernel methods - support vector learning. MIT press, 1999.