computers Article
Induction Motor Parameter Identification Using a Gravitational Search Algorithm Omar Avalos *, Erik Cuevas and Jorge Gálvez Departamento de Electrónica, Universidad de Guadalajara, CUCEI, Av. Revolución 1500, Guadalajara, Jal, Mexico;
[email protected] (E.C.);
[email protected] (J.G.) * Correspondence:
[email protected]; Tel.: +52-33-1378-5900 (ext. 27714) Academic Editor: Pedro Alonso Jordá Received: 12 February 2016; Accepted: 22 April 2016; Published: 27 April 2016
Abstract: The efficient use of electrical energy is a topic that has attracted attention for its environmental consequences. On the other hand, induction motors represent the main component in most industries. They consume the highest energy percentages in industrial facilities. This energy consumption depends on the operation conditions of the induction motor imposed by its internal parameters. Since the internal parameters of an induction motor are not directly measurable, an identification process must be conducted to obtain them. In the identification process, the parameter estimation is transformed into a multidimensional optimization problem where the internal parameters of the induction motor are considered as decision variables. Under this approach, the complexity of the optimization problem tends to produce multimodal error surfaces for which their cost functions are significantly difficult to minimize. Several algorithms based on evolutionary computation principles have been successfully applied to identify the optimal parameters of induction motors. However, most of them maintain an important limitation: They frequently obtain sub-optimal solutions as a result of an improper equilibrium between exploitation and exploration in their search strategies. This paper presents an algorithm for the optimal parameter identification of induction motors. To determine the parameters, the proposed method uses a recent evolutionary method called the gravitational search algorithm (GSA). Different from most of the existent evolutionary algorithms, the GSA presents a better performance in multimodal problems, avoiding critical flaws such as the premature convergence to sub-optimal solutions. Numerical simulations have been conducted on several models to show the effectiveness of the proposed scheme. Keywords: gravitational search algorithm (GSA); induction motors; multimodal error surface
1. Introduction The environmental consequences that overconsumption of electrical energy entails has recently attracted the attention in different fields of engineering. Therefore, the improvement of machinery and elements that have high electrical energy consumption levels has become an important task today [1]. Induction motors present several benefits such as their ruggedness, low price, cheap maintenance, and easy operation [2]. However, more than half of the electric energy consumed by industrial facilities is due to the use of induction motors. With the massive use of induction motors, electrical energy consumption has increased exponentially over the years. This fact has generated the need to improve their efficiency, which mainly depends on their internal parameters. The parameter estimation of induction motors represents a complex task due to its non-linearity. As a consequence, different alternatives have been proposed in the literature. Some examples include that proposed by Waters and Willoughby [3], where the parameter are estimated from the knowledge of certain variables, such as stator resistance and the leakage reactance, that proposed by Ansuj [4], where the identification is
Computers 2016, 5, 6; doi:10.3390/computers5020006
www.mdpi.com/journal/computers
Computers 2016, 5, 6
2 of 12
based on a sensitivity analysis, and that proposed by De Kock [5], where the estimation is conducted through an output error technique. Asan alternative to such techniques, the problem of parameter estimation in induction motors has also been addressed via evolutionary methods. In general, they have demonstrated, under several circumstances, to deliver better results than those based on deterministic approaches in terms of accuracy and robustness [6]. Some examples of these approaches used in the identification of parameters in induction motors involve methods, such as genetic algorithms (GAs) [7], particle swarm optimization (PSO) [8,9], artificial immune system (AIS) [10], the bacterial foraging algorithm (BFA) [11], the shuffled frog-leaping algorithm [12], a hybrid of GAs and PSO [13], and multiple-global-best guided artificial bee colony (ABC) [14]. Although these algorithms present interesting results, they have an important limitation: They frequently obtain sub-optimal solutions as a consequence of the limited balance between exploration and exploitation in their search strategies. On the other hand, the gravitational search algorithm (GSA) [15] is a recent evolutionary computation algorithm which was inspired by the physical phenomenon of the gravity. In the GSA, its evolutionary operators are built considering gravitation principles. Different from most of the existent evolutionary algorithms, the GSA presents a better performance in multimodal problems, avoiding critical flaws such as the premature convergence to sub-optimal solutions [16,17]. Such characteristics have motivated its use to solve an extensive variety of engineering applications such as energy [18], image processing [6] and machine learning [19]. This paper presents an algorithm for the optimal parameter identification of induction motors. To determine the parameters, the proposed method uses a GSA. A comparison with state-of-the-art methods such as ABC [20], differential evolution (DE) [21], and PSO [22] on different induction models has been incorporated to demonstrate the performance of the proposed approach. Conclusions of the experimental comparison are validated through statistical tests that properly support the discussion. The sections of this paper are organized as follows: Section 2 describes the GSA method. In Section 3, the identification problem is exposed. In Section 4, the experimental results are presented. Finally, in Section 5, the conclusions are stated. 2. Gravitational Search Algorithm The GSA was proposed by Rashedi [15] in 2009, inspired by the laws of gravity. Different from most of the existent evolutionary algorithms, the GSA presents a better performance in multimodal problems, avoiding critical flaws such as the premature convergence to sub-optimal solutions [13,14]. In the GSA, candidate solutions emulate masses which attract each other through operators that mimic the gravitational force. Under the GSA, the mass (quality) of each candidate solution is assigned according to its corresponding fitness value. The GSA has been designed to find the global solution of a nonlinear optimization problem with box constraints in the form: minimize f pxq, x “ px1 , . . . , x d q P Rd , subject to x P X
(1)
ˇ ! ) ˇ where f : Rd Ñ R is a nonlinear function, whereas X “ x P Rd ˇ lh ď x h ď uh , h “ 1, . . . , d is a bounded feasible space, constrained by the lower (lh ) and upper (uh ) limits. To solve the problem formulated in Equation (1), the GSA utilizes a population of N candidate solutions. Each mass (or candidate solution) represents a d-dimensional vector xi ptq “ pxi1 , . . . , xid q pi P 1 . . . , Nq, where each dimension corresponds to a decision variable of the optimization problem at hand. In the GSA, at a time t, the force acting from a mass i to a mass j of the h variable ph P 1 . . . , dq is defined as follows: Mpi ptq ˆ Ma j ptq h Fijh ptq “ Gptq px j ptq ´ xih ptqq (2) Rij ptq ` ε
Computers 2016, 5, 6
3 of 12
where Ma j is the active gravitational mass related to solution j, Mpi symbolizes the passive gravitational mass of solution i, Gptq is the gravitational constant at time t, ε is a small constant, and Rij is the Euclidian distance between the i-th and j-th individuals. In the GSA, G(t) is a function which is modified during the evolution process. The idea behind this modification is to adjust the balance between exploration and exploitation through the alteration of the attraction forces among solutions. The total force acting over a candidate solution i is defined by the following model: N ÿ
Fih ptq “
Fijh ptq
(3)
j“1,j‰i
Then, the acceleration of the candidate solution i at time t is computed as follows: aih ptq “
Fih ptq Mni ptq
(4)
where Mni represents the inertial mass of the candidate solution i. Under such conditions, the new position of each candidate solution i is calculated as follows: xih pt ` 1q “ xih ptq ` vih pt ` 1q h vi pt ` 1q “ randpq ¨ vih ptq ` aih ptq
(5)
At each iteration, the gravitational and inertia masses of each particle are evaluated in terms of its fitness function. Therefore, the gravitational and inertia masses are updated by the following equations: Mai “ Mpi “ Mii “ Mi mi ptq “
f pxi ptqq ´ worstptq bestptq ´ worstptq
m ptq Mi ptq “ ř N i j“1 m j ptq
(6) (7) (8)
where f p¨q represents the objective function whose final result exhibits the fitness value. On the other hand, best(t) and worst(t) symbolizes the best and worst fitness values found at time t in the complete population. Algorithm 1 illustrates the pseudo code of the GSA method. Algorithm 1. Gravitational search algorithm (GSA) pseudo code. Random Initialization of the population Find the best and worst solutions in the initial population while (stop criteria) for i = 1:N (for all elements) update Gptq, bestptq, worstptq and Mi ptq for i “ 1, 2.., N calculate the mass of individual Mi ptq calculate the gravitational constant Gptq calculate acceleration aih ptq update the velocity and positions of each individual vih , xih end for Find the best individual end while Display the best individual as the solution
Computers 2016, 5, 6
4 of 12
3. Identification Problem Formulation The parameters of an induction motor are not directly measurable. Because of this, they are commonly estimated by identification methods. Under such approaches, the behavior of an induction motor is modeled by equivalent nonlinear circuits. Depending on the accuracy, there are two different circuit models [10]: the approximate circuit model and the exact circuit model. In general, they allow the adequate relation of the motor parameters for their estimation. In the identification process, the parameter estimation is transformed into a multidimensional optimization problem where the internal parameters of the induction motor are considered as decision variables. Therefore, the objective is to minimize the error between the estimated and the manufacturer data, adjusting the parameters of the equivalent circuit. Under this approach, the complexity of the produced formulations tends to produce multimodal error surfaces for which their cost functions are significantly difficult to minimize. 3.1. Approximate Circuit Model The approximate circuit model does not consider the magnetizing reactance and rotor reactance in its structure; hence, its accuracy is less than the exact circuit model. The approximate circuit model ´ ¯ uses the manufacturer data starting torque (Tlr ), maximum torque (Tmax ), and full load torque T f l to determine the stator resistance (R1 ), rotor resistance (R2 ), stator leakage reactance pX1 q, and motor slip (s). Figure 1 illustrates the approximate circuit model. Under the approximate circuit model, the Computers 2016, 5, 6 5 of 13 identification task can be formulated as the following optimization problem: 2 pR , R2 , X , sq 2P R4 , minimize J ( x) JA(pxq, f ( x))x “ ( f (1x)) 2 ( f1 ( x)) A
1
2
3
subject to 0 ď R1 ď 1, 0 ď R2 ď 1, 0 ď X1 ď 10, 0 ď s ď 1 Kt R2 T fl R2 2 2 s R1 X1 s 2 2 2 J A pxq “ p f 1 pxqq ` p f 2 pxqq ` p f 3 pxqq f ( x) 1 Kt RT2 fl ” ı ´ Tf l s p R1 ` R2 {sq2 `X12 Kt R2 f 1 pxq “ Tlr R1 R2 T2 fl X12 f ( x) K t R2 2 Tlr ´ Tlr p R1 ` R2 q2 `X12 f 2 pxq “ Kt Tlr Tmax K 2” R1 bRt 12 X12ı ´ Tmax 2 R1 ` R21 `X12 f ( x) 3 “ f 3 pxq Tmax Tmax 3V 2 3V 2ph Kt “ ph K ωs t
where
(9)
(10) (10)
s
Figure 1. 1. Approximate Approximate circuit circuit model. model. Figure
3.2. Exact Circuit Model Different from the approximate circuit model, in the exact circuit model, the effects of the magnetizing reactance and rotor reactance are considered in the computation. In this model, the stator resistance ( R1 ), rotor resistance ( R2 ), stator leakage inductance X 1 , rotor leakage reactance
X2 ,
magnetizing leakage reactance
Xm ,
and motor slip (s) are calculated to determine the
maximum torque ( Tmax ), full load torque T fl , starting torque ( Tstr ), and full load power factor
Computers 2016, 5, 6
5 of 12
3.2. Exact Circuit Model Different the approximate circuit model, in the exact circuit model, the effects of6 the Computers 2016, 5,from 6 of 13 magnetizing reactance and rotor reactance are considered in the computation. In this model, the stator resistance (R1 ), rotor resistance (R2 ), stator leakage inductance pX1 q, rotor leakage reactance 2 2 2 2 to determine the maximum pX2 q, magnetizing leakage reactance m ( fq,( xand )) motor ( f ( x)) slip ( f(s)( xare )) calculated ( f ( x)) ´J ( x¯)pX E
1
2
3
4
torque (Tmax ), full load torque T f l , starting torque (Tstr ), and full load power factor (pf ). Figure 2 shows the exact circuit model. UnderKthe exact circuit model, the identification task can be formulated t R2 T fl as the following optimization problem: 2 Kt R2 R
Tstr s Rth 2 X 2 s Rth R2 2 6X 2 f ( x )minimize JE pxq, x “ pR1 , R, 2 ,f2X(1x,)X2 , Xm , sq P R , 1 Tstr T fl
subject to 0 ď R1 ď 1, 0 ď R2 ď 1, 0 ď X1 ď 1, 0 ď X2 ď 1, 0 ď Xm ď 10, 0 ď s ď 1 where
X 2tan 1 2 Tmax 2 2 pf cos JE pxq “ p2f 1 pxqq ` p f pxqq ` p f pxqq ` p f pxqq 2 3 4 R2 2 Rth Rth X 2 R K t R2 s Kt R2 th ” ı ´ T,f l f ( x ) f (x) 2 pf 2 ´ Tstr 4 s p Rth ` R2 {(smf 3 q2 ` Tmax ) X2 p Rth ` R2 q `X
(11)
(12)
Kt
f 1 pxq “
Tf l
, f 2 pxq “
Kt b
ı ´ Tmax 2 R2th `XV ph X m
Tstr ´2
¯¯ X ´1 ´ pf X1X mcos tan 3VthRth `R2 {s Rth“ , Vth , K , X X 2 X th , X, thf f 3 pxq pxq “ 4 t s p f X1 X m Tmax pmXf1q X m X1 X m ”
2R1RXthm `
´
(12)
2 Vph Xm 3Vth R1 Xm X1 X m Rth “ , Vth “ , Xth “ , Kt “ , X “ X2 ` X X1 ` Xmof Equation X1 ` Xm it is alsoXnecessary ωs an additional thcondition, the In the minimization (11), to meet 1 ` Xm values of the calculated parameters must the following In the minimization of Equation (11),fulfill it is also necessaryrestriction: to meet an additional condition, the
values of the calculated parameters must fulfill the following restriction: p fl ( I12 R1 I 22R2 Prot )
p f l ´ pI12 R1 ` I22 R2 ` Prot q fl p fl “ ηfl pfl
(13) (13)
where p p fland andProtProt represents the rated power rotational losses, respectively. Furthermore, where represents the rated power and and rotational losses, respectively. Furthermore, ηfl fl the efficiency provided by the manufacturer. this restriction, the calculated fl symbolizes symbolizes the efficiency provided by the manufacturer. With thisWith restriction, the calculated efficiency isefficiency forced toisbeforced equalto to be theequal manufacturer efficiency, maintaining a balance between both. In general, to the manufacturer efficiency, maintaining a balance between both. the parameters p and P are calculated through two experimental tests known as No-load-test and rot fl In general, the parameters as p fl and Prot are calculated through two experimental tests known Blocked-rotor-test [23,24]. However, in order to maintain compatibility with similar works reported in No-load-test and Blocked-rotor-test [23,24]. However, in order to maintain compatibility with the literature, they were obtained from references [11–13]. similar works reported in the literature, they were obtained from references [11–13].
Figure Figure2.2.Exact Exactcircuit circuitmodel. model.
4.4. Experimental Results In In this thispaper, paper,the theGSA GSAisisused usedtotodetermine determinethe theoptimal optimalparameters parametersof oftwo twoinduction inductionmotors motors considering considering the the approximate approximate circuit model ((JJAA))and andexact exact circuit circuit model model (J ( JEE).).Table Table11presents presentsthe the technical of both motors usedused in thein experiments. The proposed method ismethod also evaluated technicalcharacteristics characteristics of both motors the experiments. The proposed is also
evaluated in comparison with other similar approaches based on evolutionary algorithms. In the experiments, we have applied the GSA estimator to the parameter identification of both induction motors, whereas its results are compared to those produced by ABC [20], DE [21], and PSO [22]. The parameter settings of all compared algorithms are obtained from their own referenced papers. The parameter setting for each algorithm in the comparison is described as follows:
Computers 2016, 5, 6
6 of 12
in comparison with other similar approaches based on evolutionary algorithms. In the experiments, we have applied the GSA estimator to the parameter identification of both induction motors, whereas its results are compared to those produced by ABC [20], DE [21], and PSO [22]. The parameter settings of all compared algorithms are obtained from their own referenced papers. The parameter setting for each algorithm in the comparison is described as follows: 1234-
PSO, parameters c1 “ 2, c2 “ 2 and weights factors were set wmax “ 0.9, and wmin “ 0.4 [22]. ABC, the parameters implemented were provided by [20], limit = 100. DE, in accordance with [21] the parameters were set pc “ 0.5 and f “ 0.5. GSA, the parameter were set according to [15].
Table 1. Manufacturer data of the motors used in the experiments.
Power (HP) Voltage (V) Current (A) Frequency (Hz) No. Poles Full load slip (s) Starting torque (Tstr ) Max. Torque (Tmax ) Stator current Full load torque (T f l )
Motor 1
Motor 2
5 400 8 50 4 0.07 15 42 22 25
40 400 45 50 4 0.09 260 370 180 190
The experimental results are divided into three sub-sections. In the first Section 4.1, the performance of the proposed algorithm is evaluated with regard to its own tuning parameters (sensibility analysis). In Section 4.2, an overall performance of the proposed method in comparison with similar approaches is provided. Finally, in Section 4.3, the results are statistically analyzed and validated by using the Wilcoxon test. 4.1. Performance Evaluation with Regard to Its Own Tuning Parameters In the GSA, the parameters G0 and α affect mainly its expected performance [R]. In this sub-section, the behavior of the GSA over the motor parameter estimation problem is analyzed considering different setting parameters. During the test, each parameter G0 and α is set to a default value such as G0 “ 100 and α “ 20. In the analysis, when one of the two parameters is evaluated, the other parameter remain fixed to the default value. To minimize the stochastic effect of the algorithm, each benchmark function is executed independently 30 times. As a termination criteria, the maximum number of iterations is considered, which has been set to 3000. In all simulations, the population size N has been configured to 25 individuals. In the first stage, the behavior of the proposed algorithm is analyzed considering different values for G0 . In the analysis, the values of G0 are varied from 80 to 120, whereas the values of α remains fixed at 10 and 30, respectively. In the simulation, the proposed method is executed independently 30 times for each value of G0 . The results obtained for the parameter combination of G0 and α are shown in Table 2. Such values represent the minimum, maximum, standard deviation, and mean values of JE (exact circuit model), considering the characteristics of Motor 1. The best results are marked in boldface. From Table 2, we can conclude that the proposed GSA with G0 “ 100 maintains the best performance. Then, in the second stage, the performance of the proposed algorithm is evaluated considering different values for α. In the experiment, the values of α are varied from 10 to 30 whereas the value of G0 remains fixed to 100. The statistical results obtained by the GSA using different values of α
Computers 2016, 5, 6
7 of 12
are presented in Table 3. Such values represent the minimum, maximum, standard deviation, and mean values of JE (exact circuit model), considering the characteristics of Motor 2. The best results are marked in boldface. From Table 3, it is evident that the proposed algorithm with α “ 20 outperforms the other parameter configurations. In general, the experimental results in Tables 2 and 3 suggest that a proper combination of different parameter values can improve the performance of the proposed method and the quality of the solutions. From the experiment, it can be concluded that the best parameter set is composed of the following values: G0 “ 100 and α “ 20. Once they have been determined experimentally, they are kept for all test functions through the following experiments. Table 2. Experimental results obtained by the proposed algorithm using different values of G0 .
Min Max Std Mean
G0 “ 80 α “ 20
G0 “ 90 α “ 20
G0 “ 100 α “ 20
G0 “ 110 α “ 20
G0 “ 120 α “ 20
0.0044 0.0119 0.0016 0.0052
0.0036 0.0103 0.0013 0.0040
0.0032 0.0032 0.0000 0.0032
0.0036 0.0082 0.0012 0.0042
0.0033 0.0088 0.0014 0.0039
Table 3. Experimental results obtained by the proposed algorithm using different values of α.
Min Max Std Mean
G0 “ 100 α “ 10
G0 “ 100 α “ 15
G0 “ 100 α “ 20
G0 “ 100 α “ 25
G0 “ 100 α “ 30
0.0093 0.0730 0.0147 0.0235
0.0093 0.0433 0.0085 0.0164
0.0071 0.0209 0.0043 0.0094
0.0093 0.0435 0.0094 0.0191
0.0092 0.0493 0.0109 0.0215
4.2. Induction Motor Parameter Identification In this experiment, the performance of the proposed GSA method is compared with DE, ABC, and PSO, considering the parameter estimation of both circuit models. In the test, all algorithms are operated with a population of 25 individuals (N = 25). The maximum iteration number for all methods has been set to 3000. This stop criterion has been selected to maintain compatibility to similar works reported in the literature [20–22]. All the experimental results presented in this section consider the analysis of 35 independent executions of each algorithm. Thus, the values of J A (approximate model), deviation standard, and mean obtained by each algorithm for Motor 1 are reported in Table 4, whereas the results produced by Motor 2 are shown in Table 5. On the other hand, the values of JE (exact model) for Motor 1 and Motor 2 are exhibited in Tables 6 and 7 respectively. The best results in all tables are marked in boldface. Table 4. Results of J A , considering Motor 1.
Min Max Mean Std
GSA
DE
ABC
PSO
3.4768ˆ10´22 1.6715ˆ10´20 5.4439ˆ10´21 4.1473ˆ10´21
1.9687ˆ10´15 0.0043 1.5408ˆ10´4 7.3369ˆ10´4
2.5701ˆ10´5 0.0126 0.0030 0.0024
1.07474ˆ10´4 0.0253 0.0075 0.0075
Computers 2016, 5, 6
8 of 12
Table 5. Results of J A , considering Motor 2.
Min Max Mean Std
GSA
DE
ABC
PSO
3.7189ˆ10´20
1.1369ˆ10´13
3.6127ˆ10´4
1.4020ˆ10´18 5.3373ˆ10´19 3.8914ˆ10´19
0.0067 4.5700ˆ10´4 0.0013
0.0251 0.0078 0.0055
0.0016 0.0829 0.0161 0.0165
Table 6. Results of JE , considering Motor 1.
Min Max Mean Std
GSA
DE
ABC
PSO
0.0032 0.0032 0.0032 0.0000
0.0172 0.0288 0.0192 0.0035
0.0172 0.0477 0.0231 0.0103
0.0174 0.0629 0.0330 0.0629
Table 7. Results of JE , considering Motor 2.
Min Max Mean Std
GSA
DE
ABC
PSO
0.0071 0.0209 0.0094 0.0043
0.0091 0.0305 0.0190 0.0057
0.0180 0.2720 0.0791 0.0572
0.0072 0.6721 0.0369 0.1108
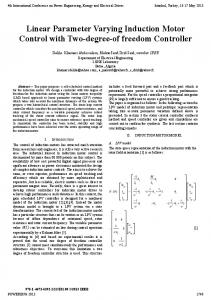
According to the results from Tables 4–7 the proposed approach provides a better performance than DE, ABC, and PSO in all tests. These differences are directly related to the better trade-off between exploration and exploitation of the GSA method. Once the motor parameters of all algorithms were estimated, their estimations ´ ¯ were compared with the ideal starting torque (Tstr ), maximum torque (Tmax ), and full load torque T f l values provided by the manufacturer in Table 1. The main objective of this comparison is to evaluate the accuracy of each approach with regard to the actual motor parameters. Tables 8 and 9 present the experimental results of JA for Motors 1 and 2, respectively. On the other hand, Tables 10 and 11 exhibit the comparative results of JE for Motors 1 and 2, respectively. The best results in all tables are marked in boldface. Since the convergence rate of evolutionary algorithms is an important characteristic to assess their performance for solving the optimization problems, the convergence of all algorithms facing functions J A and JE is compared in Figure 3a,b. The remarkable convergence rate of the proposed algorithm can be observed in both figures. According to these figures, it tends to find the global optimum faster than other algorithms. Finally, Figure 4 shows graphically the relation of the slip vs. torque for both models (J A and JE ) and for both Motors (1 and 2). Table 8. Comparison of GSA, DE, ABC, and PSO with manufacturer data, J A , for Motor 1.
Tst Tmax Tfl
True val
GSA
Error%
DE
Error%
ABC
Error%
PSO
Error%
15 42 25
15.00 42.00 25.00
0 0 0
14.9803 42.0568 24.9608
´0.131 0.135 ´0.156
14.3800 40.5726 25.0480
´4.133 ´3.398 0.192
15.4496 39.6603 25.7955
2.9973 ´5.570 3.182
Table 9. Comparison of GSA, DE, ABC, and PSO with manufacturer data, J A , for Motor 2.
Tst Tmax Tfl
True val
GSA
Error%
DE
Error%
ABC
Error%
PSO
Error%
260 370 190
260.00 370.00 190.00
0 0 0
258.4709 372.7692 189.0508
´0.588 0.7484 ´0.499
260.6362 375.0662 204.1499
0.2446 1.3692 7.447
288.9052 343.5384 196.1172
11.117 ´7.151 3.2195
Table 9. Comparison of GSA, DE, ABC, and PSO with manufacturer data, J A , for Motor 2.
True val Tst 260val True Tmax 370 Tst 260 Tfl Computers 1902016, 5, Tmax 370 Tfl
190
GSA 260.00 GSA 370.00 260.00 190.00 6370.00
Error% 0 Error% 0 0
DE 258.4709 DE 372.7692 258.4709 189.0508 372.7692
Error% −0.588 Error% 0.7484 −0.588 −0.499 0.7484
ABC 260.6362 ABC 375.0662 260.6362 204.1499 375.0662
Error% 0.2446 Error% 1.3692 0.2446 7.447 1.3692
PSO 288.9052 PSO 343.5384 288.9052 196.1172 343.5384
Error% 11.117 Error% −7.151 11.117 3.2195 9 of 12 −7.151
190.00
0
189.0508
−0.499
204.1499
7.447
196.1172
3.2195
Table 10. Comparison of GSA, DE, ABC, and PSO with manufacturer data, J E , for Motor 1. Table 10. Comparison of GSA, DE, ABC, and PSO with manufacturer data, JE , for Motor 1.
Table 10. Comparison of GSA, DE, ABC, and PSO with manufacturer data, J E , for Motor 1.
True val GSA Error% True val GSA Error% Tst 15 14.9470 −0.353 True val GSA Error% Tst 14.9470 ´0.353 Tmax 42 15 42.00 0 0 Tst Tmax15 42 14.9470 42.00 −0.353 Tfl 25 25.0660 0.264 25.0660 Tmax Tfl 42 25 42.00 00.264 Tfl 25 25.0660 0.264
DE Error% DE Error% 15.4089 2.726 DE Error% 15.4089 2.726 42.00 00 15.4089 2.726 42.00 26.0829 4.3316 26.0829 4.3316 42.00 0 26.0829 4.3316
ABC ABC 16.4193 ABC 16.4193 42.00 16.4193 42.00 25.3395 25.3395 42.00 25.3395
Error% PSO Error% PSO Error% 9.462 15.6462 4.308 Error% PSO Error% 9.462 15.6462 4.308 0 42.00 0 9.462 15.6462 0 42.00 04.308 1.358 26.6197 6.4788 1.358 26.6197 0 42.00 6.47880 1.358 26.6197 6.4788
Error%
TableTable 11. Comparison of GSA, DE, DE, ABC, andand PSOPSO with manufacturer data, for Motor Motor2.2. 11. Comparison of GSA, ABC, with manufacturer data,JJEE ,, for Table 11. Comparison of GSA, DE, ABC, and PSO with manufacturer data, J E , for Motor 2.
Tst Tmax Tst Tfl Tmax Tfl
True valTrue val GSA GSAError% Error% DE DE 260val 260 258.1583 −0.708 True GSA258.1583 Error% DE Tst ´0.708262.0565 262.0565 Tmax 370 370.00 0 370.00 370 370.00 0 370.00 260 258.1583 −0.708 262.0565 Tfl 190 189.8841 ´0.061 192.2916 190 189.8841 −0.061 192.2916 370 370.00 0 370.00 190
189.8841
−0.061
192.2916
Error% Error% 0.7909 Error% 0.7909 00 0.7909 1.2061 1.2061 0 1.2061
ABC Error% PSO PSO Error% Error% ABC Error% 246.2137 −5.302 281.8977 281.8977 8.4221 ABC Error% PSO 8.4221 Error% 246.2137 ´5.302 370.00 0 370.00 0 370.00 0 370.00 0 246.2137 −5.302 281.8977 8.4221 207.9139 9.428 166.6764 ´12.27 207.9139 9.428 166.6764 −12.27 370.00 0 370.00 0 207.9139 9.428 166.6764 −12.27
(a)
(b)
(a) evolution through iterations: (a) Model 1( J ); (b) (b) Figure 3. Convergence J E ).). Figure 3. Convergence evolution through iterations: (a) Model 1 A(J ); (b)Model Model22( (J E
A
Figure 3. Convergence evolution through iterations: (a) Model 1( J A ); (b) Model 2 ( J E ).
(a)
(b)
(a) via PSO, ABC, DE, and GSA considering Model 1(b) Figure 4. Curve slip vs. torque ( J A ), Model 2 ( J E ), Figure 4. Curve vs. torque (a) Motor 1, and slip (b) Motor 2. via PSO, ABC, DE, and GSA considering Model 1 ( J A ), Model 2 ( J E ),
Figure 4. Curve slip vs. torque via PSO, ABC, DE, and GSA considering Model 1 (J A ), Model 2 (JE ),
(a) Motor 1, and 2. 2. (a) Motor 1, (b) andMotor (b) Motor
10/13 10/13
Computers 2016, 5, 6
10 of 12
4.3. Statistical Analysis To statistically analyze the results, a non-parametric test known as Wilcoxon analysis [25] was conducted. It permits the evaluation of the differences between two related methods. The test is performed in a 5% significance level over the mean fitness values of J A and JE , considering Motors 1 and 2. Table 12 reports the p-values generated by Wilcoxon analysis for the pair-wise comparison among the algorithms. Under such conditions, three groups are produced: GSA vs. DE, GSA vs. ABC, and GSA vs. PSO. In the Wilcoxon test, it is assumed as a null hypothesis that there is no significant difference between the two algorithms. On the other hand, it is considered as an alternative hypothesis that there is a significant difference between both approaches. An inspection of Table 12 demonstrates that all p-values in the Table 12 are less than 0.05 (5% significance level). This fact provides strong evidence against the null hypothesis, indicating that the proposed method statistically presents better results than the other algorithms. Table 12. p-values produced by Wilcoxon test comparing GSA vs. DE, GSA vs. ABC, and GSA vs. PSO over the mean fitness values of J A and JB considering the Motors 1 and 2 from Tables 4–7. GSA vs.
DE
ABC
PSO
J A , Motor 1 J A , Motor 2 JE , Motor 1 JE , Motor 2
6.545500588914223ˆ10´13
6.545500588914223ˆ10´13
0.009117078811112 6.545500588914223ˆ10´13 1.612798082388261ˆ10´9
0.036545600995029 6.545500588914223ˆ10´13 9.465531545379272ˆ10´13
6.545500588914223ˆ10´13 0.004643055264741 6.545500588914223ˆ10´13 3.483016312301559ˆ10´8
5. Conclusions In this paper, an algorithm for the optimal parameter identification of induction motors has been presented. In the proposed method, the parameter estimation process is transformed into a multidimensional optimization problem where the internal parameters of the induction motor are considered as decision variables. Under this approach, the complexity of the optimization problem tends to produce multimodal error surfaces for which their cost functions are significantly difficult to minimize. To determine the parameters, the proposed method uses a relatively recent evolutionary method called the gravitational search algorithm (GSA). Different from most of the existent evolutionary algorithms, the GSA presents a better performance in multimodal problems, avoiding critical flaws such as the premature convergence to sub-optimal solutions. To illustrate the proficiency and robustness of the proposed approach, the GSA estimator has been experimentally evaluated considering two different motor models. To assess the performance of the proposed algorithm, it has been compared to other similar evolutionary approaches such as differential evolution (DE), ABC, and PSO. The experiments, statistically validated, have demonstrated that the proposed method outperforms the other techniques in most experiments in terms of solution quality. Acknowledgments: The present research has been supported under the Grant CONACYT CB 181053. The first and third author acknowledges to CONACYT of Mexico for its support under the scholarships 295970 and 295993, respectively. Author Contributions: Omar Avalos conceived and designed the experiments; Erik Cuevas and Jorge Galvez performed the experiments; Omar Avalos and Erik Cuevas analyzed the data; Omar Avalos, Erik Cuevas and Jorge Galvez wrote the paper. All authors have read and approved the final manuscript. Conflicts of Interest: The authors declare no conflict of interest.
Computers 2016, 5, 6
11 of 12
References 1. 2.
3. 4. 5. 6. 7. 8.
9. 10. 11.
12. 13. 14. 15. 16. 17. 18. 19. 20. 21.
22. 23.
Çali¸s, H.; Çakir, A.; Dandil, E. Artificial immunity-based induction motor bearing fault diagnosis. Turk. J. Electr. Eng. Comput. Sci. 2013, 21, 1–25. Prakash, V.; Baskar, S.; Sivakumar, S.; Krishna, K.S. A novel efficiency improvement measure in three-phase induction motors, its conservation potential and economic analysis. Energy Sustain. Dev. 2008, 12, 78–87. [CrossRef] Waters, S.S.; Willoughby, R.D. Modeling Induction Motors for System Studies. IEEE Trans. Ind. Appl. 1983, 5, 875–878. [CrossRef] Ansuj, S.; Shokooh, F.; Schinzinger, R. Parameter estimation for induction machines based on sensitivity analysis. IEEE Trans. Ind. Appl. 1989, 25, 1035–1040. [CrossRef] De Kock, J.; Van der Merwe, F.; Vermeulen, H. Induction motor parameter estimation through an output error technique. IEEE Trans. Energy Convers. 1994, 9, 69–76. [CrossRef] Kumar, V.; Chhabra, J.K.; Kumar, D. Automatic cluster evolution using gravitational search algorithm and its application on image segmentation. Eng. Appl. Artif. Intell. 2014, 29, 93–103. [CrossRef] Bishop, R.R.; Richards, G.G. Identifying induction machine parameters using a genetic optimization algorithm. In Proceedings of the IEEE Southeastcon 1 90, New Orleans, LA, USA, 1–4 April 1990; pp. 476–479. Emara, H.M.; Elshamy, W.; Bahgat, A. Parameter identification of induction motor using modified Particle Swarm Optimization algorithm. In Proceedings of the 2008 IEEE International Symposium on Industrial Electronics, Cambridge, UK, 30 June–2 July 2008; pp. 841–847. Sakthivel, V.P.; Bhuvaneswari, R.; Subramanian, S. An Improved Particle Swarm Optimization for Induction Motor Parameter Determination. Int. J. Comput. Appl. 2010, 1, 71–76. [CrossRef] Sakthivel, V.P.; Bhuvaneswari, R.; Subramanian, S. Artificial immune system for parameter estimation of induction motor. Expert Syst. Appl. 2010, 37, 6109–6115. [CrossRef] Sakthivel, V.P.; Bhuvaneswari, R.; Subramanian, S. An accurate and economical approach for induction motor field efficiency estimation using bacterial foraging algorithm. Meas. J. Int. Meas. Confed. 2011, 44, 674–684. [CrossRef] Perez, I.; Gomez-Gonzalez, M.; Jurado, F. Estimation of induction motor parameters using shuffled frog-leaping algorithm. Electr. Eng. 2013, 95, 267–275. [CrossRef] Mohammadi, H.R.; Akhavan, A. Parameter Estimation of Three-Phase Induction Motor Using Hybrid of Genetic Algorithm and Particle Swarm Optimization. J. Eng. 2014, 2014. [CrossRef] Abro, A.G.; Mohamad-Saleh, J. Multiple-global-best guided artificial bee colony algorithm for induction motor parameter estimation. Turk. J. Electr. Eng. Comput. Sci. 2014, 22, 620–636. [CrossRef] Rashedi, E.; Nezamabadi-pour, H.; Saryazdi, S. GSA: A Gravitational Search Algorithm. Inf. Sci. 2009, 179, 2232–2248. [CrossRef] Farivar, F.; Shoorehdeli, M.A. Stability analysis of particle dynamics in gravitational search optimization algorithm. Inf. Sci. 2016, 337, 25–43. [CrossRef] Yazdani, S.; Nezamabadi-Pour, H.; Kamyab, S. A gravitational search algorithm for multimodal optimization. Swarm Evol. Comput. 2014, 14, 1–14. [CrossRef] Yazdani, A.; Jayabarathi, T.; Ramesh, V.; Raghunathan, T. Combined heat and power economic dispatch problem using firefly algorithm. Front. Energy 2013, 7, 133–139. [CrossRef] Zhang, W.; Niu, P.; Li, G.; Li, P. Forecasting of turbine heat rate with online least squares support vector machine based on gravitational search algorithm. Knowledge-Based Syst. 2013, 39, 34–44. [CrossRef] Jamadi, M.; Merrikh-bayat, F. New Method for Accurate Parameter Estimation of Induction Motors Based on Artificial Bee Colony Algorithm. 2014, arXiv: 1402.4423. Ursem, R.K.; Vadstrup, P. Parameter identification of induction motors using differential evolution. In Proceedings of the 2003 Congress on Evolutionary Computation, CEC ’03, Canberra, Australia, 8–12 December 2003; pp. 790–796. Sakthivel, V.P.; Subramanian, S. On-site efficiency evaluation of three-phase induction motor based on particle swarm optimization. Energy 2011, 36, 1713–1720. [CrossRef] Jurkovic, S. Induction Motor Parameters Extraction. Available online: http://web.mit.edu/kirtley/ binlustuff/literature/electric%20machine/motor-parameters.pdf (accessed on 25 April 2016).
Computers 2016, 5, 6
24. 25.
12 of 12
Krishnan, R. Electric Motor Drives Modeling, Analysis, and Control; Prentice Hall: Upper Saddle River, NJ, USA, 2001. Kotz, S., Johnson, N.L. (Eds.) Breakthroughs in Statistics: Methodology and Distribution; Springer: New York, NY, USA, 1992; pp. 196–202. © 2016 by the authors; licensee MDPI, Basel, Switzerland. This article is an open access article distributed under the terms and conditions of the Creative Commons Attribution (CC-BY) license (http://creativecommons.org/licenses/by/4.0/).