Interactive Outlier Exploration in Big Data Streams Lei Cao, Qingyang Wang, and Elke A. Rundensteiner Worcester Polytechnic Institute, Worcester, MA USA (lcao,wangqy,rundenst)@cs.wpi.edu
ABSTRACT We demonstrate our VSOutlier system for supporting interactive exploration of outliers in big data streams. VSOutlier not only supports a rich variety of outlier types supported by innovative and efficient outlier detection strategies, but also provides a rich set of interactive interfaces to explore outliers in real time. Using the stock transactions dataset from the US stock market and the moving objects dataset from MITRE, we demonstrate that the VSOutlier system enables analysts to more efficiently identify, understand, and respond to phenomena of interest in near real-time even when applied to high volume streams.
1.
INTRODUCTION
In recent years as the volume and velocity of data streams advance to new levels, the discovery of precious knowledge from this big data has become more critical than ever before. Often important insights extractable from stream data sources correspond to “abnormal phenomena”. Many modern applications, including credit card fraud detection, network intrusion prevention, and stock investment tactical planning, rely on efficiently finding abnormal phenomena in such big data streams. For example, when seeking short-term investment opportunities in the stock market, investors may look for the outlier stocks whose behavior significantly differs from that of the majority of their peer stocks. Such abnormal stocks may be either hot spots or forgotten treasure in the market. To facilitate analysts to find and interpret the outliers hidden in big data streams, several major challenges have to be conquered. First, although a number of outlier definitions such as distancebased outlier [9, 14], density-based outlier [4, 13], angle-based outlier [11] and so on, have emerged in the literature that all aim to isolate abnormal events from normal events, no single outlier definition can effectively model all real world scenarios. Each of the definitions has respective strength in capturing outliers with some particular properties while not being suitable for other scenarios. Obviously designing one designated system for each single particular application is not economically feasible. A general platform that can support a broad range of outlier types is indispensable to
This work is licensed under the Creative Commons AttributionNonCommercial-NoDerivs 3.0 Unported License. To view a copy of this license, visit http://creativecommons.org/licenses/by-nc-nd/3.0/. Obtain permission prior to any use beyond those covered by the license. Contact copyright holder by emailing
[email protected]. Articles from this volume were invited to present their results at the 40th International Conference on Very Large Data Bases, September 1st - 5th 2014, Hangzhou, China. Proceedings of the VLDB Endowment, Vol. 7, No. 13 Copyright 2014 VLDB Endowment 2150-8097/14/08.
satisfy these diverse requirements. However most previously presented stream outlier detection systems [7] only focus on one particular type of outlier, namely the distance-threshold outlier [9]. To the best of our knowledge no existing system supports the effective discovery of a rich variety of diverse yet common outlier types in big data streams. Second, advanced computational methods have to be designed to continuously discover stream outliers in real-time. Although in [7] several distance-threshold outlier detection algorithms [1, 10] have been demonstrated, they cannot handle big data streams in realtime due to the expense of the exhaustive neighborhood searches that they rely on to locate outliers. Yet such big data streams are increasingly common in modern streaming applications. As an example the US stocks market continuously receives around 1M transaction requests per second [12]. Worst yet, no effective technique has been proposed to support other typical outlier types such as kNN outliers [14, 2], LOCI [13], or ABOD [11] in the streaming context. Third, it is imperative to design an effective visual interactive support system to enable analysts to directly interact with the outlier detection processes. First analysts often do not have enough priori knowledge about the characteristics of the continuously arriving streaming data to be able to choose an outlier detection technique that best fits their need beforehand. Second the characteristics of the input stream might significantly change during the outlier detection process. Therefore analysts may need to interactively adjust the parameter settings or even switch to other techniques to keep the outlier detection process optimally tuned. Clearly an effective visual display is needed for analysts to make sense of the identified candidates and hence make informed decision. Unfortunately state-of-the-art stream outlier detection systems [7] have paid little attention to tackle the question of what an effective visual interface may entail to support analysts in their exploration of outliers. In this demonstration, we present our VSOutlier system that overcomes the above challenges by offering both real-time responsiveness as well as interactive outlier exploration in big data streams. In particular we make the following contributions: 1) We design the VSOutlier system which is the first to support a rich variety of common outlier types in an efficient and integrated system. Furthermore all the detection algorithms are developed based on one key novel outlier detection optimization strategy [5]. We demonstrate that our algorithms outperform the state-of-the-art techniques 2 to 3 orders of magnitude in response time, finally rendering online outlier detection practical in big data stream. 2) We provide interfaces to allow analysts to visually select any outlier type they wish to work with by only “one click” and dynamically adjust parameter settings of queries at run time. The detected outliers as well as their key characteristics and evolution
1621
over time are displayed through effective visual interfaces. Furthermore we design comparison views which enable the users to contrast and correlate the outlier output detected by distinct outlier queries with diverse parameter settings. We also design the runtime performance monitoring view that provides the analysts the key metrics related to the efficiency of any outlier detection algorithm.
2.
Front End
example in distance-threshold outlier definition [9] outliers are defined as data points with fewer than k neighbors in the database, where a neighbor is a data point that is within a distance R. In the processing of identifying distance-threshold outlierS until finding that pi has at least k neighbors and thus qualifies as inlier, pi cannot be safely removed from the outlier candidate set. We use the concept of minimal evidence to describe the least amount of information needed to prove pi ’s inlier status. The size of minimal evidence set for a point pi is usually much smaller than the size of pi ’s complete neighborhood. For example for distance-threshold outlierS, the minimal evidence for any point pi is composed any k points that are within R range from pi . For other outlier types, such as kNN outlier [14] where outliers are the n data points with the highest distance values to their respective kth nearest neighbor among all data points in the database, the cardinality of the minimal evidence for a point pi is also bounded by a constant value k [5]. This observation leads us to an important optimization. That is, to identify whether a point pi is an outlier in a dataset D, one may not need the distance between pi to every other point in D. Therefore the state-of-the-art techniques [1, 16, 10] which rely on complete neighborhood searches to determine the status (outlier or inlier) of each data point are not efficient. Instead, searching through a small subset of points can be sufficient to obtain the minimal evidence and thus prove that pi is an inlier. Due to the rarity of outliers, the majority of points in the dataset could be labeled as inliers in this way. Therefore we present an optimization principle referred to as minimal probing. The key idea of minimal probing is to replace the complete neighborhood searches, such as range query searches, with a lightweight operation called probing. The goal of probing for a point pi is the discovery of the minimal evidence for pi in the current window rather than its complete neighbor set. Probing is fundamentally more efficient compared to a complete neighborhood search as demonstrated in [5] by both a theoretical proof and a through experimental evaluation for several real data streams, since it significantly reduces the number of data points that need to be evaluated.
ARCHITECTURE OF VSOUTLIER
Visual Engine
Visual Engine
Visual Engine
VSOutlier
Task Manager Workbench
Deviation Based
Angle Based
Data Grabber
Distance Based
Density Based
Data Dispatcher
Source Wrapper
Source Wrapper
Back End Streaming Data
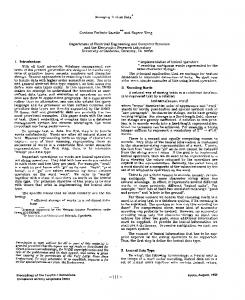
Figure 1: VSOutlier System architecture As depicted in Figure 1 the VSOutlier is composed of three key components: visualizer, workbench, and data grabber. At the front end our VSOutlier visualizer supports visual stream outlier analytics. It allows the analysts to submit mining requests and navigate through responses in a visual manner. The requests are passed to the workbench for efficiently detecting different types of outlier. The workbench is composed of numerous mining modules, each corresponding to a particular outlier type. Key optimization principles are applied in these mining modules to minimize the CPU and memory consumption. The data grabber wraps and integrates data sources from live streams and feed them to miner.
3.
3.2
THE EFFICIENT OUTLIER WORKBENCH
The detection algorithms supported in the outlier mining workbench all leveraged our novel outlier detection strategy called LifEspanAware Probing, or in short LEAP. LEAP is capable of continuously detecting outliers in sliding window streams with low CPU and memory resource utilization. LEAP is built on two fundamental optimization principles namely minimal probing and lifespan-aware prioritization as described below.
3.1
Minimal Probing Optimization
Given a dataset D the points in D are classified either as outliers or inliers. Thus, the process of identifying outliers in D is equivalent to the process of eliminating inliers from it. In fact, initially, each point pi in the dataset is a potential outlier candidate, until one has acquired enough evidence to show that pi is an inlier. For
Lifespan-Aware Prioritization Optimization
In this work we apply the periodic sliding window semantics as proposed by CQL [3] to define substreams of interest from the otherwise infinite data stream. The substream of interest, namely the current window Wc , periodically slides along the stream. All data points will thus eventually be purged from the current window. Therefore although the minimal evidence may be sufficient to prove a point’s inlier status in the current window, it will not necessarily remain sufficient in the next window if some of its elements expire. Intuitively unlike in static environments, locating more evidence beyond just the minimal evidence for a given point may thus be beneficial in streaming environments. This additional evidence may help us to determine the status of this point in future windows. However this solution could potentially break the principle of minimal probing, namely to stop immediately once acquired this minimal evidence, making the lightweight probing operation cumbersome again. Next we introduce the second optimization principle for our probing process that successfully tackles these conflicting requirements. This principle enables probing to always acquire the best minimal evidence, namely the minimal evidence that will not expire earlier than any other possible minimal evidence yet without sacrificing its efficiency. On the one hand, the probing process for pi should ac-
1622
Figure 2: VSOutlier visual interfaces
Figure 3: Juxtaposed view quire the best minimal evidence of pi . On the other hand, we want the probing process to stay lightweight, so that it stops immediately once it has gotten the minimal evidence of pi in the current window. Our solution, termed lifespan-aware prioritization, is to prioritize the order in which the probing operation processes the data points. More specifically, given a point pi in Wc , the lifespan-aware prioritization principle guides the probing operation to evaluate the status of pi by always testing the later arriving data points first. The specified probing operation augmented with the lifespan-aware prioritization principle is named LEAP. This principle utilizes the insight that the data points that arrived later in the window are guaranteed to have a more decisive impact on the outlier detection process compared to earlier ones. This is so because the younger a data point pi is, the longer its neighbor relationships (if any) with other points will persist into the future. Therefore LEAP is guaranteed to produce the best minimal evidence. Furthermore LEAP stops immediately as soon as a minimal evidence is acquired. Thus it remains lightweight.
4.
INTERACTIVE VISUAL EXPLORATION OF OUTLIERS
VSOutlier provides one visualizer for each analyst to explore stream outliers. In general it includes five different types of views classified by their function. The outlier view. For a single outlier detection query, this outlier view not only displays the detected outliers, but also their evolution information over time. As shown in Figure 2 users can toggle if to display all data points or the outliers only with each outlier depicted by a colored dot. The most important characteristic of an outlier, such as the count and the distribution of its neighbors for distance-threshold outlier and the kNN neighbors for kNN outlier, is also displayed if the user chooses the zoom in function. Along the time horizon, a sequence of these outlier views corresponding to adjacent windows are organized together to convey the progression and stability of outlier states over time. Our visual display helps users to pinpoint the root cause of the status migration for a given outlier as shown in Figure 4. For ex-
1623
Window 122
9
Window 123
9 8
8
7
7
7
6
6
6
5
5
5
4
4
4
3
3
3
2
2
2
1
1
0
1
2
3
4
5
6
7
8
0
Window 124
9
8
1 1
2
3
4
5
6
7
8
0
1
2
3
4
5
6
7
8
Figure 4: Outlier status migration
ample given a distance-threshold outlier we use color to convey the arrival of its new neighbors and expiration of old neighbors. More specifically we use gray dots to represent the neighbors it is losing and blue dots to indicate the new neighbors it is gaining in each window. The query view. V SOutlier allows analysts to chose the particular type of outliers they aim to detect from a pull-down menu. Users can activate or remove any outlier detection query at run time. Multiple outlier types can be supported simultaneously as shown in Figure 2. Furthermore users are given the option to dynamically adjust the parameter settings of any active outlier detection query, such as the parameters k and R of distance-threshold outlier, the parameters n and k of kNN outlier, and the parameters α and r of LOCI, and so on. The comparison view. Our comparison views empower analysts to compare and contrast the outlier output detected by distinct queries with different parameter settings and even different outlier types. This can help users to determine the proper outlier type and its corresponding parameter setting for the current streaming data. V SOutlier provides two visualization mechanisms, namely “juxtaposed” and “integrated” visualization [15] for the comparison view. In the juxtaposed visualization, the outliers detected by different queries are visualized separately as shown in Figure 3. The key advantage of this technique is that it minimizes the interference between the visualization of different queries. The integrated display visualizes the outliers detected by different queries in an integrated view, and thus more explicitly shows their commonalities and differences in a single display. For a group of outlier detection queries QG, V SOutlier adopts a color coding to display and distinct the outliers identified by different queries in QG (Figure 2. Data points in the red color are identified as outliers by query Q1 , while the green ones are those identified by query Q2. The pink colored dots represents the outliers recognized by both Q1 and Q2 . The monitoring view. Our runtime performance monitoring interface enables analysts to monitor the key metrics related to the efficiency of any outlier detection algorithm, such as the number of outlier produced, the number of input consumed, the peak memory utilized, the processing time per tuple, etc..
5.
VSOUTLIER DEMONSTRATION
We will demonstrate the novel features of VSOutlier based on two scenarios of detecting outliers in the STT data recording stock transactions from NYSE [8] and the GMTI data recording information of moving objects [6]. Through this demonstration, the audience will experience the impact of utilizing V SOutlier technique for the exploration of outliers in data streams. 1) demonstration of the power of the VSOutlier system for simultaneously supporting the detection of various outlier types and
the dynamic adjustment of the parameter setting. This empowers analysts to explore the cutting-edge outlier detection approaches to mine abnormal phenomena from big data streams while adapting to highly dynamic stream environments. 2) the visual view displaying the detected outliers, including abnormal transaction records in NYSE stock trades and isolated moving objects in the GMTI stream and their evolution over time (Section 4). The audience will be able to not only observe the outliers in each window, but also track how they evolve (appear,disappear). 3) demonstration of the strengths of the comparison views for displaying the outliers detected by various outlier types with different parameter settings (Section 4). The audience will be able to compare and contrast these outliers detected. This effectively guides the analysts to determine what outlier type and parameter settings are proper for the given context. 4) demonstrate of our runtime performance monitoring view by contrasting our LEAP strategy-based distance-threshold outlier algorithm against the alternative methods in [10]. This demonstration confirms the 2 to 3 orders of magnitude performance gain of LEAP strategy in response time (Section 3).
6.
CONCLUSION
We demonstrate that our VSOutlier system that provides a rich experience to data analysts through visual display of outliers and dynamic parameter adjustment. The performance of both our LEAP strategy and the state-of-the-art algorithms can also be compared using our monitoring interface.
7.
ACKNOWLEDGEMENTS
This project is supported by NSF grants IIS-1018443 and IIS0917017.
8.[1] F.REFERENCES Angiulli and F. Fassetti. Distance-based outlier queries in data streams: the novel task and algorithms. Data Min. Knowl. Discov., 20(2):290–324, 2010. [2] F. Angiulli and C. Pizzuti. Fast outlier detection in high dimensional spaces. In PKDD, pages 15–26, 2002. [3] A. Arasu, S. Babu, and J. Widom. The cql continuous query language. VLDB J., 15(2):121–142, 2006. [4] M. M. Breunig, H.-P. Kriegel, R. T. Ng, and J. Sander. Lof: Identifying density-based local outliers. In SIGMOD Conference, pages 93–104, 2000. [5] L. Cao, D. Yang, Q. Wang, Y. Yu, J. Wang, and E. A. Rundensteiner. Scalable distance-based outlier detection over high-volume data streams. In ICDE, 2014. [6] J. Entzminger, J.N., C. Fowler, and W. Kenneally. Jointstars and gmti: past, present and future. Aerospace and Electronic Systems, IEEE Transactions on, 35(2):748 –761, Apr. 1999. [7] D. Georgiadis, M. Kontaki, A. Gounaris, A. N. Papadopoulos, K. Tsichlas, and Y. Manolopoulos. Continuous outlier detection in data streams: an extensible framework and state-of-the-art algorithms. In SIGMOD Conference, pages 1061–1064, 2013. [8] I. INETATS. Stock trade traces. http://www.inetats.com/. [9] E. M. Knorr and R. T. Ng. Algorithms for mining distance-based outliers in large datasets. In VLDB, pages 392–403, 1998. [10] M. Kontaki, A. Gounaris, A. N. Papadopoulos, K. Tsichlas, and Y. Manolopoulos. Continuous monitoring of distance-based outliers over data streams. In ICDE, pages 135–146, 2011. [11] H.-P. Kriegel, M. Schubert, and A. Zimek. Angle-based outlier detection in high-dimensional data. In KDD, pages 444–452, 2008. [12] A. Nazaruk and M. Rauchman. Big data in capital markets. In SIGMOD Conference, pages 917–918, 2013. [13] S. Papadimitriou, H. Kitagawa, P. B. Gibbons, and C. Faloutsos. Loci: Fast outlier detection using the local correlation integral. In ICDE, pages 315–326, 2003. [14] S. Ramaswamy, R. Rastogi, and K. Shim. Efficient algorithms for mining outliers from large data sets. In SIGMOD Conference, pages 427–438, 2000. [15] Z. Xie, S. Huang, M. O. Ward, and E. A. Rundensteiner. Exploratory visualization of multivariate data with variable quality. In IEEE VAST, pages 183–190, 2006. [16] D. Yang, E. Rundensteiner, and M. Ward. Neighbor-based pattern detection over streaming data. In EDBT, pages 529–540, 2009.
1624