Xufei Yang, L.-W. Antony Chen, Gustavo M. Riggio, Reddy L. N. Yatavelli, Xiaoliang Wang, Jerome A. Robles,John G. Watson, Judith C. Chow. Desert Research ...
Aerosol Analysis Using a Thermal-Desorption Mass Spectrometer (TD-MS) Coupled to a Conventional Carbon Analyzer Xufei Yang, L.-W. Antony Chen, Gustavo M. Riggio, Reddy L. N. Yatavelli, Xiaoliang Wang, Jerome A. Robles, John G. Watson, Judith C. Chow. Desert Research Institute, Reno, Nevada
Introduction
Preliminary Results
Thermal/optical carbon analyzers have been used for organic carbon/elemental carbon (OC/EC) analysis for the long-term nonurban IMPROVE and urban chemical speciation networks.
Comparison with AMS spectra (>40 compounds tested)
Source apportionment receptor modeling: A case study with on-road aerosols in Los Angeles A PM2.5 sample was collected at a freeway loop along major truck routes on 07/09/2001, with a total carbon (TC) of 55.2 µg/m3. Source apportionment is performed with an effective-variance chemical mass balance (EV-CMB) model.
Efforts are being made to modify the chemical analysis and optical modules of the DRI Model 2001 carbon analyzer to acquire more information from a single quartzfiber filter punch.
TC + MS spectra1
Integrating thermal-desorption mass spectrometry (TD-MS) with carbon analysis allows one to fingerprint the chemical composition of aerosols. NIST
Relative Intensity
System Setup
Relative Intensity
Relative Intensity
NIST NIST
NIST
Source
Profile
I
Gasoline
Low emitter High emitter
-4.2 ± 1.7
Diesel
Heavy duty
68.3 ± 17.3
Biomass burning
Moist wood
A pyrolysis tube (650ºC) breaks large organic molecules into small fragments, thereby reducing the loss of analytes due to condensation.
OC, EC and inorganics2
II
III
IV
V
8.5 ± 2.4
11.6 ± 3.2
31.9 ± 8.9
Organics3
VI
VII
30.4 ± 8.5
18.7 ± 20.3
23.4 ± 5.9
33.6 ± 8.7
78.0 ± 31.4 39.9 ± 10.1
42.1 ± 10.7
29.3 ± 7.4
51.8 ± 13.1
-3.5 ± 1.0
10.6 ± 5.5
r2
0.70
0.82
0.84
0.56
0.35
0.56
0.98
χ2
0.96
0.88
0.68
5.53
5.55
5.53
0.28
%TC
116.1
87.4
90.8
110.8
235.1
116.7
94.6
Using total carbon and mass spectra acquired from TD-MS analysis. 2 Using OC, EC and major ions (SO 2-, NO -, K+, Cl-, etc.) and elements. 4 3 3 Using 2) plus organic markers (Fujita et al., 2007) . 1
The products are then monitored using an electron-ionization (EI) quadrupole mass spectrometer.
flash vaporization
Gasoline vehicle emission
Ambient
Relative Intensity
temperature ramping
NIST
Diesel vehicle emission
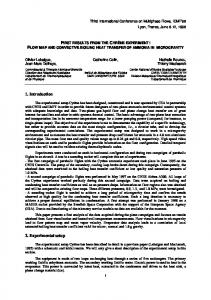
Figure 1. TD-MS system: (left) working principle and (right) experimental setup.
The TD-MS in general generates similar MS spectra to the thermal vaporization AMS. Different spectra of the same compound are possibly caused by differences in heating rate, particle collection medium, and operating atmosphere.
Mass range: m/z=10-450; scan rate: 0.8 scans per second.
Negative O2+ peak and high CO+ and CO2+ yields suggest some organics were oxidized by trace O2 (~10 ppm) in the He carrier gas.
Potential applications in quantitative analysis Standard compounds are atomized and collected on prefired quartz-fiber filters. Aerosol loadings are determined with regular carbon analyzer (for organics) or ion chromatography (for salts).
OC
10
44 28
1
64 76
0.1
0.01
Trials using TD/MS spectra show reasonable source apportionment of TC and OC into diesel and gasoline vehicle emissions, even without conventional organic markers such as PAHs. Such apportionment cannot usually be achieved by inorganic species alone.
48
30
58
0.001
0.001
0.01
0.1
1
CMB modeling with various species/source combinations is conducted for ambient PM2.5 samples dominated by mobile exhausts.
10
100
Ion peaks are fitted well, with exception of 48 and 64 that correspond to sulfate from non-mobile sources.
Summary and future work
Measures to suppress such oxidation include (1) installing an upstream O2 scrubber; (2) increasing filter oven pressure; and (3) reducing the number of temperature steps.
Figure 3. (left) dependence of O2 levels on oven pressure; (right) a modified program with three temperature steps
TC
Figure 7. Model fits in Trial II.
thermogram and (right) mass spectra.
Figure 5. Response of the TD-MS at different aerosol loadings. 7
1
Ambient Biomass
5
Diesel Gasoline
4 3
y = 429.89x + 0.05 R² = 0.98
2 1
Nitrate (µg)
6
Nitrate (NO3-) Measured by IC (µg)
Sulfate (µg)
Sulfate (SO4=) Measured by IC (µg)
A sheath gas system is being built to further minimize O2 intrusion.
EC
Measured Peak Strength in Ambient Samples
This issue is particularly serious for lightly loaded Figure 2. TD-MS analysis of an Fresno ambient sample (left) filter samples.
Charring is corrected by reflectance and transmittance at 635 nm.
100
0.0001 0.0001
Most oxidation occurs at OC3 and OC4.
Steps 1 and 2 are summed for most data analyses.
Figure 6. TD-MS spectra of source and ambient samples.
CMB Calculated Peak Strength
Background subtraction is done by running blank quartz-fiber filters (2-3 per day) equilibrated under the same conditions as test filter samples.
Biomass burning smoke
Figure 4. Comparison of TD-MS with AMS and NIST spectra.
Experimental Procedure The peak areas of ions at each temperature step are integrated and then normalized by the CO2 internal standard (0.7 mL 5% CO2/He) injected at the end of each run.
NH4NO3 → N2O+ 2H2O (moderate temperature) 2N2O → N2+ 2NO (high temperature)
No NIST spectrum available.
0.9
Ambient
0.8
Biomass
0.7
The TD-MS shows good linearity for both standard compounds and real-world samples.
Diesel
0.6
Gasoline
0.5 0.4 0.3 0.2 0.1 0
0 0
0.002
0.004
0.006
0.008
0.01
0.012
0.014
+ (m/z=48) peak normalized SOIntensity m/z 48 Ion (relative unit)
Note: SO+ is used because of a strong interference of organics on SO2+ signals.
0
0.001
0.002
0.003
0.004
0.005
0.006
0.007
0.008
m/z 30 Ion Intensity unit) normalized NO+ (relative (m/z=30) peak
Possible interference from organics.
Thus, it can provide quantitative aerosol analysis.
This study demonstrates the feasibility and potential applications of integrating TD-MS with a DRI carbon analyzer. The TD-MS generates aerosol MS spectra similar to AMS, which can be useful for quantitative aerosol analysis and source apportionment. Efforts are being made to reduce the oxidation of organics, improve the transmission efficiency of evolving species to the mass spectrometer, and calibrate the instrument for measurements of water, chloride, organic matter (OM) and other aerosol components.
References 1. 2. 3. 4. 5.
Chow, J.C., et al., Atmos. Environ. Part A. General Topics 1993, 1185-1201. Grabowsky, J., et al. Analytical and Bioanalytical Chemistry 2011, 401, 3153-3164. Canagaratna, M.R., et al., Mass Spectrometry Review 2007, 26, 185-222. Fujita, E.M., et al. Journal of the Air & Waste Management Association 2007, 57, 721-740. AMS Spectral Database http://cires.colorado.edu/jimenez-group/AMSsd/.