Predicting Web Development Effort Using a Bayesian Network
Emilia Mendes Computer Science department The University of Auckland Private Bag, 92019, Auckland, NZ
[email protected]
OBJECTIVE – The objective of this paper is to investigate the use of a Bayesian Network (BN) for Web effort estimation. METHOD – We built a BN automatically using the HUGIN tool and data on 120 Web projects from the Tukutuku database. In addition the BN model and node probability tables were also validated by a Web project manager from a well-established Web company in Rio de Janeiro (Brazil). The accuracy was measured using data on 30 projects (validation set), and point estimates (1-fold cross-validation using a 80%-20% split). The estimates obtained using the BN were also compared to estimates obtained using forward stepwise regression (SWR) as this is one of the most frequently used techniques for software and Web effort estimation. RESULTS – Our results showed that BN-based predictions were better than previous predictions from Web-based cross-company models, and significantly better than predictions using SWR. CONCLUSIONS – Our results suggest that, at least for the dataset used, the use of a model that allows the representation of uncertainty, inherent in effort estimation, can outperform other commonly used models, such as those built using multivariate regression techniques. Web effort estimation, Bayesian networks, Forward stepwise regression, prediction accuracy.
1. INTRODUCTION A cornerstone of Web project management is sound resource estimation, the process by which resources are estimated and allocated effectively, enabling projects to be delivered on time and within budget. Resources are factors, such as cost, effort, quality, ‘problem size’, that have a bearing on a project’s outcome. Within the scope of resource estimation, the causal relationship among factors is not deterministic and has an inherently uncertain nature. E.g. assuming there is a relationship between development effort and an application’s size (e.g. number of Web pages, functionality), it is not necessarily true that increased effort will lead to larger size. However, as effort increases so does the probability of larger size. Resource estimation is a complex domain where corresponding decisions and predictions require reasoning with uncertainty. In Web project management the understanding of what factors affect a project’s outcome and the causal relationships between factors is unknown. In addition, as Web development differs substantially from software development [25], there is very little research on resource estimation for software projects that can be readily reused. Web and software development differ in a number of areas; however, of these, three key areas provide the greatest differences and affect the entire Web/software development and maintenance processes [25]. These areas encompass the people involved in the development of these applications, their intrinsic characteristics and the audience for which they are developed. The development of conventional software remains dominated largely by IT professionals where a sound knowledge of programming, database design, and project management is necessary. In contrast, Web development encompasses a much wider variety of developers, such as amateurs with no programming skills, graphics designers, writers, database experts, and IT professionals, to name but a few. This is possible as Web pages can be created by anyone without the necessity for programming knowledge [3]. Web applications by default use communications technology and have multi-platform accessibility. In addition, since they employ a hypermedia paradigm, they are non-sequential by nature, using hyperlinks to inter-relate Web pages and other documents. Therefore, navigation and pluralistic design become important aspects to take into account when developing Web applications in general. Finally, the multitude of technologies available for developing Web applications means that developers can build a full spectrum of applications, from a static simple Web application using HTML to a fully fledged distributed e-commerce application [45]. Conventional software can be developed using several programming languages running on a specific platform, components off the shelf (COTS), etc. It can also use communications technology to connect to and use a database system. However, the speed of implementing new technology is faster for Web development relative to conventional software development.
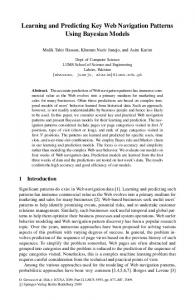
Web applications are aimed at wide-ranging groups of users. Such groups may be known ahead of time (e.g. applications available within the boundaries of an intranet). However, it is more often the case that Web applications are devised for an unknown group of users, making the development of aesthetically pleasing applications more challenging [8]. In contrast, conventional software applications are generally developed for a known user group (e.g. department, organisation, clients) making the explicit identification of target users and specific functional and non-functional requirements an easier task. Web development, despite being a relatively young industry, initiated just 13 years ago, currently represents a market that increases at an average rate of 20% per year, with Web e-commerce sales alone surpassing 95 billion USD in 2004 (three times the revenue from the world’s aerospace industry)1[38]. Unfortunately, in contrast, most Web development projects suffer from unrealistic project schedules, leading to applications that are rarely developed on time and within budget [38]. To understand resource estimation for Web projects, previous studies have developed models that use as input, factors such as the size of a Web application, and cost drivers (e.g. tools, developer’s quality, team size), and provide an effort estimate as output. The differences between these studies were the number and type of size measures used, choice of cost drivers and occasionally the techniques employed to build resource estimation models. Despite previous studies, to date no detailed understanding of which factors affect a Web project’s outcome, their causal relationships, and the uncertainty inherent to such relationships has been achieved. Important reasons for this gap in knowledge are: i) the use of techniques to build resource estimation models that fail to represent the causal relationship between factors and their corresponding uncertainty, and require the use of large amounts of data that is often difficult to obtain; ii) a strong reliance on obtaining the “correct” causal model using simple statistical models, which are inadequate to accommodate complex relationships between all the relevant factors [11]; iii) until recently, the non-existence of appropriate algorithms and corresponding software tools [14] to enable the building of large causal models that allow for uncertainty and probabilistic reasoning; iv) the relatively new research area of resource estimation for Web projects with the first study published in 2000 [23]. There have been numerous attempts to model resource estimation of Web projects, but none yielded a complete causal model incorporating all the necessary component parts. Mendes and Counsell [23] were the first to investigate this field by building a model that used machine-learning techniques with data from student-based Web projects, and size measures harvested late in the project’s life cycle. Mendes and collaborators also carried out a series of consecutive studies [13],[22],[23]-[33] where models were built using multivariate regression and machine-learning techniques using data on industrial Web projects. Recently they also proposed and validated size measures harvested early in the project’s life cycle, and therefore better suited to resource estimation [27]. Other researchers have also investigated resource estimation for Web projects. Reifer [39] proposed an extension of the COCOMO model, and a single size measure harvested late in the project’s life cycle. None were validated empirically. This size measure was later used by Ruhe et al. [40], who further extended a software engineering hybrid estimation technique, named CoBRA© [4], to Web projects, using a small data set of industrial projects, mixing expert judgement and multivariate regression. Later, Baresi et al. [1][2], and Mangia et al. [21] investigated effort estimation models and size measures for Web projects based on a specific Web development method, namely the W2000. Finally, Costagliola et al. [7] compared two types of Web-based size measures for effort estimation. A detailed survey of Web cost estimation studies is given in [24]. The goal and contribution of our research is therefore to create and evaluate a large-scale Bayesian network [14] (BN) that represents the causal model for resource estimation of Web projects, incorporating the fundamental factors and their causal relationships. No previous work in Web engineering has used a BN model for Web resource estimation. A BN is a model that embodies existing knowledge of a complex domain in a way that supports reasoning with uncertainty [14][36]. It is a representation of a joint probability distribution over a set of variables, and is made up of two parts. The first, the qualitative part, represents the structure of a BN as depicted by a directed acyclic graph (digraph) (see Figure 1). The digraph’s nodes represent the relevant variables (factors) from the domain being modelled, which can be of different types (e.g. observable or latent, categorical, numerical). A digraph’s arcs represent probabilistic relationships, i.e. they represent the causal relationships between variables [14][34][47]. The second, the quantitative part, associates a node probability table (NPT) to each node, its probability distribution. A parent node’s NPT describes the relative probability of each state (value) (Figure 1 “NPT for node Total Effort”); a child node’s NPT describes the relative probability of each state conditional on every combination of states of its parents (Figure 1 “NPT for node Quality delivered”). So, for example, the relative probability of Quality delivered (QD) being ‘Low’ conditional on Total effort (TE) being ‘Low’ is 0.8, and represented as: • p(QD = ‘Low’ | TE = ‘Low’) = 0.8 The other two conditional probabilities for QD = ‘Low’ are as follows: • p(QD = ‘Low’ | TE = ‘Medium’) = 0.2 • p(QD = ‘Low’ | TE = ‘High’) = 0.1 Each column in a NPT represents a conditional probability distribution and therefore its values sum up to 1 [14].
1
http://www.aia-erospace.org/stats/aero_stats/stat08.pdf http://www.tchidagraphics.com/website_ecommerce.htm
Quality delivered
NPT for node Total Effort (TE)
People quality
Total effort
Low Medium High
0.2 0.3 0.5
NPT for node Quality Delivered (QD) Total Effort Low Medium High Low 0.8 0.2 0.1 Medium 0.1 0.6 0.2 High 0.1 0.2 0.7
Parent node
Functionality delivered
Child node
FIGURE 1: A small BN model and two NPTs
Formally, the relationship between two nodes is based on Bayes’ rule [14][36]:
p( X | E ) =
p (Y | E ) p( E ) p (Y )
(1)
where: p ( X | E ) is called the posterior distribution and represents the probability of X given evidence E; • • •
p (E ) is called the prior distribution and represents the probability of X before evidence E is given; p ( E | X ) is called the likelihood function and denotes the probability of E assuming X is true.
Once a BN is specified, evidence (e.g. values) can be entered onto any node, and probabilities for the remaining nodes are automatically calculated using Bayes’ theorem [36][47]. Therefore BNs can be used for different types of reasoning, such as predictive and “what-if” analyses to investigate the impact that changes on some nodes have upon others [42]. The BN described and validated in this paper focuses on Web effort estimation only. This BN comprises a subset of a more complete BN, and was chosen since this is the only BN within the scope of our research that was built from data on Web projects, as opposed to being elicited from interviews with domain experts. We had the opportunity to gather data on 150 industrial Web projects as part of the Tukutuku Benchmarking project [27], and to use this data to build and validate the BN presented herein. The project data characterises Web projects using size measures and cost drivers targeted at effort estimation. Since we had a dataset of real industrial Web projects, we were also able to compare the accuracy of our Web effort BN to that provided using forward stepwise regression, which is used here only as a benchmark due to its frequent use in software and Web effort estimation studies. To do so we computed point forecasts for the BN using the method described in [37], to be detailed later. Prediction accuracy was measured using the Mean Magnitude of Relative Error (MMRE) [6], the Median Magnitude of Relative Error (MdMRE) [6], Prediction at level l, where l = 25 (Pred(25)) [6], the Mean Magnitude of Relative Error relative to the Estimate (MEMRE) [15], the Median Magnitude of Relative Error relative to the Estimate (MdEMRE) [15], boxplots of absolute residuals (actual effort – estimated effort) and finally boxplots of z (estimated effort / actual effort). The remainder of the paper is organised as follows: Section 2 describes the procedure used to build and validate the Web effort BN. Section 3 presents the results using forward stepwise regression, and the prediction accuracy of both models is compared in Section 4. Finally, conclusions and comments on future work are given in Section 5. 2. BUILDING THE WEB EFFORT BN 2.1 Dataset Description The analysis presented in this paper was based on data from 150 Web projects of the Tukutuku database [27], which aims to collect data from completed Web projects, to be used to develop Web cost estimation models and to benchmark productivity across and within Web Companies. The Tukutuku includes Web hypermedia systems and Web applications [5]. The former are characterised by the authoring of information using nodes (chunks of information), links (relations between nodes), anchors, access structures (for navigation) and its delivery over the Web. In addition, typical developers are writers, artists and organisations that wish to publish information on the Web and/or CD-ROMs without the need to use programming languages such as Java. Conversely, the latter represents software applications that depend on the Web or use the Web's infrastructure for execution and are characterized by functionality affecting the state of the underlying business logic. Web applications usually include tools suited to handle persistent data, such as local file system, (remote) databases, or Web Services. Typical developers are Computer Science or Software Engineering young programmers, managed by more senior staff. Note that the projects volunteered to the Tukutuku database represent a sample of self-selected projects (not a random sample) and therefore the results of this study are only applicable to either those Web companies that have volunteered project data to the Tukutuku database or to companies that develop projects of similar characteristics to those from this database. The Tukutuku database has data on 150 projects where: • Projects come from 10 different countries, mainly New Zealand (56%), Brazil (12.7%), Italy (10%), Spain (8%), United States (4.7%), England (2.7%), and Canada (2%). • Project types are new developments (56%) or enhancement projects (44%). • The applications are mainly Legacy integration (27%), Intranet and eCommerce (15%).
•
The languages used are mainly HTML (88%), Javascript (DHTML/DOM) (76%), PHP (50%), Various Graphics Tools (39%), ASP (VBScript, .Net) (18%), and Perl (15%). Each Web project in the database was characterized by 25 variables, related to the application and its development process (see Table 1). These size measures and cost drivers have been obtained from the results of a survey investigation [27], using data from 133 on-line Web forms that provided quotes on Web development projects. In addition, these measures and cost drivers have also been confirmed by an established Web company and a second survey involving 33 Web companies in New Zealand. Consequently it is our belief that the 25 variables identified are meaningful to Web companies and can be provided early on in a project life cycle. TABLE 1: Variables for the Tukutuku database Variable Name COMPANY DATA Country Established nPeopleWD PROJECT DATA TypeProj nLang DocProc ProImpr Metrics DevTeam TeamExp TotEff EstEff Accuracy WEB APPLICATION TypeApp TotWP NewWP TotImg NewImg Fots HFotsA Hnew TotHigh FotsA New TotNHigh
Scale
Description
Categorical Ordinal Ratio
Country company belongs to. Year when company was established. Number of people who work on Web design and development.
Categorical Ratio Categorical Categorical Categorical Ratio Ratio Ratio Ratio Categorical
Type of project (new or enhancement). Number of different development languages used If project followed defined and documented process. If project team involved in a process improvement programme. If project team part of a software metrics programme. Size of a project’s development team. Average team experience with the development language(s) employed. Actual total effort in person hours used to develop a Web application. Estimated total effort in person hours to develop a Web application. Procedure used to record effort data.
Categorical Ratio Ratio Ratio Ratio Ratio Ratio Ratio Ratio Ratio Ratio Ratio
Type of Web application developed. Total number of Web pages (new and reused). Total number of new Web pages. Total number of images (new and reused). Total number of new images created. Number of features reused without any adaptation. Number of reused high-effort features/functions adapted. Number of new high-effort features/functions. Total number of high-effort features/functions Number of reused low-effort features adapted. Number of new low-effort features/functions. Total number of low-effort features/functions
Within the context of the Tukutuku project, a new high-effort feature/function requires at least 15 hours to be developed by one experienced developer, and a high-effort adapted feature/function requires at least 4 hours to be adapted by one experienced developer. These values are based on collected data. Summary statistics for the numerical variables from the Tukutuku database are given in Table 2, and Table 3 summarises the number and percentages of projects for the categorical variables. TABLE 2 – Summary Statistics for numerical variables nlang DevTeam TeamExp TotEff TotWP NewWP TotImg NewImg Fots HFotsA Hnew totHigh FotsA New totNHigh
Mean 3.75 2.97 3.57 564.22 81.53 61.43 117.58 47.62 2.05 12.11 2.53 14.64 1.91 2.91 4.82
Median 3.00 2.00 3.00 78.00 30.00 14.00 43.50 3.00 0.00 0.00 0.00 1.00 1.00 1.00 4.00
Std. Dev. 1.58 2.57 2.16 1048.94 209.82 202.78 244.71 141.67 3.64 66.84 5.21 66.59 3.07 4.07 4.98
Min. 1 1 1 1 1 0 0 0 0 0 0 0 0 0 0
Max. 8 23 10 5000 2000 1980 1820 1000 19 611 27 611 20 19 35
TABLE 3 – Summary of number of projects and percentages for categorical variables Variable TypeProj DocProc ProImpr Metrics
Level Enhancement New No Yes No Yes No Yes
Num. Projects 66 84 53 97 77 73 85 65
% Projects 44 56 35.3 64.7 51.3 48.7 56.7 43.3
As for data quality, Web companies that volunteered data for the Tukutuku database did not use any automated measurement tools for effort data collection. Therefore in order to identify guesstimates from more accurate effort data, we asked companies how their effort data was collected (see Table 4). At least for 83% of Web projects in the Tukutuku database effort values were based on more than guesstimates. TABLE 4 - How effort data was collected Data Collection Method Hours worked per project task per day Hours worked per project per day/week Total hours worked each day or week No timesheets (guesstimates)
# of Projects
% of Projects 93 32 13 12
62 21.3 8.7 8
2.2 Procedure Used to Build the BNs The BN presented in this paper was built and validated using an adapted Knowledge Engineering of Bayesian Networks (KEBN) process [9][20][47] (see Figure 2). In Figure 2 arrows represent flows through the different processes, depicted by rectangles. Such processes are executed either by people – the Knowledge Engineer (KE) and the Domain Experts (DEs) [47] (white rectangles), or automatic algorithms (dark grey rectangles). Within the context of this research project this author is the knowledge engineer, and Web project managers from Web companies in Rio de Janeiro and Auckland are the domain experts. The three main steps within our KEBN process are the Structural Development, Parameter Estimation, and Model Validation. This process iterates over these steps until a complete BN is built and validated. Each of these three steps is detailed below: Structural Development: This step represents the qualitative Begin component of a BN, which results in a graphical structure comprised of, in our case, the factors (nodes, variables) and Structural Development causal relationships identified as fundamental for resource Evaluation estimation of Web projects. This is an iterative process where independent BN’s sub-models are identified. This Identify Identify Identify model construction process has been validated in previous values/states nodes/vars relationships studies [10][12][20][34][47] and uses the principles of problem solving employed in data modelling and software development [44]. Also, the BN tool we used (Hugin Expert) Parameter Estimation allows for the representation of sub-models, thus facilitating Expert No Data Elicitation the application of our modelling approach. Existing literature Ye in Web resource estimation, data from the Tukutuku database and current knowledge from domain experts were employed to elicit the BN’s structure. Automated Learning In the context of this paper we have used data from the Tukutuku database and current knowledge from a domain No expert (DE) who works in a well-established Web company Further Accept Elicitation in Rio de Janeiro (Brazil). This DE has been a software developer and project manager for more than 25 years, and Yes a Web project manager for more than 10 years. In addition, he also has previously participated in the Tukutuku project and agreed to volunteer his time to be the DE in this work. Model Validation The identification of nodes, values and relationships was initially obtained automatically using Hugin, and later Domain expert Model modified once feedback was obtained from the domain Walkthrough expert and the conditional independences were checked. In addition to identifying variables, their types (e.g. query Data-driven variable, evidence variable) and relationships, domain Predictive Accuracy experts in general also choose what states (values) each variable should take, and if they are discrete or continuous. No In practice, currently available BN tools require that Accept? continuous variables be discretised by converting them into Yes multinomial variables [18], also the case with Hugin Expert. Hugin offers two discretisation algorithms – equal-width intervals [41], whereby all intervals have equal size, and Next Stage equal-frequency intervals, whereby each interval contains n/N data points where n is the number of data points and N FIGURE 2 – KEBN, adapted from [40] is the number of intervals (this is also called maximal entropy discretisation [46]). We used equal-frequency intervals as suggested in [17], and five intervals. Throughout this step the knowledge engineer also evaluated the structure of the BN in two stages. The first entailed checking if [18]: variables and their values have a clear meaning; all relevant variables for that cycle have been included; variables are named conveniently; all states are appropriate (exhaustive and exclusive); a check for any states that can be combined. The second stage entailed reviewing the graph structure of the BN to make sure any identified d-separation dependencies comply with the types of variables used and causality assumptions. D-separation
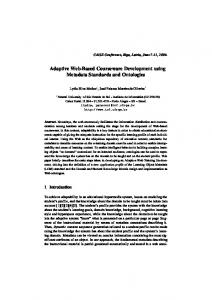
dependencies are used to identify variables influenced by evidence coming from other variables in the BN [14][36]. Once the BN structure is assumed to be close to final we may still need to optimise this structure to reduce the number of probabilities that need to be assessed for the network. If optimisation is needed then we employ techniques that change the graphical structure (e.g. divorcing [14]) and the use of parametric probability distributions (e.g. noisy-OR gates [10][36]). In the case of the Web effort BN we changed its original graphical structure to maintain the conditional independence of the nodes (see Section 2.3), however divorcing was not employed in order to keep only nodes that had been elicited from the Tukutuku data. Parameter Estimation: This step represents the quantitative component of a BN, which results in conditional probabilities, obtained via Expert Elicitation or automatically, which quantify the relationships between variables [14][18]. For the Web effort BN, they were obtained using two steps: first, by automatically fitting a sub-network to a subset of the Tukutuku dataset (Automated learning); second, by obtaining feedback from the domain expert regarding the suitability of priors and conditional probabilities that were automatically fitted. No previous literature was used in this step since none reported probabilistic information. Of the 150 projects available in the Tukutuku database we used 120 (80%) projects, selected at random, to build the Web effort BN and later employed the remaining 30 for the Model Validation step to assess the BN’s effort prediction accuracy. Model Validation: This step validates the BN that results from the two previous steps, and determines whether it is necessary to re-visit any of those steps. Two different validation methods used are - Model Walkthrough and Predictive Accuracy, which specifically verify if resource predictions provided by a BN are, on average, better than those currently used by Web companies. Predictive Accuracy is normally carried out using quantitative data, thus this was the validation approach we employed to validate the Web effort BN. Estimated effort for each of the 30 projects in the validation set was obtained using a point forecast, computed using the method described in [37]. This method calculates the joint probability distribution of effort using the belief distribution [36], and computes estimated effort as the sum of the probability of a given effort scale point multiplied by its related mean effort. This method was chosen because it had already been used within the context of software effort estimation, and there were no alternative methods in the Web effort estimation literature. Within the context of our Web effort BN, effort was discretised using a five-scale point (see Section 2.3). Model walkthrough represents the use of real case scenarios that are prepared and used by domain experts to assess if the predictions provided by a BN, or BN’s sub-model, correspond to the predictions experts would have chosen based on their own expertise. Success is measured as the frequency with which the BN’s predicted value for a target variable (e.g. quality) that has the highest probability corresponds to experts’ own assessment. We did not employ a model walkthrough to validate the Web effort BN because we had already carried out a Predictive accuracy procedure using real data volunteered by numerous Web companies worldwide. 2.3 The Web Effort BN Figure 3(a) shows the original Web effort BN obtained from fitting the data on Web projects.
(a)
(b) FIGURE 3 – Original BN (a) and BN after evaluation with DE (b)
We used the entire Tukutuku database when building the structure, however for parameter estimation we only employed the 120 projects in the training set, otherwise the point estimates would be biased because the NPTs would have been computed taking into account the projects from the validation set. Once this structure was obtained using the Necessary Path Condition (NPC) algorithm [43], it was validated with a domain expert, resulting in the structure presented in Figure 3(b). The main changes to the original structure were related to node TypeProj, from which all causal relationships, except for TotalEffort, were removed. There were also several changes relating to the three categorical variables Documented Process, Process Improvement and Use Metrics. In the validated structure (see Figure 3(b)), Process Improvement presents a relationship with both Use Metrics and Documented Process, indicating that it is an important factor determining whether a Web
company adheres to the use of metrics and to the use of a documented process. This structure also relates Use Metrics to Documented Process, indicating that companies that measure attributes to some extent document their processes. The number of languages to be used in a project (numLanguages) and the average number of years of experience of a team (Team Experience) are also related with the size of the development team (sizeDevTeam). The nodes relative to Web size measures (e.g. NewWP) remained unchanged as the data already captured the strong relationship between size and effort. Once the structure had been validated, our next step was to ensure that the conditionally independent variables (nodes) in the Web effort BN were really independent of each other [36]. Whenever two variables were significantly associated we also measured their association with effort, and the one with the stronger association was kept. For example, Process improvement was significantly associated with Fots, so one of these nodes had to be removed from the BN. Given that Process Improvement had a significant association with TotalEffort stronger than the association between TotalEffort and Fots, we kept Process Improvement in the model. This was an iterative process given that once nodes are removed (e.g. FotsA, New), other nodes become conditionally independent (e.g. totNHigh) and so need to be checked as well. The associations between the numerical variables were assessed using a non-parametric test - Spearman’s rank correlation test; the associations between numerical and categorical variables were checked using the one-way ANOVA test, and the associations between categorical variables were checked using the Chi-square test. All tests were carried out using SPSS 12.0.1 and α = 0.05. Figure 4 shows the Web effort BN after all conditional independences were checked. This was the Web effort BN used as input to the Parameter estimation step, where prior and conditional probabilities were automatically generated using the EM-learning algorithm [19], and later validated by the DE.
FIGURE 4 – BN after conditional independences were checked
Effort was discretised into five discrete approximations, described in Table 5. TABLE 5 – Effort discrete approximations Categories Very low Low Medium High Very High
Range (person hours) 12.55 and 33.8 and 101 and 612.5
Mean Effort 5.2 22.9 63.1 314.9 2,238.9
TotWP and NewWP were also discretised into five discrete approximations. There are no strict rules as to how many discrete approximations should be used. Some studies have employed three [37], others five [12], and others eight [42]. We chose five. However, further studies are necessary to determine whether different number of approximations leads to results significantly different. The NPTs for the seven nodes used in the Web effort BN are presented in Tables 6 to 12. In what ways do the results of this study extend previous work in Web effort estimation? First, this is the first time that variables such as TypeProject, DocProc, ProImpr and Metrics have been selected as effort predictors. All the previous studies that used a subset of the Tukutuku database either did not use any categorical variables [16][22][29], or built a multivariate regression model that did not select any of these variables [25]. Studies [16][22][29] excluded Categorical variables because they would require a large number of dummy variables which would rapidly reduce the degrees of freedom for analysis. Second, in our study NewWP presents a causal relationship with TotEff, and this relationship corroborates previous work using a subset of the Tukutuku dataset, where NewWP was selected as an effort predictor when using stepwise regression [22][27] or case-based reasoning [29]. Third, this is the first time that a Bayesian Network model is used for Web effort estimation. The Web effort BN model can be used by Web companies in different ways: to obtain point effort estimates given as input evidence related to a new Web project; to obtain probabilities associated with any of the nodes in the BN; to use “what-if” scenarios that may help manage projects more efficiently. Fourth, a Bayesian model seems more advantageous than any other models and techniques used to date in the Web effort estimation literature for the following reasons: i) this model and its NPTs can be automatically obtained from data (as we did) and later use input from one or more DEs. The downside is this choice requires a reasonable number of project data; ii) this model and its NPTs can be elicited from a combination of data from a small data set, and feedback from Domain Experts; iii) this model and its NPTs can be completely elicited from Domain Experts.
TABLE 6 – NPT for TotalEffort Total Effort TypeProject Enhancement Documented Process Yes No New WP V. Low Low Med. High V. High V. Low Low Med. High V. High V. Low Low Very Low 0.6 0.6 0.3 0.25 0 0 0.2 0 0.2 0.2 0 0.2 Low 0.3 0.3 0 0 0 1 0.2 0 0.2 0.2 0 0.2 Medium 0.1 0.1 0 0.25 0.5 0 0.2 0 0.2 0.2 0 0.2 High 0 0 0.7 0 0.5 0 0.2 1 0.2 0.2 1 0.2 Very High 0 0 0 0 0 0 0.2 0 0.2 0.2 0 0.2
New Yes No Med. High V. High V. Low Low Med. High V. High 0 0 0.2 0.2 0.2 0 0 0.2 0.34 0 0.2 0.2 0.2 0 0 0.2 0.34 0 0.2 0.2 0.2 0 0 0.2 0 1 0.2 0.2 0.2 1 1 0.2 0.34 0 0.2 0.2 0.2 0 0 0.2
TABLES 7 AND 8 – NPTs for NewWP and TotWP NewWP Very Low 0.51 Low 0.1 Medium 0.2 High 0.09 Very High 0.1
NewWP Very Low Low Medium High Very High
Very Low 0.6 0.4 0 0 0
TotWP Low Medium 0 0 0.5 0.5 0.25 0.5 0 0 0.25 0
High 0 1 0 0 0
Very High 0.2 0.2 0.2 0.2 0.2
TABLES 9 AND 10 – NPTs for Documented Process and Use Metrics Process Improvement Use Metrics Yes No
Documented Process Yes Yes No Yes 0.98 0.8 0.02 0.2
No No 0.5 0.5
0.47 0.53
Use Metrics Process Improvement Yes Yes 0.8 No 0.2
No 0.1 0.9
TABLES 11 AND 12 – NPTs for Process Improvement and TypeProject Process Improvement Yes 0.5 No 0.5
TypeProject Enhancement New
0.79 0.21
3. BUILDING THE REGRESSION-BASED WEB EFFORT MODEL We also built a stepwise regression (SWR) model using the same training set of 120 projects used to build the Web effort BN. We used SWR as a benchmark only and chose this technique because SWR is one of the most frequently used effort estimation techniques in both Software and Web Engineering literature. Before building the model we made sure that assumptions related to using multivariate regression were not violated [16]. The One-Sample Kolmogorov-Smirnov Test (K-S test) confirmed that none of the numerical variables were normally distributed, and so were transformed into a natural logarithmic scale to approximate a normal distribution. Several variables were clearly related to each other (e.g. TotWP and NewWP; TotImg and NewImg; totNHigh, FotsA and New) thus we did not use the following variables in the stepwise regression procedure: • TotWP – associated to NewWP • TotImg – associated to NewImg • Hnew and HFotsA – associated to TotHigh; both present a large number of zero values, which leads to residuals that are heteroscedastic. • New and FotsA - associated to TotNHigh; both present a large number of zero values, which leads to residuals that are heteroscedastic. We created four dummy variables, one for each of the categorical variables TypeProj, DocProc, ProImpr, and Metrics. Table 13 shows the final set of variables used in the stepwise regression procedure. TABLE 13 – Final set of variables used in the Stepwise regression procedure Variable Lnlang LDevTeam LTeamExp LTotEff LNewWP LNewImg LFots LtotHigh LtotNHigh TypeEnh DocProcY ProImprY MetricsN
Meaning Natural logarithm of nlang Natural logarithm of LDevTeam Natural logarithm of TeamExp Natural logarithm of TotEff Natural logarithm of NewWP + 1 Natural logarithm of NewImg + 1 Natural logarithm of Fots + 1 Natural logarithm of totHigh + 1 Natural logarithm of totNHigh + 1 Dummy variable created from TypeProj where ‘enhancement’ is coded as 1 and ‘new’ is coded as 0 Dummy variable created from DocProc where ‘yes’ is coded as 1 and ‘no’ is coded as 0 Dummy variable created from ProImpr where ‘yes’ is coded as 1 and ‘no’ is coded as 0 Dummy variable created from Metrics where ‘no’ type is coded as 1 and ‘yes’ is coded as 0
To verify the stability of the effort model the following steps were used [16]: i) Use of a residual plot showing residuals vs. fitted values to investigate if the residuals are random and normally distributed; ii) Calculate Cook’s distance values for all projects to identify influential data points. Those with distances higher than 4/n are removed to test the model stability. If the model coefficients remain stable and the goodness of fit improves, the influential projects are retained in the data analysis. The prediction accuracy of the SWR model was checked using the same 30 projects from the validation set used with the Web effort BN, and the prediction accuracy was tested on the raw data (not log-transformed data). The regression model selected six significant independent variables: LTotHigh, LNewWP, LDevTeam, ProImprY, LNewImg, and Lnlang. Its adjusted R2 was 0.80. The residual plot showed several projects that seemed to have
very large residuals, also confirmed using Cook’s distance. Nine projects had their Cook’s distance above the cutoff point (4/120). To check the model’s stability, a new model was generated without the nine projects that presented high Cook’s distance, giving an adjusted R2 of 0.857. In the new model the independent variables remained significant and the coefficients had similar values to those in the previous model. Therefore, the nine high influence data points were not permanently removed. The final equation for the regression model is described in Table 14. TABLE 14 – Best Model to calculate LTotEff Independent Variables (Constant) LTotHigh LNewWP LDevTeam ProImprY LNewImg Lnlang
Coeff. 1.636 .731 .259 .859 -.942 .193 .612
Std. Error .293 .119 .068 .162 .208 .052 .192
t 5.575 6.134 3.784 5.294 -4.530 3.723 3.187
p>|t| .00 .00 .00 .00 .00 .00 .002
When transformed back to the raw data scale, this gives the Equation:
TotEfft = 5.1345 TotHigh 0.731 NewWP 0.259 DevTeam0.859e −0.942 Pr o Im prY New Im g 0.193nlang 0.612
(2)
The residual plot and the P-P plot for the final model are presented in Figures 5 and 6, respectively, and both suggest that the residuals are normally distributed.
FIGURE 5 – Residuals for best regression model
FIGURE 6 – Normal P-P plot for best regression model
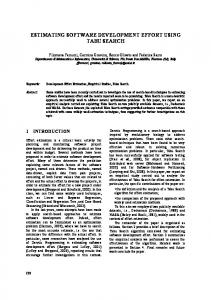
4. COMPARING THE WEB EFFORT BN TO THE WEB EFFORT REGRESSION MODEL Table 15 shows MMRE, MdMRE, Pred(25), MEMRE and MdEMRE for SWR and Web effort BN, and Figure 7 shows boxplots of absolute residuals and z. TABLE 15 – Accuracy measures for models Accuracy (%) MMRE MdMRE Pred(25) MEMRE MdEMRE
(a)
BN model 34.26 27.42 33.33 228.41 35.83
Regression model 94.75 100.00 6.67 31.12 (6 out of 30) 35.83 (6 out of 30)
(b)
FIGURE 7 – Absolute residuals (a) and z (b) for BN (ResBN) and regression (RESSWR) models
MMRE, MdMRE and Pred(25) suggest that prediction accuracy for the BN model was superior to the prediction accuracy for SWR. When using SWR, there were 24 projects in the validation set for which estimated effort was zero (due to NewImg being zero), and as a consequence, MEMRE and MdEMRE could only be calculated for the remaining six projects, which very likely provides a distorted view of SWR’s accuracy. This problem is also present when we look at the boxplots of z for SWR (SWRz). Given these circumstances we prefer to rely on the absolute
residuals, which were compared using the non-parametric Wilcoxon Signed Paired Test, and showed that the sum of ranks for SWR residuals (RESSWR) were significantly larger than the sum of ranks for BN residuals (ResBN). In addition, Figure 7 shows that the median for RESSWR is higher than ResBN’s median, and the regression-based residuals have a wider spread and many extreme outliers. However, the boxes did not seem to vary widely. Although Pred(25) for the BN model does not look very good, it is better than any of the Pred(25) values obtained in previous studies using Web based cross-company models [16][22][25][29]. The MMRE and MdMRE for the BN model are also better than any other MMREs and MdMREs obtained in previous studies using Web-based crosscompany models [16][22][25][29]. What these results suggest is that using a model that allows the representation of uncertainty, which is inherent in effort estimation, can outperform other commonly used models, such as those built using multivariate regression techniques. The Web effort BN model is a very simple model, built using a dataset that does not represent a random sample of projects, these results have to be interpreted with care. In addition, we chose to use only the nodes identified using the Tukutuku dataset, i.e., other nodes that could have been identified by the DE were not included. We also wanted to investigate to what extent a BN model and probabilities generated using automated algorithms available in HUGIN would provide predictions comparable to those obtained using well-known techniques, such as stepwise regression. There are several issues regarding the validity of our results: i) the choice of discretisation, structure learning, parameter estimation algorithm, and the number of categories used in the discretisation all affect the results and there are no clear-cut guidelines on the best combination to use. This means that further investigation is paramount; ii) the Web effort BN presented in this study might have been quite different had it been entirely elicited from DEs, and this is part of our future work; iii) the decision as to what conditional independent nodes to retain was based on their strength of association with TotalEffort, however other solutions could have been used, e.g. ask a DE to decide; iv) obtaining feedback from more than one DE could also have influenced the BN structure in Figure 3(b), and this is also part of our future work; v) the participation of a single DE has a bearing on the outcome of this work, and also on its replicability. As part of our future work we plan to obtain feedback on the model presented here from other Web project managers, and to compare the results with those presented in this paper. Finally, the use of BN tools by practitioners may still prove to be a challenge given that there are still many interface and technical issues that do not make their use straightforward. 5. CONCLUSIONS This paper has presented the results of an investigation where a Bayesian Network model was built and used to estimate effort for Web projects. The BN was built automatically using data on 120 Web projects from the Tukutuku database. In addition, this BN was also validated by an experienced Web developer and project manager from an established Web company in Rio de Janeiro, Brazil. Except for TotWP and NewWP, none of the previous studies in Web effort estimation that employed subsets of the Tukutuku database have used or have built models that selected the variables presented within the Web effort BN model in Figure 4. In addition, this was the first time that a cross-company data set on Web project data presented MMRE and MdMRE 31%. The largest Pred(25) previously obtained using a Web-based cross-company model was of 30.8 [16]. In addition, the smallest MMRE and MdMRE previously obtained using a Web-based cross-company model were of 56.5% and 44%, respectively, which are much worse than the MMRE of 34.26 and MdMRE of 27.42 achieved in this study. We also compared, using a validation set of 30 projects, the accuracy of the BN predictions to those from stepwise regression (SWR), and the Wilcoxon Signed Paired Test showed that BN predictions were significantly superior to SWR predictions. Future work entails: the building of a second Web effort BN based solely on domain experts’ knowledge, to be compared to the BN presented in this paper; aggregation of this BN to our large Web resource BN, to obtain a complete causal model for Web resource estimation; comparison of accuracy between BNs derived from crossand single-company data. 6. ACKNOWLEDGMENTS We would like to thank Dr. N. Mosley for his comments on a previous version of this paper. This work is sponsored by the Royal Society of New Zealand, under the Marsden Fund research grant 06-UOA-201 MIS. REFERENCES [1] [2] [3] [4] [5] [6]
Baresi, L., S. Morasca, and P. Paolini (2002) An empirical study on the design effort for Web applications, Proceedings of WISE 2002, pp. 345-354. Baresi, L., S. Morasca, and P. Paolini (2003) Estimating the design effort for Web applications, Proceedings of Metrics 2003, pp. 62-72. Brereton, P., D. Budgen, and G. Hamilton (1998) Hypertext: the next maintenance mountain, Computer, December, 31(12), 4955. Briand, L.C., K. El Emam, F. Bomarius (1998) COBRA: A Hybrid Method for Software Cost Estimation, Benchmarking and Risk Assessment, Proceedings of the 20th International Conference on Software Engineering, 1998, pp. 390-399. Christodoulou, S.P., Zafiris, P.A., and Papatheodorou, T.S. (2000) WWW2000: The Developer's view and a practitioner's approach to Web Engineering, Proc. Second ICSE Workshop on Web Engineering, 4 and 5 June 2000, Limerick, pp. 75-92. Conte, S., H. Dunsmore, and V. Shen (1986) Software Engineering Metrics and Models. Benjamin/Cummings, Menlo Park, California.
[7] [8] [9] [10] [11] [12] [13] [14] [15] [16] [17] [18] [19] [20] [21] [22] [23] [24] [25] [26] [27] [28] [29] [30] [31] [32] [33] [34] [35] [36] [37] [38] [39] [40] [41] [42] [43] [44] [45] [46] [47]
Costagliola, G., Martino, S. Di, Ferrucci, F., Gravino, C., Tortora, G., and Vitiello, G. (2006) Effort estimation modeling techniques: a case study for web applications, Procs. Intl. Conference on Web Engineering (ICWE’06), pp. 9-16. Deshpande, Y., and S. Hansen (2001) Web engineering: creating a discipline among disciplines, IEEE Multimedia, April−June, 8(2), 82-87. Druzdzel, M.J., A. Onisko, D. Schwartz, J.N. Dowling, and H. Wasyluk (1999). Knowledge engineering for very large decisionanalytic medical models, Proceedings of the 1999 Annual Meeting of the American Medical Informatics Association, pp. 10491054. Druzdzel, M.J., and L.C. van der Gaag (2000) Building Probabilistic Networks: Where Do the Numbers Come From?, IEEE Trans. on Knowledge and Data Engineering, 12(4), 481-486. Fenton, N., P. Krause, and M. Neil (2002) Software Measurement: Uncertainty and Causal Modeling, IEEE Software, 116-122. Fenton, N., W. Marsh, M. Neil, P. Cates, S. Forey, and M. Tailor (2004) Making Resource Decisions for Software Projects, Proc. ICSE’04, pp. 397-406. Fewster, R., and E. Mendes (2001) Measurement, Prediction and Risk Analysis for Web Applications, Proceedings of IEEE Metrics Symposium, pp. 338 – 348. Jensen, F. V. (1996) An introduction to Bayesian networks. UCL Press, London. Kitchenham, B.A., L.M. Pickard, S.G. MacDonell, and M.J. Shepperd (2001) What accuracy statistics really measure, IEE Proc. - Software Engineering, 148(3), June. Kitchenham, B.A. and Mendes, E. (2004) A Comparison of Cross-company and Single-company Effort Estimation Models for Web Applications, Proceedings EASE 2004, pp 47-55. Knobbe, A.J. and Y Ho, E.K. (2005) Numbers in Multi-Relational Data Mining, Proceedings of PKDD 2005, Portugal Korb, K.B., and A.E. Nicholson (2004) Bayesian Artificial Intelligence, CRC Press, USA. Lauritzen, S.L. (1995) The EM algorithm for graphical association models with missing data, Computational Statistics & Data Analysis, 19:191-201. Mahoney, S.M., and K.B. Laskey (1996). Network Engineering for Complex Belief Networks, Proc. Twelfth Annual Conference on Uncertainty in Artificial Intelligence, pp. 389-396. Mangia, L., and R. Paiano (2003). MMWA: A Software Sizing Model for Web Applications, Proc. Fourth International Conference on Web Information Systems Engineering, pp. 53-63. Mendes, E., and B.A. Kitchenham (2004). Further Comparison of Cross-company and Within-company Effort Estimation Models for Web Applications, Proc. IEEE Metrics, pp. 348-357. Mendes, E., and S. Counsell (2000). Web Development Effort Estimation using Analogy, Proc. 2000 Australian Software Engineering Conference, pp. 203-212. Mendes, E., and N. Mosley (2005) Web Cost Estimation: principles and applications. Web Engineering – Principles and Techniques, Idea Group, Inc., Mehdi Khosrow-Pour and Jan Travers (Eds.), pp. 182-202. Mendes, E., Mosley, N. and Counsell, S. (2005) Web Effort Estimation, Web Engineering, Springer-Verlag, Mendes, E. and Mosley, N. (Eds.) ISBN: 3-540-28196-7, pp. 29-73. Mendes, E., and N. Mosley (2002). Further Investigation into the Use of CBR and Stepwise Regression to Predict Development Effort for Web Hypermedia Applications, Proc. ACM/IEEE ISESE, Nara, Japan, pp. 79-90. Mendes, E., N. Mosley, and S. Counsell (2005). Investigating Web Size Metrics for Early Web Cost Estimation, Journal of Systems and Software, 77(2), 157-172. Mendes, E., N. Mosley, and S. Counsell (2003). A Replicated Assessment of the Use of Adaptation Rules to Improve Web Cost Estimation, Proc. ISESE, pp. 100-109. Mendes, E., N. Mosley, and S. Counsell (2003). Early Web Size Measures and Effort Prediction for Web Costimation, Proceedings of the IEEE Metrics Symposium, pp. 18-29. Mendes, E., N. Mosley, and S. Counsell (2002). Comparison of Length, complexity and functionality as size measures for predicting Web design and authoring effort, IEE Proc. Software, 149(3), June, 86-92. Mendes, E., N. Mosley, and S. Counsell (2001). Web metrics - Metrics for estimating effort to design and author Web applications. IEEE MultiMedia, January-March, 50-57. Mendes, E., N. Mosley, and I. Watson (2002). A Comparison of Case-Based reasoning Approaches to Web Hypermedia Project Cost Estimation, Proc. WWW’02. Mendes, E., I. Watson, C. Triggs, N. Mosley, and S. Counsell (2003). A Comparative Study of Cost Estimation Models for Web Hypermedia Applications, ESE, 8(2), 163-196. Neil, M., Fenton, N., and Nielsen, L. (2000) Building Large-scale bayesian networks, The knowledge Engineering Review, KER, Vol. 15, No. 3, 257-284. Neil, M., M. Tailor, D. Marquez, N. Fenton, and P. Hearty (2006). Modeling Dependable Systems using Hybrid Bayesian Networks, Proc. BND Workshop, pp. 817-823. Pearl J. (1988). Probabilistic Reasoning in Intelligent Systems, Morgan Kaufmann, San Mateo, CA. Pendharkar, P.C., Subramanian, G.H., and Rodger, J.A. (2005) A Probabilistic Model for Predicting Software Development Effort, IEEE Trans. Software Eng. Vol. 31, No. 7, 615-624. Reifer, D.J. (2000) Web Development: Estimating Quick-to-Market Software, IEEE Software, Nov.-Dec., 57-64. Reifer, D.J. (2002). Ten deadly risks in Internet and intranet software development, IEEE Software, Mar-Apr, 12-14. Ruhe, M., R. Jeffery, and I. Wieczorek (2003). Cost estimation for Web applications, Proceedings ICSE 2003, 285-294. Silverman, B.W. (1986), Density Estimation for Statistics and Data Analysis, Chapman and Hall, 1986 Stamelos, I., Angelis, L., Dimou, P., and Sakellaris, E. (2003) On the use of Bayesian belief networks for the prediction of software productivity, Information and Software Technology, Vol. 45, No. 1, 1 January 2003, 51-60(10). Steck, H., and Tresp, V. (1999) Bayesian Belief Networks for Data Mining, Proceedings of The 2nd Workshop on Data Mining und Data Warehousing, Sammelband, September 1999. Studer, R., V.R. Benjamins, and D. Fensel (1998). Knowledge engineering: principles and methods. Data & Knowledge Engineering, vol. 25, 161-197. Taylor, M.J., J. McWilliam, H. Forsyth, and S. Wade (2002) Methodologies and website development: a survey of practice. Information and Software Technology, 44(6), 381-391. Wong, A.K.C., and Chiu, D.K.Y. (1987) Synthesizing Statistical Knowledge from Incomplete Mixed-mode Data, IEEE Transactions on Pattern Analysis and Machine Intelligence, Vol. PAMI-9,No. 6, 796-805. Woodberry, O., A. Nicholson, K. Korb, and C. Pollino (2004). Parameterising Bayesian Networks, Proc. Australian Conference on Artificial Intelligence, pp. 1101-1107.