©2007 Institute for Scientific Computing and Information
INTERNATIONAL JOURNAL OF OF INTERNATIONAL JOURNAL INFORMATION ANDAND SYSTEMS SCIENCES INFORMATION SYSTEMS SCIENCE Volume 3, Number 1, Pages 180-205 Volume 1, Number 1, Pages 1-22
ROBUSTNESS ASSESSMENT OF ADAPTIVE FDI SYSTEM FOR ENGINE AIR PATH
M. S. SANGHA, D. L. YU AND J. B. GOMM
Abstract: Robustness assessment is important for every newly developed method. This paper presents robustness assessment of a new adaptive on-board fault diagnosis algorithm for the air-path of spark ignition (SI) engines. The method uses a radial basis function (RBF) neural network to classify pre-defined possible faults from engine measurements, reporting fault occurrence as well as the type and size of a fault. After diagnosing faults in each sample interval, the weights and widths of the RBF fault classifier are updated with the measurements and appropriately selected target outputs. Consequently, the network can adapt to the time-varying dynamics of the engine and environment change so that the false alarm rate is greatly reduced and the required network size is also reduced. The developed scheme is assessed with various faults simulated on a mean value engine benchmark model and compared with a fixed parameter RBF classifier. The robustness assessment is done for a wide range of operational modes for an automotive engine in real life.
Special attention
has been given to minimise the neural network size for its practical implementation in electronic control unit (ECU) of an automotive. Simulation results demonstrate the effectiveness of the proposed algorithm and its robustness.
Keywords: On-board fault diagnosis, automotive engines, adaptive neural networks, adaptive fault classification.
Notation m& EGR EGR mass flow (kg/sec) Vi manifold + port passage volume (m3) R gas constant (here 287 X 10-5) κ ratio of specific heats = 1.4 for air I crankshaft load inertia (kg m2) Pf friction power (kW) Pb load power (kW) λ = 1 Relative value to indicate the air–fuel ratio (corresponds to air/fuel ratio of 14.7) Pp pumping power (kW) Hu fuel lower heating valve (kJ/kg) ∆τ d injection torque delay time (sec)
time (sec) α throttle plate angle (degrees) n engine speed (rpm/1000) m& f engine port fuel mass flow (kg/sec) Ta ambient temperature (Kelvin) pi absolute manifold pressure (bar) Ti intake manifold temperature (Kelvin) m& at air mass flow past throttle plate (kg/sec) TEGR EGR temperature (Kelvin) m& ap air mass flow into intake port (kg/sec) t
Received by the editors June 30, 2006 180
ROBUSTNESS ASSESSMENT OF ADAPTIVE FDI SYSTEM FOR ENGINE AIR PATH
181
1. Introduction There were about 450 million passenger cars on the streets and roads of the world in year 2001. The number of vehicles is increasing every day and so is the problem of air pollution. A fault in an automotive engine can lead to an increase in pollution and decrease in fuel efficiency. Therefore fault detection; isolation and accommodation have become one of the most important aspects of automobile design. There are laws to be strictly abided by all the automobile manufacturers. Continuous efforts are being made to improve the design of the Electronic Control Unit (ECU) in order to ensure early detection and isolation of engine faults, which can be hazardous for human life or lead to increased air pollution or adversely affect the fuel efficiency. On-board diagnostic (OBD) regulations were first started in late eighties in California and subsequently were followed by the UK and then by rest of the Europe. OBD systems have become very sophisticated these days. OBD-II, a standard introduced in 1996, provides almost complete engine control and also monitors parts of the chassis, body and accessory devices, as well as the diagnostic control network of the car. All vehicles sold in the UK after December 31st 2000 are required by legislation to allow the European On Board Diagnostic (EOBD) protocol. All diesel cars sold in the EU must have an OBD system from year 2003 [1]. OBD-II requires continuous monitoring and fault detection capability for all vehicle components whose failures can result in emission levels beyond 1.5 times of the Federal Test Procedure (FTP) standards. These days OBD-III is discussed as a program to minimize the delay between the detection of an emission malfunction by the OBD-II system and the actual repair of the vehicle. A vehicle diagnosis system can handle with OBD III as well as OBD II by only adding a transponder to an OBD II system. The vehicle diagnosis system includes an engine ECU for controlling an engine device such as injector and storing a diagnosis data, a K-line connected to the engine ECU, a transponder connected to the K-line, and a connector connected to the K-line for detachably connecting an external scan tool that reads the diagnosis data stored in the engine ECU. The transponder receives a request from a receiver system by radio, reads the diagnosis based on the request, and sends the read diagnosis data to the receiver system. Therefore an automotive engine can be continuous monitored remotely through a transponder. Previously, many model-based fault detection and isolation (FDI) techniques [2]-[5] for automotive engines have been investigated. It has been shown how the faults of actuators and sensors of an automotive engine can be detected by utilizing structured parity equations and analytical redundancy techniques in [6] and [7]. The methods do not include heavy computing load and therefore are practically implemental. However, the detection is degraded when the engine is working over a wide operating region because the methods were developed based on a linear model and an engine exhibits severe nonlinear behaviour when the working range is wide. An intelligent fault diagnosis approach has been studied employing quantitative models and graph-based dependency models [8]. As engines are multivariable and severely nonlinear, the qualified quantitative models are difficult to develop. A nonlinear observer method was studied in [9]. A real time supervision scheme using production and additional sensors was developed in [1]. A structured hypothesis method based on statistical hypothesis tests (SHT) was investigated in [10]. Fault detection with fuzzy logic models has also been researched in [11] and [12]. A common disadvantage of these model-based methods is
182
M. S. SANGHA, D. L. YU AND J. B. GOMM
their sensitivity to process/model mismatch, which is a main focus of current research in this area. Research has also been done to find alternatives to model-based FDI for automotive engines. For example a probabilistic approach in [13] for complex systems including a large number of components has been applied to diagnose engine throttle angular sensors. Artificial Neural Networks (ANNs) are well suited to FDI because of good classification properties which are well documented in [14]. Applications of ANNs to engine modelling and control were presented in [5], [15] and [16]. Multi-layer Perceptron (MLP) neural networks with the back-propagation (BP) training algorithm for engine fault diagnosis have been investigated in [17]–[18]. Supervised networks have been shown to exhibit better classification capabilities than unsupervised networks in FDI [19] and in supervised networks, RBF has shown better classification capability than MLP [20] for engine FDI. Most ANN methods have used a fixed parameter network as the fault classifier. When the data collected from the real engine is used to train the network, the classifier is able to cope better with the model-plant mismatch caused by system complexity and nonlinearity, compared with the analytical model-based methods. However, after the classifier is put in real use for a period of time, changes in engine dynamics caused by mechanical wear of the parts and environment change will degrade the FDI performance of the classifier. A new on-line FDI scheme proposed for engines using an adaptive neural network classifier [21] has been thoroughly tested for a wide range of operational modes to check its robustness in this paper. The classifier system has the following three features: (a) using the strong nonlinear mapping (classifying) ability of the ANN to cope with the multivariable, severe nonlinearity of engine dynamics; (b) the classifier is made adaptive to cope with the significant parameter uncertainty, disturbance and environment change; and (c) on-line fault diagnosis which can be directly implemented in an on-board diagnosis system (hardware). During operation, the network classifier learns parameter changes in the engine due to aging or environment change. It can also adapt to engine-to-engine differences within a batch of products. Gaussian radial basis function (RBF) neural nets are used for this purpose and both weights and widths are on-line adapted. Every sample of engine data is first tested for a fault and then used to update the neural network. The proposed approach is applied to diagnose some simulated faults in an SI engine air path. It is not practical and limited to simulate faults on the real engine at specific time and under specific situation to get faulty real data. Therefore, a well-known and widely used engine benchmark; the mean value engine model (MVEM) [22] is used. Two component and two sensor faults were simulated on the MVEM. All the four faults are considered with four different levels of intensities. The two component faults are exhaust gas recycle (EGR) valve stuck up and gas leakage in the intake manifold. The two sensor faults are for intake manifold pressure and temperature sensors. The algorithm is compared with that using a non-adaptive classifier and its robustness is demonstrated with simulation results. Further the robustness of the developed adaptive system is checked by testing it for a wide range of operational modes for an automotive engine in real life.
ROBUSTNESS ASSESSMENT OF ADAPTIVE FDI SYSTEM FOR ENGINE AIR PATH
183
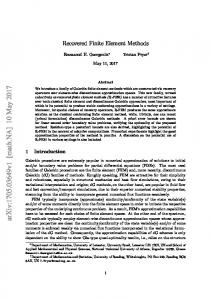
2. Engine Dynamics and Faults 2.1 Engine Dynamics To investigate the feasibility of the developed method, an engine simulation model is used for fault simulation and fault test. A well-known and widely used benchmark for engine modelling, control and fault diagnosis, the MVEM is chosen. It consists of three sub-models that describe the intake manifold dynamics including air mass flow, pressure and temperature and the crankshaft speed. 2.1.1 Manifold Filling Dynamics The engine air path is schematically illustrated in Fig.1. Its dynamics are briefly presented as follows and the physical parameters are defined in the Nomenclature. For the details of the dynamics reader can refer to the reference [22]. EGR V a lv e T e m p e ra tu re Sensor C y lin d e r V a lv e s
T h ro ttle P la te
In le t M a n ifo ld
Exhaust C y lin d e r
P re s s u re Sensor
Leakage
P is to n
Fig 1: Schematic of the air intake and exhaust system of the engine The manifold filling dynamics in reality is based on an adiabatic operation rather than isothermal. The manifold pressure can be represented by equation (1). κR (1) p& i = − m& ap Ti + m& at Ta + m& EGR TEGR Vi
(
)
The positive terms within brackets show the in-flow of gas and the negative term shows the outflow of gas from the intake manifold (see Fig. 1). Using the law of energy conservation a state equation which describes the time development of the intake manifold temperature can be given as, RTi (2) T&i = − m& ap (κ − 1)Ti + m& at (κTa − Ti ) + m& EGR (κTEGR − Ti ) piVi
[
]
2.1.2 Crank Shaft Speed Dynamics Applying the law of conservation of rotational energy, the crankshaft dynamics of an SI engine MVEM are described by equation (3). 1 1 (3) n& = − ⎛⎜ P f ( pi , n) + Pp ( pi , n) + Pb ( n) ⎞⎟ + H η ( p , n, λ ) m& f (t − ∆τ d ) ⎠ In u i i In ⎝ where I is the scaled moment of inertia of the engine and its load and the mean
184
M. S. SANGHA, D. L. YU AND J. B. GOMM
injection/torque time delay has been taken into account with variable ∆τ d . λ is taken equal to “1” which corresponds to air/fuel ratio of 14.7 for gasoline and 14.5 for diesel. At a λ value of "1" we have stoiciometry or the point at which the most complete combustion takes place. λ gives a measure of Air Fuel Ratio which is independent of the type of fuel being used. λ > 1.0 => Excess Air (Lean) and λ < 1.0 => Excess Fuel (Rich). 2.2 Fault Simulation In this paper two component and two sensor faults with four different levels of intensities have been investigated as four typical and practical examples of SI engine faults. The faults considered are realistic and have been considered by previous authors [1] and [17]. The two component faults are exhaust gas recycle (EGR) valve stuck up and gas leakage in the intake manifold. The two sensor faults are intake manifold pressure and temperature sensor faults. The sensor faults can occur due to two reasons: (i) Aging and wear & tear of the mechanical parts of the deflection meter and (ii) Electrical fault e.g. short circuit or open circuit fault in the signal cable. The electrical faults are very easy to detect because open circuit and short circuit faults will cause a full deflection or zero deflection in the meter respectively. On the contrary, the aging and mechanical faults cause an incorrect meter reading i.e. over- or underreading of the actual values. Both cases of under- and over- reading of the temperature or pressure measurements are considered here. Air leakage in the air path can happen due to the following reasons: (i) missing gas caps (ii) loose gas caps (iii) leaks in gas caps or vapour vent lines (iv) disconnected purge lines [23]. Current OBD regulations require monitoring of any leaks (for 2003 year model and after) that exceed 0.02 inch in diameter (0.5 mm approx). It is not practical to create some component faults in a running engine in real life, such as air leakage in manifold or EGR valve stuck. Therefore the faults are simulated in a Matlab engine model in this research. The air leakage is simulated in the modified mean value engine model as a percentage of the total air mass flow in the intake manifold explained later. The EGR valve can be stuck up in any position where there is a failure of the EGR valve positioning control. This will lead to a fixed percentage EGR flow through the valve. There can be many reasons for failure of the EGR valve positioning system, which have not been investigated in this paper. The investigation is focused on the detection and isolation of the fault and its intensity and not on pin-pointing the actual component failure of the EGR system viz. (i) EGR open circuit fault (ii) EGR vent solenoid fault (iii) EGR step motor 1 fault (iv) EGR step motor 2 fault (v) EGR vacuum regulator fault (vi) EGR boost solenoid control fault etc. Details of the simulation of the faults are described in the following sections. 2.2.1 No Fault For no fault situation, EGR is assumed to be 1/6 (16.67%) of the total air mass flow in
ROBUSTNESS ASSESSMENT OF ADAPTIVE FDI SYSTEM FOR ENGINE AIR PATH
185
the intake manifold. Practically EGR in a car can be as high as 20% of the total air mass flow. It is also assumed that all the sensors are working well and there is no leakage in the intake manifold. 2.2.2 Air Leakage Fault To collect the engine data subjected to the air leakage fault, equation (1) is modified to κR (4) P&i = − m& apTi + m& at Ta + m& EGRTEGR − ∆l Vi
(
)
where ∆l is used to simulate the leakage from the air manifold, which is subtracted to increase the air outflow from the intake manifold. The air leakage levels are simulated as 5%, 10%, 15% and 20% of the total air intake in the intake manifold, respectively. 2.2.3 EGR Valve Faults The normal value of EGR is about 16.67% of the total air mass flow, which is a realistic value of EGR feedback chosen for the experiments. The value of m& EGR for different fault intensities is regulated as 0%, 25%, 50%, 75% and 100% of the total EGR air mass flow. Where 0% EGR air mass flow corresponds to the EGR valve stuck up completely and 100% corresponds to full EGR air mass flow, i.e. no fault condition. 2.2.4 Temperature/Pressure Sensor Faults Temperature and pressure sensor faults are considered in four different intensities: Sensors over-reading 20% or 10% and sensors under-reading 10% or 20% of the normal value. The faulty data for the sensors is generated using multiplying factors (MFs) of 1.2, 1.1, 0.9 and 0.8 for over- or under-reading respectively. Table 1: The 17 fault and no fault states and multiplying factors No 1 2 3 4 5 6 7 8 9 10 11 12 13 14 15 16 17
Fault Name No Fault Leakage 5% Leakage 10% Leakage 15% Leakage 20% EGR stuck 25% closed EGR stuck 50% closed EGR stuck 75% closed EGR stuck 100% closed Temp. sensor 20% over reading Temp. sensor 10% over reading Temp. sensor 10% under reading Temp. sensor 20% under reading Pressure sensor 10% over reading Pressure sensor 20% over reading Pressure sensor 20% under reading Pressure sensor 10% under reading
MF
MF=1.2 MF=1.1 MF=0.9 MF=0.8 MF=1.2 MF=1.1 MF=0.9 MF=0.8
M. S. SANGHA, D. L. YU AND J. B. GOMM
186
Data are generated by the Modified MVEM with throttle angle at different values between 20o and 40o for all the fault conditions and no fault condition. The 17 states (4 faults * 4 intensities + 1 no-fault = 17) with their multiplying factors (MFs) are given in Table 1. The sample time is chosen as 0.5 sec. The engine data for the simulated faults and no fault condition covers almost all transient states of the engine dynamics. 3. RBF Network Classifier A Gaussian RBF network is chosen in the research for the fault classification. There are several training algorithms. Those used for initial off-line training and on-line updating of the RBF classifier are described. 3.1 The RBF Network Structure
Fig. 2: The RBF neural network structure The network structure is shown in Fig.2 and consists of three layers; input, hidden and d output. The input layer simply receives the network input vector x ∈ ℜ , and passes the inputs to each node in the hidden layer. The hidden layer consists of n h nodes that process the input vector. The ith node in the hidden layer contains an individual centre vector ci of the same dimension as x and a scalar width ρ i . The Euclidean distance between the input and the centre vectors is calculated, (5)
z i = x − ci = ( x1 − ci1 ) 2 + ... + ( x n − cin ) 2
where i = 1,..., nh , and passed through a non-linear basis function to produce the hidden node outputs φi . Several choices of basis function are available, e.g. thin plate spline, Gaussian function, etc. Gaussian basis functions provide a local excitation of the node with an output φi near zero for inputs far from the centre and φi near one for inputs close to the centre. This is especially suitable for classification applications and is therefore used in this work. The Gaussian basis function is defined as (6)
[
]
φi = exp − (zi ρ i ) , 2
ρi > 0
Finally the network outputs are computed as a linear weighted sum of the hidden node outputs: (7)
yˆ = Wφ
ROBUSTNESS ASSESSMENT OF ADAPTIVE FDI SYSTEM FOR ENGINE AIR PATH
187
where yˆ ∈ ℜq is the output vector, W ∈ ℜq×nh is the output layer weight matrix with element wij connecting the jth hidden node to the ith output, and φ is a vector containing the hidden node outputs. 3.2 Training Algorithms Training an RBF network means optimising the parameters of centres, widths and weights in the network. For training the non-adaptive RBF network and the initial off-line training of the adaptive network, the K-means, P-nearest neighbours and batch least squares (BLS) algorithms are used. When the adaptive classifier is used on-line, the centres remain fixed, as they have been chosen distributed in the whole operating space, while the widths and weights are adapted to minimise the classification error caused by any time-varying dynamics and model uncertainty. The widths are adapted using a gradient descent algorithm and the weights are adapted using the recursive least squares (RLS) algorithm which can be found in [24]. The K-means clustering method minimises the sum squared distances from each input data to its closest centre so that the data is adequately covered by the activation functions and the P-nearest neighbours algorithm determine width for each centre as the square root of average squares of the distances from the centre to the nearest p centres. Gradient Descent method is used for the widths of the RBF network. The width in each hidden layer node is usually chosen as a constant using the P-nearest rule. The classification is sensitive to the Gaussian local function, which is mainly characterised by the width. Therefore, a gradient descent algorithm is derived to on-line adapt the widths to achieve a minimal objective function given as follows: q
(8)
J =
∑e
2 j
,
j =1
where e j = y j − yˆ j is the jth classifier output error and yj is the jth training target. The new updated value of the width can be achieved by the following equation: (9)
ρi (k + 1) = ρ i ( k ) + 4.α .φi ( k )
x ( k ) − ci
ρi3 (k )
2
q
∑ e (k ) w (k ) j
ij
j =1
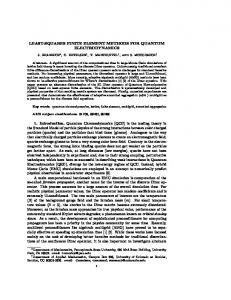
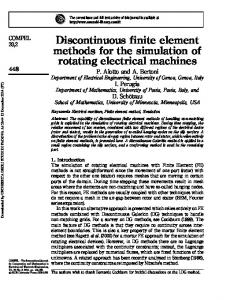
This training algorithm can update the width parameters to minimise the sum of squared error defined in (8). The complete mathematical derivation of the above equation can be found in [21]. 3.3 RBF Network Classifier The RBF network, as the fault classifier will receive all possible and relevant signals containing fault information, and has 17 outputs with each indicating one of the investigated states in Table 1. The information flow for the fault diagnosis is illustrated in Fig.3.
188
M. S. SANGHA, D. L. YU AND J. B. GOMM
Component Faults
Noise Manifold Pressure
Throttle angle input
Manifold Temperature Crankshaft Speed
MVEM
Data Conditioning
Neural Network
Fault Diagnosis NF 1 . 16
Fig.3: Information flow of the fault diagnosis According to the engine air path dynamics, four variables are chosen as the network inputs: the throttle angle, the manifold pressure, the manifold temperature and the crankshaft speed as shown in Fig.3. Two levels, 0 and 1, are used as the output targets of the classifier. Thus, the target matrix is a unity diagonal matrix of dimension 17 (when there is one training pattern for each fault) with each column being used as the classifier-training target vector. A successfully trained network will therefore diagnose the fault intensity as well as the fault type, as shown in Table 1. 4. On-Line RBF Classifier Adaptation The main contribution of this paper is that while the fault classifier diagnoses faults on-board, the classifier is adapted on-line so that the model-plant mismatch, parameter uncertainty and especially the time varying dynamics caused by mechanical wear of components and environment change can be modelled. In this way the classification error and consequently the false alarm rate can be greatly reduced. In fact, these effects are main drawbacks for the fixed parameter neural network to be used practically. The fault classification and on-line adaptation are implemented as follows. Firstly, the measurements are read into the electronic control unit (ECU). Then, the data is fed into the classifier to diagnose faults. After this, the target will be modified according to whether a fault or several faults are detected. If a fault is detected the on-line training target vector will be changed to the target vector corresponding to the occurred fault. Then the measurements and the modified target are used to update the classifier. In the adaptation, the width in each hidden node is adapted using the gradient descent algorithm in (9) and the centre locations remain fixed as previously described. This is followed by adaptation of the weights using the RLS algorithm. There are two points that should be addressed. One is to identify the occurrence of a fault. To reduce the effect of peak noise on the fault detection so as to reduce the false alarm rate, the mean absolute modelling error for each classifier output is calculated for the previous M samples as the residual, i.e. k 1 rj = (10) ∑ y j (i ) − yˆ j (i ) , j = 1, L q M i = k − M +1 and a fault is believed to be fired when
ROBUSTNESS ASSESSMENT OF ADAPTIVE FDI SYSTEM FOR ENGINE AIR PATH
(11)
189
r j ≥ rt
where k is the sample instant, rj is the residual and rt is the threshold to be designed according to the noise level. Another point is that a multi-epoch training of the width in one sample period using the gradient descent method is employed. It was found that a single iteration updating with the gradient descent method would not reach the minimum if the learning rate is chosen small, while a large learning rate will cause unstable convergence. The recursive updating of the widths runs until the following is satisfied, (12)
∂J ≤ σ , i = 1, L , nh ∂ρi
where σ is a pre-specified small positive constant, or a pre-specified number of iterations is reached. The fault diagnosis and classifier adaptation within one sample period is illustrated in Fig.4.
Collect input data and output measurements Send these data to the RBF to generate residuals Calculate (10)-(11) Is any fault reported?
Yes
No
Modify the target
Update ρ j with (9) then test if (12) is satisfied
No
Is (12) satisfied or max No of iterations reached? Yes Update weights using RLS
Fig.4: Flow chart of fault diagnosis and classifier updating 5. Implementation and Simulation 5.1 Data Collection & Normalisation In training of the fault classifier, the training data should represent the engine
M. S. SANGHA, D. L. YU AND J. B. GOMM
190
dynamics in the whole operating space. Considering practical implementation, we collect a number of sets of training data with each of which collected when engine runs in a different range of throttle angles and on different working modes. These ranges are distributed in the entire operating space from 20o to 40o and the modes include accelerating, constant speed and decelerating. These are presented in Table 2. Table 2 can be read in the way that for example, the first line has 5 data sets. In the first set the throttle angle has a step change from 22 o to 26 o, In the second set the throttle angle changed from 22 o to 30 o, etc. All together 20 sets of data are collected. Each set consists of 340 data samples for 17 no-fault and faulty states and therefore 20 samples for each state. The sampling period is 0.3 seconds. Table 2: Details of data sets collected for training and testing of RBF networks Start degree of θ 22 26 30 34 38
Accelerating
Decelerating
26, 30, 34, 38 30, 34, 38 34, 38 38 ---
--22 26, 22 30, 26, 22 34, 30, 26, 22
No. of data sets 4 4 4 4 4
It may be noted that when the engine accelerates with throttle angle increasing from 22o to 26o, the speed acceleration is different from that when it accelerates with throttle angle from 22o to 38o in the same period of time. Same is the case with deceleration and therefore the no fault and fault data is collected for different speed accelerations and decelerations. Data for three variables are collected including manifold pressure, temperature and crankshaft speed. To evaluate the robustness of the developed method to measurement noise, a noise of normal distribution with zero mean and unity variance is added to the collected data. The amplitude of the noise is set to about 2% of the average of the signal amplitude to simulate the measurement noise expected in a real engine system. The data is normalised by subtracting the steady state values at the middle operating point θ = 30o and then scaled by the same steady state value. Both training data and test data are normalised in the same way. x − x ss xnor = x ss By normalisation there will not be any input data having a much greater numerical value than others and intending to dominate the training. The four normalised variables are then used as training data for neural network. 5.2 Network Training Two RBF networks are used for fault classification, with one for non-adaptive classifier and the other for adaptive classifier. Both network have the same structure and will be trained with the same training data and using the same training algorithm. The training for the adaptive network is referred to as “initial training”. After training, the non-adaptive network will be used to do fault diagnosis with the teat data without on-line training, while the adaptive network will be used with the same test data but with on-line
ROBUSTNESS ASSESSMENT OF ADAPTIVE FDI SYSTEM FOR ENGINE AIR PATH
191
training. This establishes a fair basis for comparison between the adaptive and non-adaptive classifiers. The network input variables are chosen according to the experience in engine modelling as the four variables shown in Fig.3: throttle angle, manifold pressure, manifold temperature and crankshaft speed. Therefore the network has 4 inputs. Each network output is used to indicate occurrence of one faulty state: “0” implies that the fault does not occur while “1” implies that the fault occurs. Therefore, network has 17 outputs with each corresponds to one fault or no-fault condition. The hidden layer nodes are chosen as 60 for both networks. Then the centres increase to 150 for the non-adaptive network to evaluate the improvement. To outline, the networks have structure 4:60:17 and later, the non-adaptive network has structure 4:150:17. Two data sets, one acceleration data with θ = 26o → 34o and one deceleration data with θ = 34o → 26o will be used as test data, all the remain 18 sets are used as training data. As each training data set has the same pattern for 17 faults, one training target matrix Xo (Fig 5) is formed and used for all the training data sets. Xo has 340 rows and 17 columns. Its first column has ones from the first row to 20th row and the other entries are zeros, the second column has ones from the 21st row to the 40th row and the other entries are zeros, the last column has ones from the 321st row to the 340th row and the other entries are zeros. This is as shown in Fig 5. Thus, the transpose of the ith row in Xo is used as the training target vector for the ith training pattern. The 60 centres are chosen using the K-means clustering algorithm from the training data sets. The widths were chosen using the P-nearest neighbours’ algorithm, and the weights were trained using the Recursive Least Squares algorithm. Row Numbers Xo 1 ~ 20 21 ~ 40 M
321 ~ 340
⎡1 ⎢0 ⎢ ⎢0 ⎢ ⎢0 ⎢0 ⎢ ⎣M
0 1 M
0 L O
0
0
O 1
L⎤ ⎥ ⎥ ⎥ ⎥ ⎥ ⎥ ⎥ O⎦
Fig 5: Target matrix Xo 5.3 Fault Diagnosis After training with the training data sets, the two networks are used to diagnose faults with the 2 test data sets described in the above and another data set when the throttle angle is constant, 30o. The classification results of the non-adaptive network are displayed in Fig.6. The adaptive network is used to classify the faults in the on-line mode with network adaptation as illustrated in the flow chart in Fig.4, where M in (10) was chosen as M = 1 (to see the residuals before the treatment), the fault detection threshold in (11) was chosen as rt = 0.5 . High thresholds may lead to missed detections whilst low thresholds will cause false alarms. rt is chosen as 0.5 by utilising experience in minimising false alarm rate. The simulation is run for different values of rt and rt = 0.5 (mean value of two target values i.e. 0 and 1) is chosen for minimal false alarm rate. Mathematically rt should be a little bit higher than 0.5 according to the level of noise in the testing data. But rt = 0.5 is found as a good compromise between reliability
M. S. SANGHA, D. L. YU AND J. B. GOMM
192
of detection and insensitivity to noise. The threshold for the gradient of the objective function in (12) was chosen as σ = 0.00001 . The forgetting factor for the RLS algorithm in was chosen a constant value of λ = 0.99 . The diagnosis results are shown in Fig.7. Then, the centres of the non-adaptive network are increased to 150. The fault detection results are displayed in Fig.8. To see residuals more clearly, the outputs of the adaptive classifier in Fig.7 (b) are displayed separately in Fig.9. It is clearly seen in Fig.6 that the non-adaptive classifier with 60 centres are not able to classify the simulated faults to an acceptable level. Whilst the adaptive network clearly classifies the faults (see Fig.7 and 9) with just a few peak values that may cause false alarm when 0.5 is used as the fault detection threshold. Further more, if M in (10) is chosen as 3 or greater, the averaged residual will be greatly reduced and the false alarm rate will be zero. .It can also be seen in Fig.8 that even with the much more centres 150, though the performance is improved, it still has many misclassifications and is still not as good as the adaptive method. In addition, 150 centres greatly increase the computing load and are more difficult to implement in practice. Non-adaptive classifier, RBF Hidden Nodes=60, Tested for throttle angle 26-34 1 0.5 0 0
50
100
150
200
250
(a)
300
340 samples
Non-adaptive classifier, RBF Hidden Nodes=60, Tested for throttle angle 34-26 1 0.5 0 0
50
100
150
200
250
(b)
300
340 samples
Non-adaptive classifier, RBF Hidden Nodes=60, Tested for throttle angle 30-30 1 0.5 0 0
50
100
150
200
250
300
(c) 340 samples Fig.6: Test results of the non-adaptive classifier Adaptive classifier, RBF Hidden Nodes=60, Tested for throttle angle 26-34 1 0.5 0 0
50
100
150
200
250
300
ROBUSTNESS ASSESSMENT OF ADAPTIVE FDI SYSTEM FOR ENGINE AIR PATH
(a)
340 samples
Adaptive classifier, RBF Hidden Nodes=60, Tested for throttle angle 34-26 1
Adaptive classifier, RBF Hidden Nodes=60, Tested for throttle angle 30-30 0.5
1 0
0.5
0
50
100
150
200
250
(b)
0 0
50
100
150
300
340 samples 200
250
(c) Fig.7: Test results of Adaptive classifier
300
340 samples
Non-adaptive classifier, RBF Hidden Nodes=150, Tested for throttle angle 26-34 1 0.5 0 0
50
100
150
200
250
(a)
300
340 samples
Non-adaptive classifier, RBF Hidden Nodes=150, Tested for throttle angle 34-26 1 0.5 0 0
50
100
150
200
250
(b)
300
340 samples
Non-adaptive classifier, RBF Hidden Nodes=150, Tested for throttle angle 30-30 1 0.5 0 0
50
100
150
200
250
300
(c) 340 samples Fig.8: Test results of non-adaptive classifier with 150 hidden nodes
193
M. S. SANGHA, D. L. YU AND J. B. GOMM
194
Adaptive Classifier, RBF hidden nodes = 60, Tested for throttle angle 34-26 1 0.5 0
1 0.5 0 0
100
200
300
1 0.5 0
0
100
200
300
0
100
200
300
0
100
200
300
0
100
200
300
0
100
200
300
0
100
200
300
0
100
200
300
0
100
200
300
1 0.5 0 0
100
200
300
1 0.5 0
1 0.5 0 0
100
200
300
1 0.5 0
1 0.5 0 0
100
200
300
1 0.5 0
1 0.5 0 0
100
200
300
1 0.5 0
1 0.5 0 0
100
200
300
1 0.5 0
1 0.5 0
0 1 0.5 0 0 1 0.5 0 0
100
200
300 1 0.5 0
100
100
200
200
300
300
Left and right hand columns show results for state No. 1,3,5,7,9,11,13,15,17 and 2,4,6,8,10,12,14,16 respectively
Fig.9: Each output displayed separately for the result in Fig.7 (b) The results displayed in (a) and (b) in Fig.6-8 are for the data without noise but with operating point (throttle angle) variations. To validate the ability of the neural network to be tolerant to noise, fault diagnosis with noisy data is also conducted. The same training and test data sets were added with the random noise described in Section 5.1. The same tests were repeated with the noisy data for the both networks and the similar classification results are achieved. It is seen that the classification is not sensitive to the noise. It is again observed that the adaptive on-line diagnosis with 60 hidden nodes gives much better results than the non-adaptive, off-line trained network with 60 hidden nodes and even 150 hidden nodes. The on-line learning utilises the fault detection result so that faults are not learned as dynamics changes. 6. Robustness Assessment of FDI System Robustness assessment is carried out by introducing a speed-feedback control into the MVEM simulation system. In real life the speed feedback is done and controlled by a human element (driver of automotive) by reading the speedometer and then adjusting the throttle angle (by increasing/decreasing foot pressure on the accelerator paddle) accordingly. But in MVEM simulation a PID controller is used in place of an automotive driver. Robustness assessment of the FDI system is carried out in the following four different
ROBUSTNESS ASSESSMENT OF ADAPTIVE FDI SYSTEM FOR ENGINE AIR PATH
195
Crankspeed (kRPM)
modes in increasing generality of engine operation: (1) Different reference throttle angle inputs (a) Fixed reference signal (b) Sinusoidal / Saw-tooth reference signal (2) Load change (3) Engine parameter change (4) All the changes above i.e. 1, 2 and 3 happening together In order to find suitable values for the PID controller a set of five random values in the range of 2 kRPM to 3.5 kRPM are applied as reference signal. Each random speed is sustained for 6 seconds before the speed signal is changed to next value. The random speed signal in the input is sustained for six seconds because the outputs of the simulation reach to a steady state value in about six seconds. The data is sampled every 0.5 seconds and therefore 12 data points are collected in every six seconds time. 4
Reference signal Crankshaft speed
3
2
0
12
24
36
48
60
Fig 10: No fault outputs for five random speed reference signals
Reference
PID
From Workspace1
PID Controller
Throttle Position
angle To Workspace1
inlet Temp Ti2 a n2
2
pi2 dmat2dt dmap2dt
Manifold Pressure
Ti2
t To Workspace2
pi2 dmat2dt
Ti2
dmap2dt
Temperature
inlet Pressure
1 pi2
p To Workspace3
dmap2dt pi2
Load From Workspace 2
n2
Lv
Crankshaft Speed
Crank Speed
3
w To Workspace4
n2
Fig 11: Simulink model of MVEM with crankshaft speed feedback No fault output response of crankshaft speed for five different reference signals is shown in Fig 10 and the simulation diagram is shown in Fig 11. The output crankshaft speed follows the input reference speed without much overshoot/undershoot and therefore these PID settings are suitable for the further experiment. 6.1 Different Reference Crankshaft Speed Inputs
M. S. SANGHA, D. L. YU AND J. B. GOMM
196
Three different reference signals 2.5 kRPM, 3.0 kRPM and 3.5 kRPM are chosen as Ref1, Ref2 and Ref3 respectively. No fault and faulty data is collected for all the three reference signals and then both the non adaptive and the adaptive RBF neural network classifiers are trained and tested for six different sets of data and results for training NN on Ref1 and testing on Ref3 data are shown in Fig 12 and 13. Non-adaptive classifier, RBF Hidden Nodes=100, speed fed back & fixed load; Trained on ref1 & tested on ref3 1 0.8 0.6 0.4 0.2 0 -0.2
0
20
40
60
80
100
120
140
160
180
200
(a) Adaptive classifier, RBF Hidden Nodes=100, Trained for ref1 Tested for ref3 & normal load 1 0.8 0.6 0.4 0.2 0 -0.2
0
20
40
60
80
100
120
140
160
180
200
(b) Fig 12: Networks trained on Ref1 and tested on Ref3, (a) Non-adaptive, (b) Adaptive On comparison it is found that adaptive classifier has performed far better than non adaptive classifier. Unlike non-adaptive classifier, the adaptive classifier is able to identify all the faults with less than 4.4% (i.e. 9/204) misclassification. For clarity the Fig 12(b) is shown in an expanded form in Fig 13 with every fault classification shown separately.
ROBUSTNESS ASSESSMENT OF ADAPTIVE FDI SYSTEM FOR ENGINE AIR PATH
1 0.5 0
197
1 0.5 0 0
50
100
150
200
1 0.5 0
0
50
100
150
200
0
50
100
150
200
0
50
100
150
200
0
50
100
150
200
0
50
100
150
200
0
50
100
150
200
0
50
100
150
200
0
50
100
150
200
1 0.5 0 0
50
100
150
200
1 0.5 0
1 0.5 0 0
50
100
150
200
1 0.5 0
1 0.5 0 0
50
100
150
200
1 0.5 0
1 0.5 0 0
50
100
150
200
1 0.5 0
1 0.5 0 0
50
100
150
200
1 0.5 0
1 0.5 0 0
50
100
150
200
1 0.5 0
1 0.5 0 0
50
100
150
200
0
50
100
150
200
1 0.5 0
Left and right hand columns show results for state No. 1,3,5,7,9,11,13,15,17 and 2,4,6,8,10,12,14,16 respectively
Fig 13: Details of each fault classification in Fig 12 (b) shown separately for clarity. The fault and no fault data for sinusoidal and saw-tooth speed reference signals is also collected for training and testing of both networks. The test results are shown in Fig 14. Non-adaptive classifier, Hidden Nodes=90, Trained on saw-tooth and tested on sinusoidal throttle 1 0.8 0.6 0.4 0.2 0 -0.2
0
20
40
60
80
100
120
140
160
180
200
(a) Adaptive classifier, Hidden Nodes=90, Trained on saw-tooth throttle and tested on sinusoidal throttle 1 0.8 0.6 0.4 0.2 0 -0.2
0
20
40
60
80
100
(b)
120
140
160
180
200
M. S. SANGHA, D. L. YU AND J. B. GOMM
198
1 0.5 0
1 0.5 0 0
50
100
150
200
1 0.5 0
0
50
100
150
200
0
50
100
150
200
0
50
100
150
200
0
50
100
150
200
0
50
100
150
200
0
50
100
150
200
0
50
100
150
200
0
50
100
150
200
1 0.5 0 0
50
100
150
200
1 0.5 0
1 0.5 0 0
50
100
150
200
1 0.5 0
1 0.5 0 0
50
100
150
200
1 0.5 0
1 0.5 0 0
50
100
150
200
1 0.5 0
1 0.5 0 0
50
100
150
200
1 0.5 0
1 0.5 0 0
50
100
150
200
1 0.5 0
1 0.5 0 0
50
100
150
200
0
50
100
150
200
1 0.5 0
Left and right hand columns show results for state No. 1,3,5,7,9,11,13,15,17 and 2,4,6,8,10,12,14,16 respectivel
(c) Fig 14: Networks trained on saw-tooth and tested on sinusoidal reference signal, (a) Non-adaptive classifier, (b) Adaptive classifier and (c) Details of each fault classification in b shown separately for clarity. The adaptive network has performed much better than non-adaptive network and the misclassification is below 8% in case of adaptive network. The misclassification rate is high but it may be noted that sinusoidal throttle angle input is one of the worst case scenarios which may not occur in real life with a vehicle running on road. Both the networks are also trained on sinusoidal throttle angle input and tested on saw-tooth throttle angle input and similar results are achieved. 6.2 LOAD CHANGE
Load in N-m
Sinosoidal Load change 2 0 -2 0
.5
1
1.5
2
2.5 3 3.5 Time in seconds --->>>
4
4.5
5
5.5
6
ROBUSTNESS ASSESSMENT OF ADAPTIVE FDI SYSTEM FOR ENGINE AIR PATH
199
(a) In this part of the experiment the reference signal is kept fixed but the load on the engine is changed in sinusoidal and saw-tooth style as shown in Fig 15 (a) and (b). Saw-tooth load change
Load in N-m --->>>
4 3 2 1 0
0
.5
1
1.5
2
2.5 3 3.5 Time in seconds --->>>
4
4.5
5
5.5
6
5.5
6
(b) No fault response for Saw-tooth load change
0.2 0 -0.2
Throttle Angle Manifold Pressure Manifold Temperature Crankshaft Speed
-0.4 -0.6 -0.8
0
.5
1
1.5
2
2.5 3 3.5 Time in seconds --->>>
4
4.5
5
(c) Fig 15: (a) Sinusoidal load change (b) Saw-tooth load change and (c) No fault response for Saw-tooth load change The change in load (in Newton-meter) is applied through variable “Lv” as shown in simulation diagram in Fig 10. In case of sinusoidal load change, the load on vehicle (engine) can be negative for some time and this represents down the hill running of vehicle. Similarly increase in load represents up the hill running of the vehicle. Two sets of data are collected for no fault and faulty conditions; first set of data for sinusoidal change in load and the second set for saw-tooth change in load. The reference input signal is kept constant at 2.5kRPM for both the data sets. First of all both the networks are trained with data for sinusoidal load change and tested with data for saw-tooth load change and then vice-versa. With both the data sets the classification results were found satisfactory. The classification test results for both the classifiers when tested for sinusoidal load change are shown in Fig (16). The results of non-adaptive classifier are not good (Fig 16 a) and it is not able to identify different faults, where as the adaptive classifier is able to identify the all the faults (Fig 16 b and c). The misclassification rate for adaptive classifier for these results is below 5%.
M. S. SANGHA, D. L. YU AND J. B. GOMM
200
Non-adaptive classifier, Hidden Nodes=90, Trained on Saw-tooth load, tested on sinusoidal load change 1 0.8 0.6 0.4 0.2 0 -0.2
0
20
40
60
80
100
120
140
160
180
200
(a) Adaptive classifier, Hidden Nodes=90, Trained on Saw-tooth load, Tested on sinusoidal load change 1 0.8 0.6 0.4 0.2 0 -0.2
0
12
24
36
48
60
72
84
96
108
120
132
144
156
168
180
192
204
(b)
1 0.5 0
1 0.5 0 0
50
100
150
200
1 0.5 0
0
50
100
150
200
0
50
100
150
200
0
50
100
150
200
0
50
100
150
200
0
50
100
150
200
0
50
100
150
200
0
50
100
150
200
0
50
100
150
200
1 0.5 0 0
50
100
150
200
1 0.5 0
1 0.5 0 0
50
100
150
200
1 0.5 0
1 0.5 0 0
50
100
150
200
1 0.5 0
1 0.5 0 0
50
100
150
200
1 0.5 0
1 0.5 0 0
50
100
150
200
1 0.5 0
1 0.5 0 0
50
100
150
200
1 0.5 0
1 0.5 0 0
50
100
150
200
0
50
100
150
200
1 0.5 0
Left and right hand columns show results for state No. 1,3,5,7,9,11,13,15,17 and 2,4,6,8,10,12,14,16 respectively
(c) Fig 16: Networks trained on saw-tooth load and tested on sinusoidal load, (a) Results for Non-adaptive classifier, (b) Results for Adaptive classifier and (c) Details of each fault classification in b shown separately for clarity.
ROBUSTNESS ASSESSMENT OF ADAPTIVE FDI SYSTEM FOR ENGINE AIR PATH
201
6.3 Parameter Change In order to check the robustness of the classifier against the aging effect of the engine, the data for 1% increased engine displacement is collected. Both the classifiers are trained for the normal engine data and then tested on the data from increased engine displacement. In this part of the experiment the speed reference signal and the load on the engine are kept constant. Non-adaptive classifier, Nodes=60, Trained on normal, tested on 1% increased Engine displacement 1 0.5 0 0
20
40
60
80
100
120
140
160
180
200
(a) Adaptive classifier, Nodes=60, Trained on normal & Tested on 1% increased engine displacement 1 0.5 0 0
20
40
60
80
100
120
140
160
180
200
(b)
1 0.5 0
1 0.5 0 0
50
100
150
200
1 0.5 0
0
50
100
150
200
0
50
100
150
200
0
50
100
150
200
0
50
100
150
200
0
50
100
150
200
0
50
100
150
200
0
50
100
150
200
0
50
100
150
200
1 0.5 0 0
50
100
150
200
1 0.5 0
1 0.5 0 0
50
100
150
200
1 0.5 0
1 0.5 0 0
50
100
150
200
1 0.5 0
1 0.5 0 0
50
100
150
200
1 0.5 0
1 0.5 0 0
50
100
150
200
1 0.5 0
1 0.5 0 0
50
100
150
200
1 0.5 0
1 0.5 0 0
50
100
150
200
0
50
100
150
200
1 0.5 0 Left and right hand columns show results for state No. 1,3,5,7,9,11,13,15,17 and 2,4,6,8,10,12,14,16 respectively
(c)
M. S. SANGHA, D. L. YU AND J. B. GOMM
202
Fig 17: Networks trained on normal and tested on 1% increased engine displacement, (a) Non-adaptive classifier, (b) Adaptive classifier and (c) Details of each fault classification in b shown separately for clarity. Again in this part of the experiment it is found that the performance of adaptive classifier (Fig 17 b and c) is much better than non-adaptive classifier (Fig 17 a) and the misclassification rate is below 5%. 6.4 All the Changes Happening Together Non-adaptive classifier, Nodes=90, Trained on 2.5kRPM throttle, no load change, no dispalcement change and Tested on Saw-tooth throttle change, Sinusoidal load change and 1% increased engine displacement 1 0.8 0.6 0.4 0.2 0 -0.2
0
20
40
60
80
100
120
140
160
180
200
(a) Adaptive classifier, Nodes=90, Trained on 2.5kRPM reference throttle angle, no load change, no dispalcement change and Tested on Saw-tooth throttle change, Sinusoidal load change and 1% increased engine displacement 1 0.8 0.6 0.4 0.2 0 -0.2
0
20
40
60
80
100
120
140
160
180
200
(b) (c) Fig 18: Networks trained on fixed reference and tested on saw-tooth reference, sinusoidal load change and 1% increased engine displacement (a) Non-adaptive, (b) Adaptive classifier and (c) Details of each fault classification in b shown separately for clarity. In this section data is collected for all the changes happening together i.e. when the reference is a saw-tooth signal, the load is changing in sinusoidal style and the engine displacement is increased by 1%. Both non-adaptive and adaptive classifiers are trained on data with fixed reference, no change in load and no increase in engine displacement and then tested with the data when all the changes happening together. The results in Fig 18 show that adaptive classifier performs very well as compared to non-adaptive classifier (Fig 18 a). The misclassification rate for adaptive classifier (Fig 18 (b) and (c) is less than 5%. 7. Conclusions An on-line adaptive RBF based FDI method is proposed for SI engines and tested for robustness. The classifier is adapted for its widths and weights to learn changes in the system dynamics and environment. To avoid that the classifier also learns the faults as the changes of dynamics, the on-line learning target is modified according to the fault
ROBUSTNESS ASSESSMENT OF ADAPTIVE FDI SYSTEM FOR ENGINE AIR PATH
203
diagnosis result. Therefore, this scheme will still work after one fault is detected. The assessment results on the mean value engine model show that the four simulated faults with different fault sizes are clearly diagnosed. The results are much better than that by a non-adaptive classifier in terms of much lower misclassification rate and much smaller network size. Small network is easier to realise and is much faster for real time implementation as compared to big network. The developed adaptive method is robust to engine dynamics changes including the engine-to-engine differences caused by batch production and the parameter variation caused by long-term mechanical wear of engine components, as well as noise. It shows robustness to change of load, change in running conditions (acceleration/deceleration, constant speed run and quick changes in engine speed) and changes due to aging of the engine (increase in engine displacement). Therefore, it is promising to implement it in the ECU and use it for on-board fault diagnosis. 8. Further Work The developed method may not be sensitive to very slowly developing incipient faults, as these faults would be treated as system uncertainty and be ignored by the network. Further work will tackle this problem with the on-line fault estimation method [25]. The developed method will be further evaluated with simulated faults on an engine test bed and has a possibility of implementation in a real car. As the network size is quite small, it can be coded in a digital signal processor (DSP) for real time implementation. Authors in [17] have demonstrated the applicability to on-board control units by prototype implementation on a DSP which allowed dynamic and diagnostic performances in on-line conditions to be verified. Further it has a possibility of inclusion of DSP in a commercial ECU (electronic control unit) of an automotive engine. The method can classify the predefined faults that have been considered for the training of the neural network but cannot diagnose the faults which have not been predefined. The classification of unknown faults and simultaneously occurred multi-faults are also considered for the future work. Acknowledgement The first author would like to thank the ORSAS of the U.K. for financial support. References [1] Nyberg, M. and Stutte, T., Model based diagnosis of the air path of an automotive diesel engine, Control Engineering Practice, Vol. 12, pp. 513-525, 2004. [2] Frank, P.M., Analytical and Quantitative Model-Based Fault Diagnosis – A Survey and some new results, European Journal of Control, Vl. 2, pp. 6-28, 1996. [3] Isermann, R. and Balle, P., Trends in the application of model-based fault detection and diagnosis of technical processes, Control Engineering Practice, Vol. 5, no. 5, pp. 709-719, 1997. [4] Nyberg, M. and Nielsen, L., Model based diagnosis for the air intake system of SI engine, Journal of Commercial Vehicles, SAE Transaction, Vol. 106, pp. 9-20, 1997. [5] Kimmich, F., Schwarte, A. and Isermann, R. Fault detection for modern diesel engines using signal and process model-based methods, Control Engineering Practice, Vol. 13, pp. 189-203, 2005. [6] Gertler, J., Costin, M., Fang ,X., Hira, R., Kowalczuk, Z. and Luo, Q., Model based on board
204
M. S. SANGHA, D. L. YU AND J. B. GOMM
fault detection and diagnosis for automotive engines, Control Engineering Practice, Vol. 1, No. 1, pp. 3-17, 1993. [7] Gertler, J., Costin, M., Fang, X., Kowalczuk, Z., Kunwer, M., and Monajemy, R., Model based diagnosis for automotive engines – algorithm development and testing on a production vehicle, IEEE Trans. on Control Systems Technology, Vol. 3, No. 1, pp. 61-69, 1995. [8] Luo, Jianhui, Tu, F., Azam, M., Pattipati, K., Willett, P., Qiao, L. and Kawamoto, M., Intelligent model-based diagnostics for vehicle health management, Proc. of SPIE, vol. 5107, Security and condition monitoring issue III, pp. 13-26, 2003. [9] Yong-Wha, Kim, Automotive Engine Diagnosis and Control via Nonlinear Estimation, IEEE Control Systems Magazine, Vol. 34, pp. 84-99, 1998. [10] Nyberg, M. and Krysander, M., Combining AI, FDI, and statistical hypothesis-testing in a framework for diagnosis, Proc. of IFAC Symposium Safeprocess’ 03, Washington, USA, 2003. [11] Lu, Y. Chen, Q. T. and Brennan, H., A fuzzy system for automotive fault diagnosis: Fast rule generation and self-tuning, IEEE Trans. on Vehicular Technology, Vol. 49, No. 2, pp. 651-660, 2000. [12] Hissel, D., Pera, C. M., and Kauffmann, M. J. Diagnosis of automotive fuel cell power generator, Journal of Power Sources, Vol. 128, pp. 239-246, 2004. [13] Barigozzi, A., Magni, L., and Scattolini, R., A probabilistic approach to diagnosis of industrial systems, IEEE Trans. on Control Systems Technology, Vol. 12, No. 6, pp. 950-955, 2004. [14] Principe, J. C., Euliano, N. R. and Lefebvre, W. C., Neural and Adaptive Systems: Fundamentals Through Simulations, John Wiley & Sons, Inc., 2000. [15] Manzie, C., Palaniswami, M. and Watson, H., Gaussian networks for fuel injection control, Proc Instn Mech Engrs, Part D, Automobile Engineering, Vol. 215, pp. 1053-1068, 2001. [16] Jakubek, S. and Strasser, T., Fault diagnosis using neural networks with ellipsoidal basis functions, Proc. of American Control Conference, May 8-10, Anchorage, AK, pp. 3846-3851, 2002. [17] Capriglione, D., Liguori, C., Pianese, C. and Pietrosanto, A.., On line sensor fault detection, isolation and accommodation in automotive engines, IEEE Trans. on Instrumentation and Measurement, Vol. 52, No. 4, pp. 1182-1189, 2003. [18] Shayler, J. P., Goodman, M. and Ma, T., The exploitation of neural networks in automotive engine management systems, Engineering Applications of Artificial Intelligence, Vol. 13, pp. 147-157, 2000. [19] Sorsa, T. and Koivo, H. N., Applications of artificial neural networks in process fault diagnosis. Automatica, 29(4), pp 843-849, 1993. [20] Sangha M. S., Gomm J. B., Yu D. L., Page G. F., An investigation of Neural Networks in fault diagnosis of an auto motive engine air path, 2nd ASIM Workshop, Wismar, Germany – Modelling, control and diagnostics of combustion engine processes, September 16-17, pp 23-32, ISBN 3-901608-27, 2004. [21] Sangha M. S., Yu D. L., Gomm J. B., On-board monitoring and diagnosis for spark ignition engine air path via adaptive neural networks, accepted in Proceedings of IMechE, Journal of Automobile Engineering, Vol. 220 Part D, 2006. [22] Hendricks, E., Engler, D. and Fam, M., A Generic Mean Value Engine Model for Spark Ignition Engines. Institute of Automation, Denmark Technical University, www.iau.dtu.dk/~eh/T, 2000. [23] Reineman, M., Effectiveness of OBD II Evaporative Emission Monitors – 30 Vehicle Study, U.S. Environmental Protection Agency Report, EPA420-R-00-018, October 2000. [24] Ljung, L., System Identification---Theory for the User, 2nd edition, Prentice-Hall, pp. 361-369,
ROBUSTNESS ASSESSMENT OF ADAPTIVE FDI SYSTEM FOR ENGINE AIR PATH
205
1999. [25] Zhang, Xiaodong, Polycarpou, M. M. and Parisini, T., A robust Detection and Isolation Scheme for Abrupt and Incipient Faults in Nonlinear Systems. IEEE Trans. Automatic Control, Vol.47, No.4, pp. 576-593, 2002.
M. S. Sangha is presently studying for a PhD degree from Liverpool John Moores University (LJMU), UK. He did B.Eng. (Electrical) form University of Jodhpur, India in 1991 and M.Sc. (Intelligent Control) from LJMU in 2005. He worked in an electricity distribution company for about 12 years. His research interests are fault diagnosis in an automotive engine and neural networks. He has had many publications in these fields.
Dingli Yu received the B. Eng degree from Harbin University of Civil Engineering, China in 1982, the M. Sc degree from Jilin University of Technology (JUT), China in 1986, and the PhD degree from Coventry University, U.K. in 1995, all in Electrical Engineering. Dr. Yu was a lecturer at JUT from 1986 to 1990 before he came to University of Salford as a visiting researcher in 1991. He then worked at Liverpool John Moores University as a post-doctoral researcher since 1995 and became a lecturer in 1998, where He is currently a Professor of Control Systems. His current research interests include fault detection and fault tolerant control of bilinear and nonlinear systems, adaptive neural networks and their control applications, model predictive control for chemical processes and engine systems.
J. Barry Gomm received the BEng first class degree in electrical and electronic engineering in 1987 and the PhD degree in process fault detection in 1991 from Liverpool John Moores University (JMU), UK. He joined the academic staff in the School of Engineering at JMU in 1991 and is a Reader in Intelligent Control Systems. He was coeditor of the book Application of Neural Networks to Modelling and Control (London, UK: Chapman and Hall, 1993) and Guest Editor for special issues of the journals Fuzzy Sets and Systems (Amsterdam, the Netherlands: Elsevier, 1996) and Transactions of the Institute of Measurement and Control (London, UK: InstMC, 1998). He is currently organising a special issue of the International Journal of Modelling, Identification and Control (Geneve, Switzerland: Inderscience). He has published more than 100 papers in international journals and conference proceedings. Dr Gomm is a member of the IEE and IEEE, and has served on the organising committees of several conferences. His current research interests include neural networks for modelling, control and fault diagnosis of non-linear processes, intelligent methods for control, system identification, adaptive systems and chemical process application.
Control Systems Research Group, School of Engineering, Liverpool John Moores University, Byrom Street, Liverpool L3 3AF, U.K. Email:
[email protected] http://www.ljmu.ac.uk/ENG/72971.htm