singular value decomposition (SVD) is used to create a la- tent semantic space. ... In [6], a self- organizing map analysis of word contexts was performed with.
Linguistic Feature Extraction using Independent Component Analysis Timo Honkela
Aapo Hyv¨arinen
Helsinki University of Technology Neural Networks Research Center Laboratory of Computer and Information Science http://www.cis.hut.fi/tho
HIIT Basic Research Unit Department of Computer Science University of Helsinki http://www.cs.helsinki.fi/aapo.hyvarinen
Abstract— Our aim is to find syntactic and semantic relationships of words based on the analysis of corpora. We propose the application of independent component analysis, which seems to have clear advantages over two classic methods: latent semantic analysis and self-organizing maps. Latent semantic analysis is a simple method for automatic generation of concepts that are useful, e.g., in encoding documents for information retrieval purposes. However, these concepts cannot easily be interpreted by humans. Self-organizing maps can be used to generate an explicit diagram which characterizes the relationships between words. The resulting map reflects syntactic categories in the overall organization and semantic categories in the local level. The self-organizing map does not, however, provide any explicit distinct categories for the words. Independent component analysis applied on word context data gives distinct features which reflect syntactic and semantic categories. Thus, independent component analysis gives features or categories that are both explicit and can easily be interpreted by humans. This result can be obtained without any human supervision or tagged corpora that would have some predetermined morphological, syntactic or semantic information.
I. I NTRODUCTION A word can belong to several syntactic categories simultaneously. The number of categories is even higher if one takes into account the semantic categories. Traditionally, such categorization is determined by hand: the categories into which a word belongs to are described in a dictionary. In the following, we will study the emergence of linguistic representations through the analysis of words in contexts. First, we give a general description of the approach and describe two methods that have widely been used for the analysis, latent semantic analysis and self-organizing map. Then we introduce a novel approach based on independent component analysis. A. Analysis of Words in Contexts Contextual information has widely been used in statistical analysis of natural language corpora (consider, e.g., [20], [2], [22], [16]). Handling computerized form of written language rests on processing of discrete symbols. How can a symbolic input such as a word be given to a numeric algorithm? Similarity in the appearance of the words does not usually correlate with the content they refer to. As a simple example one may consider the words “window”, “glass”, and “widow”. The words “window” and “widow” are phonetically close to
each other, whereas the semantic relatedness of the words “window” and “glass” is not reflected by any simple metric. One useful numerical representation can be obtained by taking into account the sentential context in which the words occur. First, we represent each word by a vector in an ndimensional space, and then code each context as an average of vectors representing the words in that context. In the simplest case, the dimension n can be taken equal to the number of different words, and each word is represented by a vector with one element equal to one and others equal to zero. Then the context vector simply gives the frequency of each word in the context. In information retrieval, a similar approach is called bag-of-words (cf. vector space model [21]). For computational reasons, however, the dimension may be reduced by different methods. A classic method for reducing the dimension in a vector space model is latent semantic analysis that will be described next. B. Latent Semantic Analysis In latent semantic analysis [4], a technique known as singular value decomposition (SVD) is used to create a latent semantic space. First, a term-by-document matrix A is generated. Every term is represented by a row in matrix A, and every document is represented by a column. An individual entry in A, aij , represents the frequency of the term i in document j. Next, SVD is used to decompose matrix A into three separate matrices. The first matrix is a term by concept matrix B. The second matrix is a concept by concept matrix C. The third matrix is a concept by document matrix D. This is a special case of the coding of contexts explained in above: the context is one whole document in the LSA. In [15] the LSA is described in terms of learning and cognitive science. The claim is that the LSA acquired knowledge about the full vocabulary of English at a comparable rate to school-children. The development of the LSA has also been motivated by practical applications [7]. One problem with the LSA is that the concept space is difficult to understand by humans. The self-organizing map, that will be introduced in the next section, creates a visual display of the analysis results which is readily understandable for a human viewer.
II. DATA AND
C. Self-Organizing Map of Words The self-organizing map has been used in the analysis of word context data, e.g., by [20] (artificially generated short sentences), and [9] (Grimm fairy tales). In [6], a selforganizing map analysis of word contexts was performed with a one-dimensional map in order to find synonymous words. The result can be called a self-organizing map of words, or a word category map. Earlier, the name self-organizing semantic map has also been used. Similar results have also been presented by Miikkulainen [17], [18], [19]. Consider [20], [9] and [8] for more thorough analysis and explanation of the methodology. Areas or local regions on a word category map can be considered as implicit categories or classes that have emerged during the learning process. Single nodes in the map can be considered as adaptive prototypes. Each prototype is involved in the adaptation process in which the neighbors influence each other and the map is gradually finding a form in which it can best represent the input. The emergent categories on a word category map are implicit. The borderlines for any categories have to be determined separately. It would be beneficial if one could find the categories in an automated analysis. Moreover, each word appears in one location of the map. This means, among other things, that one cannot have a map in which several characteristics or categories of one word would be represented unless the categories overlap and accordingly the corresponding areas of the map overlap. In some cases, this is the case: it is possible to see the area of modal verbs inside the area of verbs, e.g., in the map in [9]. However, one might wish to find a sparse encoding of the words in such a way that there would be a collection of features associated with each word. For instance, a word can be a verb, a copula (a verb that connects the subject to the complement) and in past tense. It is an old idea in linguistics to associate words with features. The features can be syntactic as well as semantic like proposed already in [5]. However, in traditional linguistic analysis these features are given by hand, and the membership is crisp.
D. Data Collection and Analysis by ICA In the following, we propose the use of independent component analysis (ICA) [3], [13], [11] for the extraction of linguistic features from text corpora and present a detailed methodological description. ICA learns features in an unsupervised manner. Several such features can be present in a word, and ICA gives the explicit values of each feature for each word. We expect the features to coincide with known syntactic and semantic categories: for instance, we expect ICA to be able to find a feature that is shared by words such as “must”, “can” and “may”. In earlier studies, independent component analysis has been used for document level analysis of texts (see, e.g., [12], [14], [1]).
METHODS
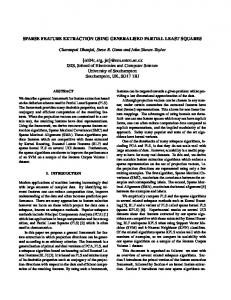
A. Data collection The data used in the experiments consists of collection of e-mails sent to the connectionists mailing list1 . The texts were concatenated into one file. Punctuation marks were removed and all uppercase letters were replaced by the corresponding lowercase letters. The resulting corpus consists of 4, 921, 934 tokens (words in the running text) and 117, 283 types (different unique words). For our analysis, one hundred common words were manually selected and the contextual information was calculated using the 2000 most common types in the following way. We formed a context matrix C in which cij denotes the number of occurrences of the jth word in the immediate context of ith word, i.e, ith word followed by jth word with no words between them. This provided a 100 × 2000 matrix that is illustrated in Fig. 1.
Fig. 1.
An illustration of a matrix with contextual data.
A logarithm of the number of occurrences was taken in order a reduce the effect of the very most common words in the analysis. B. Independent component analysis We will give a brief outline of the basic theory of independent component analysis [11]. The classic version of the ICA model can be expressed as x = As
(1)
where x = (x1 , x2 , . . ., xn )T is the vector of observed random variables, the vector of the independent latent variables is denoted by s = (s1 , s2 , . . . , sn )T (the “independent components”), and A is an unknown constant matrix, called the mixing matrix. If we denote the columns of matrix A by aj the model can be written as n X x= ai si (2) i=1
The goal in ICA is to learn the decomposition in Eq. (1) in an unsupervised manner. That is, we only observe x and want to estimate both A and s. ICA can be seen as an extension to principal component analysis and factor analysis which 1 http://www-2.cs.cmu.edu/afs/cs.cmu.edu/project/connect/connectarchives/
underlie LSA. However, ICA is a more powerful technique capable of finding the underlying factors when the classic methods would fail. The starting point for the ICA is the simple assumption that the si are statistically independent. Two variables, y1 and y2 , are independent if information on the value of y1 does not give any information on the value of y2 , and vice versa. This does not need to hold for the observed variables xi . In case of two variables, the independence holds if and only if p(y1 , y2 ) = p(y1 )p(y2 ). This definition extends to any number of random variables. The are three properties of the ICA that should be taken into account when considering the analysis results. First, one cannot determine the variances of the independent components si . The reason is that, both s and A being unknown, any scalar multiplier in one of the sources si could always be canceled by dividing the corresponding column ai of A by the same scalar. As a normalization step, one can assume that each component has a unit variance, E{si 2 } = 1. The ambiguity of the sign still remains: one could multiply a component by −1 without affecting the model. The second property to be remembered is that one cannot determine the order of the components. While both s and A are unknown one can freely change the order of the terms in Eq. (2) and call any of the components the first one. The third important property of ICA is that the independent components must be nongaussian for ICA to be possible [11]. Then, the mixing matrix can be estimated up to the indeterminacies of order and sign discussed above. This is in stark contrast to such techniques as principal component analysis and factor analysis, which are only able to estimate the mixing matrix up to a rotation, which is quite insufficient for our purposes. For our ICA analyses we applied FastICA2 software package for Matlab. We fed the word-context matrix C to the FastICA algorithm [10] so that each column was considered one data point, and each row one random variable. We used the standard maximum-likelihood estimation by setting the nonlinearity g to the tanh function, and using symmetric orthogonalization [11] (p. 212). The dimension of the data was reduced to 10 by principal component analysis (this is implemented as part of the software)3 . Reduction of the dimension is often used to reduce noise and overlearning [11] (p. 267). Thus, the number of independent components is also reduced to 10.
meaningful collection of emergent linguistic features; each independent component was one such feature. In the following, we will show several examples of the analysis results. In considering the feature distributions, it is good to keep in mind that the sign of the features is arbitrary. As was mentioned earlier, this is because of the ambiguity of the sign: one could multiply a component by −1 without affecting the model (see Section 4.1). Also, the numbering (order) of the components is arbitrary. Fig. 2 shows how the third component is strong in the case of nouns in singular form. A similar pattern was present in all the nouns with three exceptional cases with an additional strong fourth component indicated in Fig. 3. The reason appears to be that “psychology” and “neuroscience” share a semantic feature of being a science or a scientific discipline. A similar pattern is also present in words such as “engineering” and “biology”. This group of words provide a clear example of distributed representation where, in this case, two components are involved. model
problem
0.25
0.3
0.2
0.25
0.15
0.2
0.1
0.15
0.05
0.1
0
0.05
−0.05
−0.1
0
1
2
3
4
5
6
7
8
9
10
−0.05
1
2
3
4
5
pattern 0.14
0.1
0.12
0.08
0.1
0.06
0.08
0.04
0.06
0.02
0.04
0
0.02
−0.02
0
−0.04
−0.02
1
2
3
4
5
6
6
7
8
9
10
7
8
9
10
result
0.12
7
8
9
10
1
2
3
4
5
6
Fig. 2. ICA features for “model”, “problem”, “pattern” and “results”. For each word, we show the values of the 10 independent components as a bar plot.
neuroscience
psychology
0.25
0.2
0.2 0.15 0.15
0.1
III. L INGUISTIC FEATURES EXTRACTED
BY
ICA
0.1
0.05 0.05
The results of the ICA analysis corresponded in most cases very well or at least reasonably well with well-known or intuitively plausible linguistic categories. The system was able to automatically create distributed representations as a 2 http
: //www.cis.hut.f i/projects/ica/f astica/ Matlab code for the operations was as follows: LC = log(C + 1); [A, W ] = f astica(LC,0 approach0 ,0 symm0 ,0 g 0 ,0 tanh0 , 0 lastEig 0 , 10,0 epsilon0 , 0.0005);
0 0 −0.05
−0.1
1
2
3
4
Fig. 3.
5
6
7
8
9
10
−0.05
1
2
3
4
5
6
7
8
9
10
ICA features for “neuroscience” and “psychology”.
3 The
An interesting point of comparison for Fig. 2 is the collection of plural forms of the same nouns in Fig. 4. The third
will
component is strong as with the singular nouns but now there is another strong component, the fifth. models
can
0.1
0.15
0.05
0.1
0
0.05
−0.05
0
−0.1
−0.05
problems
0.25
0.3
0.2
0.25
0.15
0.2
0.1
0.15
0.05
0.1
0
0.05
−0.05
0
−0.15
−0.1
−0.2
−0.15
−0.25
−0.2
−0.3
−0.25
−0.35
1
2
3
4
5
6
7
8
9
10
−0.3
1
2
3
4
5
may
6
7
8
9
10
7
8
9
10
must
0.1
0.05
0.05 0 0 −0.1
1
2
3
4
5
6
7
8
9
10
−0.05
1
2
3
4
5
6
7
8
9
10 −0.05 −0.05
Fig. 4.
−0.1
ICA features for “models” and “problems”.
−0.1
−0.15
Fig. 5 shows how all the possessive pronouns share the feature number nine. my
−0.15 −0.2
−0.25
1
2
3
4
5
6
7
8
9
10
−0.2
1
2
3
4
5
6
his
0.15
0.06
Fig. 6.
0.04 0.1
ICA features for “will”, “can”, “may” and “must”.
0.02 0.05
0 adaptive
artificial
0.15
0.06
−0.02 0 −0.04 0.04 0.1
−0.05 −0.06
0.02
−0.08
−0.1
0.05 −0.1 −0.15
0 −0.12 0
−0.2
1
2
3
4
5
6
7
8
9
10
−0.14
1
2
3
4
5
our
6
7
8
9
10
−0.02
their
0.1
0.15 −0.05 −0.04 0.1
0.05
0.05
−0.1
0
1
2
3
4
5
6
7
8
9
10
−0.06
1
2
3
4
5
6
7
8
9
10
0 −0.05 −0.05
Fig. 7.
−0.1
ICA features for “adaptive” and “artificial”.
−0.1 −0.15 −0.15
−0.2
−0.25
−0.2
1
2
3
4
Fig. 5.
5
6
7
8
9
10
−0.25
1
2
3
4
5
6
7
8
9
10
ICA features for “my”, “his”, “our” and “their”.
Modal verbs are represented clearly with component number ten as shown in Fig. 6. Here, slightly disappointingly, the modal verbs are not directly linked with verbs in general through a shared component. This may be because of the distinct nature of the modal verbs. Moreover, one has to remember that in this analysis we used 10 as the number of ICA features which sets a limit on the complexity of the feature encoding. We used this limit in order to demonstrate the powerfulness and usefulness of the method in a simple manner. A higher number of features can be used in order to obtain more detailed feature distinctions. Fig. 7 shows how the adjectives are related to each other through the shared feature number eight, and even number nine in the opposite direction. Quite interestingly this component number nine is associated with ing-ending verbs (see Fig. 8) such as “modeling” and “training” that can, naturally, serve in the position of an adjective or a noun (consider, for instance, “training set” versus “network training”). Fig. 9 shows how the three articles use two feature dimensions, namely the sixth and seventh.
Finally, there are individual words, particularly some verbs for which the result is not as clear as for other words. In Fig. 10 it is shown how the copula “is” has several features present in a distributed manner. The word “is” shares, however, clearly the feature number two with the word “have”. A collection of particles and similar common words were excluded in the analysis because many of them are rather unique considering the contexts in which their appear. This phenomenon was already discernable in the analysis word contexts using the self-organizing map [9]. The categorical nature of each component can also be illustrated by listing the words that give the strongest response modeling
training
0.15
0.2
0.1
0.15
0.05
0.1
0
0.05
−0.05
0
−0.1
−0.05
−0.15
−0.2
−0.1
1
2
3
4
5
Fig. 8.
6
7
8
9
10
−0.15
1
2
3
4
5
6
7
8
ICA features for “modeling” and “training”.
9
10
an
a 0.7
0.05
0.6
0
0.5
−0.05
0.4
−0.1
0.3
−0.15
0.2
−0.2
0.1
−0.25
0
−0.3
−0.1
1
2
3
4
5
6
7
8
9
The nouns “network” and “control” in component 8 in Fig. 12 are often used in the corpus in noun phrases like “neural network society”. In general, the area and style of the texts in the corpus are, of course, reflected in the analysis results.
−0.35
10
1
2
3
4
5
6
7
8
9
10
the 0.5
0.4
0.3
0.2
0.1
0
−0.1
−0.2
6 a the and or their its your ...
7 the an and or their its are ...
8 neural computational cognitive network adaptive control learning ...
9 their our your my learning research processing ...
10 will can may should would must did ...
−0.3
−0.4
1
Fig. 9.
2
3
4
5
6
7
8
9
10
Fig. 12. The most representative words for the last five features (components), in the order of representativeness, top is highest.
ICA features for “a”, “an” and “the”.
is
have
0.4
0.25
0.35 0.2 0.3 0.15
0.25
0.2 0.1 0.15 0.05 0.1
0.05
0
0 −0.05 −0.05
−0.1
1
2
3
4
5
6
7
Fig. 10.
8
9
10
−0.1
1
2
3
4
5
6
7
8
9
10
ICA features for “is” and “have”.
value for each component (see Fig. 11 and Fig. 12). The result shows some very clear components such as 3 to 5 which can be considered noun categories. These three components were already discussed earlier. Component number 8 responds to adjectives whereas number 10 contains modal verbs. Verbs “to be” and “have” are in their different forms in the component 2. We can also see a certain kind of component overloading in components 1 and 2. This is explained by the limited number of component in use. With a larger number of components, more detailed categories can be gained and ambiguity inside a category can be avoided. 1 or and is are have has use ...
2 is are have has i we they ...
3 paper information it papers system work networks ...
4 science university engineering research psychology neuroscience technology ...
5 networks systems learning models processing algorithms recognition ...
Fig. 11. The most representative words for the first five features (components), in the order of representativeness, top is highest.
IV. D ISCUSSION In this article, we started by discussing some advantages and limitations of latent semantic analysis and the self-organizing maps in the analysis of word contexts. Latent semantic analysis suffers from the limitation that the underlying semantic space remains implicit. The self-organizing map is able to explicate the semantic space as relationships on the map. However, the categories remain implicit and there is only one position for each word in the map which is a limitation considering the intuitive idea that a word may very well belong to several categories simultaneously. We have shown how independent component analysis can bring an additional advantage of finding explicit features that characterize words in an intuitively appealing manner. We have considered the methods for the analysis of words as they appear in text corpora. All these methods are beneficial as automatic statistical methods for linguistic analysis. However, independent component analysis appears to make possible a qualitatively new kind of result which have earlier been obtainable only through hand-made analysis. The analysis results show how the ICA analysis was able to reveal underlying linguistic features based solely on the contextual information. The results include both an emergence of clear distinctive categories or features and a distributed representation. This is based on the fact that a word may belong to several categories simultaneously. For illustration purposes we kept the number of features low, i.e., ten. However, similar approach scales well up to higher numbers of dimensions. Future research directions include analysis of larger corpora for extracting larger number of independent components. Various options for, e.g., determining the contextual window will be tested. On a qualitative level, polysemes, i.e., the words that have two or more similar meanings will be considered. Whether the component values can be applied as degrees of membership for each word in each category is a question of further analysis. To interpret the estimated components as linguistic features, it is necessary to measure how well they
capture linguistic information. We will also study the closeness of match between the emergent components and manually determined linguistic categories. We are optimistic that the approach will be relevant in areas such as general and cognitive linguistics and language technology. Potential practical application areas include information retrieval and machine translation. The distributed representation can be used as a well-motivated low-dimensional encoding for words in different applications. The limited number of dimensions brings computational efficiency whereas the meaningful interpretation of each component provides basis for intelligent processing. Moreover, the fact that the features are obtained through an automated analysis is a cost-effective solution compared with traditional manual development of dictionaries and linguistic knowledge bases. Within cognitive linguistics we wish that our model can provide additional understanding on potential cognitive mechanisms in natural language learning and understanding. Our approach is based on the assumption that much of the linguistic knowledge is emergent in nature and based on specific learning mechanisms. In this paper, we have shown how independent component analysis has some additional qualitative advantages when compared with some traditional artificial neural network and statistical machine learning methods.
R EFERENCES [1] E. Bingham, J. Kuusisto, and K. Lagus. ICA and SOM in text document analysis. In Proceedings of the 25th ACM SIGIR Conference on Research and Development in Information Retrieval, pages 361–362, 2002. [2] K.W. Church and P. Hanks. Word association norms, mutual information and lexicography. Computational Linguistics, 16:22–29, 1990. [3] P. Comon. Independent component analysis—a new concept? Signal Processing, 36:287–314, 1994. [4] S.C. Deerwester, S.T. Dumais, T.K. Landauer, G.W. Furnas, and R.A. R.A. Harshman. Indexing by latent semantic analysis. Journal of the American Society of Information Science, 41:391–407, 1990. [5] Ch.J. Fillmore. Universals in Linguistic Theory, chapter The case for case, pages 1–88. Holt, Rinehart and Winston, Inc., 1968.
[6] S. Finch and N. Chater. Unsupervised methods for finding linguistic categories. In I. Aleksander and J. Taylor, editors, Artificial Neural Networks, 2, pages II–1365–1368. North-Holland, 1992. [7] G.W. Furnas, T.K. Landauer, L.M. Gomez, and S.T. Dumais. The vocabulary problem in human-system communication. Communications of the ACM, 30(11):964–971, 1987. [8] T. Honkela. Learning to Understand - General Aspects of Using Self-Organizing Maps in Natural Language Processing In Computing Anticipatory Systems, pages 563–576. American Institute of Physics, Woodbury, New York, 1997. [9] T. Honkela, V. Pulkki, and T. Kohonen. Contextual relations of words in Grimm tales analyzed by self-organizing map. In Proceedings of ICANN-95, International Conference on Artificial Neural Networks, volume 2, pages 3–7. EC2 et Cie, 1995. [10] A. Hyv¨arinen. Fast and robust fixed-point algorithms for independent component analysis. IEEE Transactions on Neural Networks, 10:626– 634, 1999. [11] A. Hyv¨arinen, J. Karhunen, and E. Oja. Independent Component Analysis. John Wiley & Sons, 2001. [12] C. Isbell and P. Viola. Restructuring sparse high dimensional data for effective retrieval. In Advances in Neural Information Processing Systems, volume 11, pages 480–486, 1998. [13] C. Jutten and J. H´erault. Blind separation of sources, part I: An adaptive algorithm based on neuromimetic architecture. Signal Processing, 24:1– 10, 1991. [14] T. Kolenda and L.K. Hansen. Independent components in text. In Advances in Neural Information Processing Systems, volume 13, pages 235–256, 2000. [15] T. Landauer and S. Dumais. A solution to plato’s problem: The latent semantic analysis theory of acquisition, induction and representation of knowledge. Psychological Review, 104:211–240, 1997. [16] C. Manning and H. Sch¨utze. Foundations of Statistical Natural Language Processing. MIT Press, Cambridge, MA, 1999. [17] R. Miikkulainen. A distributed feature map model of the lexicon. In Proceedings of 12th Annual Conference of the Cognitive Science Society, pages 447–454, Hillsdale, NJ, 1990. Lawrence Erlbaum. [18] R. Miikkulainen. Subsymbolic Natural Language Processing: An Integrated Model of Scripts, Lexicon, and Memory. MIT Press, Cambridge, MA, 1993. [19] R. Miikkulainen. Self-organizing feature map model of the lexicon. Brain and Language, 59:334–366, 1997. [20] H. Ritter and T. Kohonen. Self-organizing semantic maps. Biological Cybernetics, 61(4):241–254, 1989. [21] G. Salton, A. Wong, and C. S. Yang. A vector space model for automatic indexing. Communications of the ACM, 18(11):613–620, 1975. [22] H. Sch¨utze. Dimensions of meaning. In Proceedings of Supercomputing, pages 787–796, 1992.