한국지능시스템학회 논문지 2011, Vol. 21, No. 6, pp. 786-791 http://dx.doi.org/10.5391/JKIIS.2011.21.6.786
Optimal EEG Feature Extraction using DWT for Classification of Imagination of Hands Movement Pharino Chum, Seung-Min Park, Kwang-Eun Ko, and Kwee-Bo Sim * Chung-Ang University, School of Electrical and Electronics Engineering Abstract
An optimal feature selection and extraction procedure is an important task that significantly affects the success of brain activity analysis in brain-computer interface (BCI) research area. In this paper, a novel method for extracting the optimal feature from electroencephalogram (EEG) signal is proposed. At first, a student’s-t-statistic method is used to normalize and to minimize statistical error between EEG measurements. And, 2D time-frequency data set from the raw EEG signal was extracted using discrete wavelet transform (DWT) as a raw feature, standard deviations and mean of 2D time-frequency matrix were extracted as a optimal EEG feature vector along with other basis feature of sub-band signals. In the experiment, data set 1 of BCI competition IV are used and classification using SVM to prove strength of our new method. : Brain-Computer Interface, Electroencephalogram, Feature Extraction, Discrete Wavelet Transform, Student’s-t Statistic Key Words
1. Introduction Brain computer interface (BCI) system is a novel and interesting research era of the century. BCI studies focus on a development of machine that decoding human intention directly from brain interface alone into the communication channel and control external devices such as electrical wheel chair, mobile robot, manipulator, and so on. General BCI researches directly measure the brain activity associated with user’s intension and translate it into the correspond control signals This process involves analog/digital signal processing and various pattern recognition algorithms which are typically done by a computer science fields [1]. Recent technology associated with BCI is depend on the platform of its own. Typically, BCI platform can be categorize into three different types. First one is electroencephalography (EEG) based system capable of recording the brain electricity via non-invasive mounted electrodes on the scalp which each are in contact with the skull. The second one is single neuron-based system. In this system, the neuron electrical activity can be recorded by electrode that penetrated deeply into the brain cortex and places near the measuring neuron around 10 to 100μm. The last platform of current BCI system is electrocorticography (ECoG). This system
접수일자 : 2011년 11월 19일 완료일자 : 2011년 12월 12일 * 교신 저자 본 논문은 본 학회 2011년도 추계학술대회에서 선정된 우수논문입니다. 본 논문은 한국연구재단 중견연구자지원사업(No. 2011-0029861)에서 지원하여 연구하였습니다. 연구비 지원에 감사드립니다.
786
implants the array of electrodes over or under the brain Dura. Among these platforms EEG is the only non-invasive approach while other technique required the brain surgery. It also the most popular among the low level clinical application and researchers and engineering because of it is easy to measure and less preparation time. Also, EEG-based BCI system gives a good performance for application which concern mostly over the motor cortex area. BCI study is composed of four main stages. First is the signal acquisition stage. In this stage the electrical signals from brain are recorded via mounted electrodes and digitize according to BCI experimental paradigm. The seconde stage is the signal processing which extracted the identifiable signal features and translated into the control commands. The third part is the device output of BCI which receive the command and created the response to the real world environment like moving robot arm or moving cursor on the screen. The last component is the operating protocols for the BCI system. In this paper we focus on the second stage of BCI study, signal processing, which responsibles for translation brain signal into the device commands. This stage is composed of feature extraction and classification. These two processes can affect server to the BCI system performance. As the many various methods like Evented Related Potential (ERP), Evented Related Synchronize (ERS) or Desynchronise (ERD), Fast Fourier Transform (FFT), can be used to extracted the feature from EEG signal, but some of these methods are lack out localization in frequency or time domain. The method that we interested in which have both properties is wavelet transform. There are two main type related to wavelet transform, Continuous Wavelet Transform (CWT) and Discrete Wavelet transform (DWT). CWT has
Optimal EEG Feature Extraction using DWT for Classification of Imagination of Hands Movement advantage over the resolution over the DWT, but DWT is the extension for CWT to the real time computation problem. We also interest in Short Time Fourier Transform (STFT) which has the some desired properties like wavelet transform. As we know, one image can worst a thousand word. Motivated by this, we combine the image retrieval feature with the feature extraction method by DWT to form a new feature for EEG signal. We also comparing our new features with the features extract by plain DWT, CWT and STFT to see the strength of our features.
2. Related Works 2.1 Standard deviation of row and column vector
The process of retrieving standard deviation of feature vectors can be achieved as following step: Step 1: split image matrix into RGB component. Step 2: calculated mean of row/column vectors of RGB Step 3: calculated standard deviation of row and column.
As a result, we get six-standard deviation as below:
(1)
2.2 Student's- t-statistic
This statistical method is used to normalize the error between unknown population of data set of EEG signals. The normalized signal is found in the equation (2), where and are mean and standard deviation of signal .
∞
(4)
(5)
∞
The advantage of DWT over the CWT is we can transform the original signal into approximation and detail coefficient. The approximation coefficient of transform at scale index can be found using approximation coefficient at scale index as shown in the equation (6). And the transformation coefficient at the index can derive from the approximation coefficient at scale index and given in the equation (7). This calculation process is called multi-resolution decomposition which allow us to compute the wavelet coefficient in from the previous coefficient rather than from the integral in the equation (4). The coefficient and is lowpass and high pass filter.
(6)
(7)
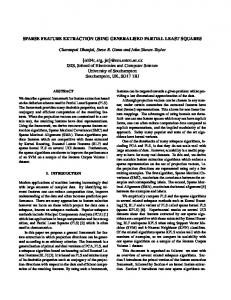
The practical concept is more easier to understand. As shown in the figure 1, the signal with length can decompose by convolving with low pass and high pass filter with length , where these filter associated with mother wavelet that we use. After we down sampling the output signal by 2 to get a approximation coefficient and detail coefficient both at length .
(2)
2.3 Discrete wavelet transform
The original CWT is shown in the equation (3), where is the input signal, is the dilation parameter of wavelet, is the location parameter of wavelet, is the complex conjugate of the analysis wavelet function and is coefficient of the continuous wavelet at the dilation and location . DWT can be derive using condition of discrete of scale is a power of two and location proportional to . In the equation (4), is the coefficient of discrete wavelet transform at the at scale and location indices of signal , is discrete mother wavelet used in the transformation and given in the equation (5).
∞
∞
(3)
Fig. 1. DWT-based decomposition process The signal can be decomposed into more level by repeating the decomposition process with previous approximation coefficient. As indicated in the figure 2, 3 level decomposition can be done by first decompose signal into first level coefficients and . The second level coefficients and can derive from the approximation coefficient at the level 1. The third level coefficients and obtain by decompose . For multi-level decomposition, the
787
한국지능시스템학회 논문지 2011, Vol. 21, No. 6 coefficients at each level can be obtained by decompose the previous approximation coefficient.
calculate. At last the difference features between channels are extracted as the last features.
4. Motor Imagery EEG Classification Experiments 4.1 Experiment data set
Fig. 2. The DWT algorithm for multi-level decomposition
3. Proposed Optimal Feature Extraction Method We propose method for feature extraction as indicate in figure 3, composes of two steps: preprocessing stage and feature extraction stage.
In our experiment, EEG is obtained from “Data set 1” of BCI-competition-IV which is provided by the Berlin BCI group. We use only the calibration sessions in which the subjects performed mental motor imagery tasks. In total real and generated 7 subjects we chose only 2 real personal subject which perform the imagination of hands movement. As shown in figure 4, experiment paradigm of the calibration session in this data set, subject is shown by the screen with fixation cross for 2 seconds to alert the subject to be ready for the task. Then in next 4 seconds, the cue display on the screen and patient have to imagination of left or right hand movement according to the cue display on the screen. At last 2 second the blank screen display for patient to relax. The process start with the fixation cross again for next trail.
Fig. 4. Experiment paradigm of calibration session of dataset 1 in BCI competitor IV 4.2 Optimal feature extraction
Fig. 3. Flow chart of feature extraction procedure 3.1 Preprocessing
First channel C3 and C4 are selected from all of EEG channel to reduce data dimension. Each channel is divided into small epoch for each trial. Low pass filter and Student t-statistic are applied to each windows pair of C3 and C4 cut off unwanted frequency and normalize the statistical error. 3.2 Feature extraction method
DWT decompose the signal of each window into six level bands which include alpha, beta and gamma (1Hz-80Hz) EEG rhythm region. Only 4 bands above are selected to analyze. Mean, standard deviation, and standard deviation of row and column vector are
788
Signals from C3 and C4, out of 59 electrodes, are selected as they give better result for motor cortex analysis related to the movement and imagination of both hands movement and to reduce dimension of features. The suitable epoch size is 4 seconds in which cue display and subject completes the imagination task. But the first second of this 4 second are unusable due the artifact is generated when the first time cue display on the screen and it is advise by the BCI completion IV group. So the epoch size is reduced to only 3 seconds. The 6 order of elliptic low pass filter of cut off frequency of 30Hz is applied for filtering signal due too many noise and artifact presented in the EEG signals like the eye link artifact and electrical power line which are the famous artifact during recording process. After that Student’s t-statistic is applied to filtered signals for purpose to normalize the signals and reduce statical error of signal in each selected epochs of both channels. Discrete Mayer wavelet is used as mother wavelet of DWT for multi-resolution decomposition preprocessed signals in each epoch into 6 levels distinguish bands, in which we selected only 4 bands for analyzing and extracting features. For each trail of experiment, we extracted 24 features from both channel C3 and C4
Optimal EEG Feature Extraction using DWT for Classification of Imagination of Hands Movement window. These feature are reduce to only 12 as we subtract the features of C3 with C4. We also compare our extracted feature, as in Figure 2, with image base methods like Continuous Wavelet Transform and Short-Time Fourier Transform.
Fig. 5. Simulation result of coefficient of DWT of right and left hand movement To prove extracted features characteristic, we compare our features with 2-D feature base methods like CWT and STFT. Sample of simulation result is shown in the figure 5, the horizontal axe is the time measuring in second which total our epoch size is 3 second, vertical axe is the scale of DWT, the higher scale represents the lower frequency, and the color in figure the represents the amplitude of the coefficient of the wavelet transform where the value of each color is given according to value in color bar. The figure 5(a) and 5(b) are coefficient of epoch of channel C3 and C4 related to right hand movement and figure 5(c) and 5(d) are related to left hand movement. Comparing figure 5(a) and 5(b), we found that at signal level 6 almost nothing different between coefficient of channel C3 and C4, but we found more activity at the level 5 and clearly at level 4. The red rectangular marks the interest region different between these two channel. At time from 1-2 second, we can see that the coefficient at level 5 of figure 5(a) has a red line that indicate the increasing of the amplitude and surround by lower amplitude and compare to the same position in figure 5(b), there are only the lower amplitudes. We can conclude that at this time is ERS of the C3 and it is more activation than C4 which correspond to right hand movement. The same process, we compare figure 5(c) and 5(d), we can see the rectangular indicator in level 5 both figures, the coefficient of C4 show that C4 is in the state of ERS while C3 is less active. So the feature show that it is the left hand movement. The simulation result in figure 6 shows the coefficients of the CWT with the same input signal and mother wavelet. The horizontal axe of each figure is epoch time in second and the vertical axe is scale of CWT, where the higher scale represent the lower
frequency, and the color indicators that amplitude of the CWT coefficient. Figure 6(a) and (b) is coefficients of channel C3 and C4 for right hand movement and figure 6(c) and 6(d) is the coefficients of left hand movement.
Fig. 6. Simulation result of coefficient of CWT of right and left hand movement In common with previous figures, we can find ERD and ERS of each figure. In figure 6(a) and 6(b), we can find the large region of different of each figure indicated by the red rectangular. It show that we can find interest features at high scale while the many lower scale give the same features which seem to be useless. We can find out that at time around 1.5 second the two figure are completely different, which indicate that C3 is in the state of ERS and right hand is moving. While figure 6(c) and 6(d) can show clearly that C4 is activating and it is left hand movement. The features have many significant points that give more dimension, which can be the curse of dimension for that classifier.
Fig. 7. Simulation result of amplitude of STFT of right and left hand movement Figure 7 is simulation result of STFT of the same epoch. As shown in the figure, the horizontal axe is the time and vertical axe is the frequency, color indicate that amplitude if signal at correspond time and
789
한국지능시스템학회 논문지 2011, Vol. 21, No. 6 frequency. The figure 7(a) and 7(b) corresponds to the right hand movement, 7(c) and 7(d) are related to left hand movement. Black-line rectangular in the figure 7(a) and 7(b) show differences between channel C3 and C4. The feature in range of frequency from 10Hz-20Hz show a dropping and follow by increasing the amplitude of the C3, which are ERD and ERS for EEG analysis. But these features suffer from the low resolution which make it hard to analysis. The same analysis method can be used for figure 7(c) and 7(d). We found that frequency around 10 Hz and 20Hz give more status of ERD and ERS at time around 1.5 second on C4 which related to movement of left hand. The last stage of our experiment, we extract the features from our propose method and other methods as shown in the figure 8, with the same input signals from the preprocessing. For our propose method, DWT and CWT we use the same Mayer mother wavelet for transformation. Features from DWT method are the 6 levels coefficients of decomposition. For CWT method, we extract feature from scale range 56-64 due the computing memory problem. And the frequency band for STFT method is selected from 10-30Hz. The last feature for input to the classifier is the difference between transformations of C3 and C4 of each trail. For the classification unit, we use Support Vector Machine(SVM) with linear kernel function. There are two subject for classification with each of 200 sample witch we devide 100 for training and other 100 for classification. The accuracy of classification are calculated by the confusion matrix.
Table 1. Classification result based on DWT method Predicted class DWT Subject 1 Subject 2 LH RH LH RH LH 29 21 31 19 RH 28 22 19 31 Table 2. Classification result based on CWT method Predicted class CWT Subject 1 Subject 2 LH RH LH RH LH 27 23 20 30 RH 23 27 27 23 Table 3. Classification result based on STFT method Predicted class STFT Subject 1 Subject 2 LH RH LH RH LH 25 25 31 19 RH 28 22 12 38 Table 4. Classification result based on proposed feature extraction process Predicted class Proposed Subject 1 Subject 2 method LH RH LH RH LH 25 25 27 23 RH 27 23 17 33
5. Conclusions Fig. 8. Experiment classification process The result of classification are shown by confusion matrix in the table 1-4 for each method. For subject 1, we see that the feature give by CWT method has a best performance and then DWT, while our propose method has best the features extracted by STFT. For the second subject result in each table indicated that STFT change the performance to the first place, DWT is the second place where our propose method still maintain the third place and follow by CWT in the last place. The result of classification show that even though our proposed method are not the best feature extraction method but this method is robust to the variation change of subjects of the BCI system, noise and artifact compare to the method like CWT and STFT.
790
As a performance measurement, classification accuracy is widely applied in BCI system and it depends on that how many meaningful features can be extracted from the raw signal. In this paper, we propose a novel feature extraction method based on image feature extraction technique which prove to have medium accuracy for classification but a good robust method for extracting features from the raw EEG signals with specific mental task, which usually contaminated by noise and artifact. We also conclude that the imagination of hands movement can perfectly analysis using only two electrodes of channel C3 and C4 of motor imagery cortex using frequency range from 7-30Hz and it is proved to give the best feature for EEG-base BCI system. For future work we will focus on finding more intelligent feature extraction method and classification for imagination of hand movements.
Optimal EEG Feature Extraction using DWT for Classification of Imagination of Hands Movement Reference [1] J.R. Wolpaw, N. Birbaumer, D.J. McFarland, G. Pfurtscheller, T.M. Vaughan, “Brain-computer interfaces for communications and control," In Clinical Neurophysiology, vol. 113, pp. 767-791, 2002. [2] E.C. Leuthardt, G. Schalk, J. Roland, A. Rouse, D.W.Moran., “Evolution of brain-computer interfaces: going beyond classic motor physiology,” In Neurosurgical Focus, vol. 27, no. 1, 2009. [3] P.S. Addison, “Wavelet transform and the ECG: a review," In Physiological Measurement, vol 26, no. 5, pp. R155-R199, 2005. [4] J.S. Vincent, B. Ajit , R. Raghuveer, S. Kenneth, “Wavelet Analysis of Neuroelectric Waveforms: A conceptual Tutorial,” In Brain and Language, vol. 66, issue 1, pp. 7-60, 1999. [5] H.B. Kekre, K. Patil, “Standard Deviation of Mean and Variance of Rows and Columns of Images for CBIR," In International Journal of Computer and Information Engineering, 2009. [6] B. Vladimir, “BCI Competition 2003-Data Sets Ib and IIb: Feature Extraction Event-Related Brain Potentials With the Continuous Wavelet Transform and the t-Value Scalogram,” In IEEE Transaction on Biomedical Enginerring, vol. 51, no. 6, 2004. [7] S. Bhattacharyya, A. Khasnobish, A. Konar, D.N. Tibarrewala, A.K. Naga, “Performance Analysis of Left/Right Hand Movement Classification from EEG Signal by Intelligent Algorithms," In
Computational Intelligence, Cognitive Algorithms, Mind, and Brain(CCMB, 2011 IEEE Symposium), 2011.
[8] A.J. Pérez-Jiménez and J.C. Pérez-Cortés, “Genetic Algorithm for Linear Feature Extraction," Proceedings on Vision
System-Segmentation and Pattern Recognition,
pp. 423-436, 2007. [9] J.R. Wolpaw, N. Birbaumer, W.J. Heetderks, D.J. McFarland, P.H. Peckham, G. Schalk, E. Donchin, L.A. Quatrano, C.J. Robinson, T.M. Vaughan, “Brain-computer interface technology: a review of the first international meeting,” In Rehabilitation Engineering, IEEE Transactions, vol. 8, no. 2, 2000. [10] H.N. Jeremy, L. Thomas, S. Michael, H. Thilo, W. Guido, E. Christain, S. Bernhard, B. Niels, “Classifying Event-Related Desynchronization in EEG, ECoG and MEG signals,” In Towards Brain-Computer Interfacing, vol. 4174, pp. 404-413, 2006. [11] F. Lotte, M. Congedo, A. Lécuyer, F. Lamarhe, B. Arnaldi, “A review of classification algorithms for EEG-based brain-computer interfaces,” In Journal of Neural Engineering 4, pp. R1-R13, 2007.
저자소개 Pharino Chum
2011년 : B.S. in Electrical, Electronic and Telecommunication from Institut of Technology of Cambodia 2011년~현재 : 중앙대학교 대학원 전자전 기공학부 석사과정 관심분야 : Pattern recognition, brain-computer interface, machine learning, and intelligent robotics. Email :
[email protected] 박승민(Seung-Min Park)
2010년 : 중앙대학교 전자전기공학부 공학사 2010년~현재 : 중앙대학교 대학원 전자전 기공학부 석박사통합과정 관심분야 : Brain-computer interface, intention recognition, soft computing Email :
[email protected] 고광은(Kwang-Eun Ko)
2007년 : 중앙대학교 전자전기공학부공학사 2007년~현재 : 중앙대학교 대학원 전자전 기공학부 석박사통합과정 관심분야 : Multi-Agent Robotic Systems (MARS), Machine learning, brain computer Interface, intention recognition Email :
[email protected] 심귀보(Kwee-Bo Sim)
1990년 : The University of Tokyo 전자공학과 공학박사 [제21권 5호 (2011년 10월호) 참조] 1991년 ~ 현재 : 중앙대학교 전자전기공학부 교수 2006년 ~ 2007년 : 한국지능시스템학회 회장 E-mail :
[email protected] Homepage URL : http://alife.cau.ac.kr
791