sensors Article
Low-Pass Filter for HV Partial Discharge Testing Vladimir Kindl *, Bohumil Skala, Roman Pechanek, Vaclav Kus and Jaroslav Hornak
ID
University of West Bohemia, Faculty of Electrical Engineering, Regional Innovation Centre for Electrical Engineering (RICE), Univerzitni 8, 301 00 Pilsen, Czech Republic;
[email protected] (B.S.),
[email protected] (R.P.),
[email protected] (V.K.);
[email protected] (J.H.) * Correspondence:
[email protected] Received: 2 January 2018; Accepted: 2 February 2018; Published: 6 February 2018
Abstract: The most common cause of high voltage electric machine malfunction is an electrical failure of the insulation system due to extreme partial discharges activity. The paper discusses the methodology for the construction of a low-pass high voltage filter for partial discharge measurement. It focuses mainly on the shape optimization, using an analytical approach with subsequent verification using the finite element method. The experimental verification is given together with important conclusions. Keywords: low-pass filter; partial discharge; design; magnetic field; finite element method
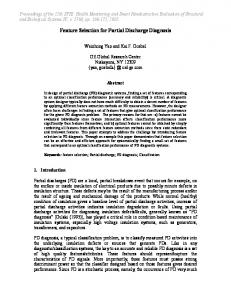
1. Introduction Nowadays, industry is virtually dependent on a continuous supply of electric energy. The most important component of the ordinary power plant is a power generator, but the plant normally utilizes a large amount of supporting drives and auxiliary systems, which together forms a very complicated functional unit. Every electrical device operating in such a system is inherently at risk of failure due to many external or internal matters (e.g., excessive electrical, thermal, or mechanical stress, extreme operating conditions, etc.) [1–4], and even a brief drop-out of any auxiliary system may lead to incidental power plant downtime, and thus power outage. Therefore, machine reliability and availability are in high demand. Many studies [5–7] have reported that one of the most common causes of high voltage electric machine malfunction is an electrical failure of the insulation system due to extreme partial discharges (PD) activity. In such a case, the insulating system is subjected to several stresses that cause changes of material properties. This effect progressively reduces the ability of the insulation to resist even normal operational stresses. Precise determination of the actual condition of the insulating system may prevent its destructive changes and help in planning lay-offs or regular maintenance. Therefore, the detection and evaluation of PD activity [8–13] is a very important issue for systems reliability. Nowadays, PD detection [14–20] as a non-destructive diagnostic tool is used in a wide range of applications, e.g., in generators, transformers, cables, switchgears, and many others. One of the most common test circuits of the galvanic PD measurement method (according to International Electrotechnical Commission standard IEC 60270 [21]) is illustrated in Figure 1. The measuring circuit is powered by a high voltage source feeding two branches though the filter. The first one involves the tested object Ct , in which PD occurs. The second one consists of a capacitive divider formed by a coupling capacitor Ck and an impedance Zm , which converts the high frequency current to a voltage signal sensed by the measuring system M. The filter Z must be connected to the source output to prevent any noise and interference coming from the power supply site. The required PD signal will remain in PD measuring loop and will not leak through the power supply to ground. The filter is usually built as a large inductor because the tested insulation system Ct exhibits a predominantly capacitive character. Sensors 2018, 18, 482; doi:10.3390/s18020482
www.mdpi.com/journal/sensors
Sensors 2018, 18, 482
2 of 14
Sensors 2018, 18, x FOR PEER REVIEW Sensors 2018, 18, x FOR PEER REVIEW
2 of 14 2 of 14
Z Z Ck Ck
high-voltage high-voltage power source power source
Ct Ct Zm Zm
M M
Figure 1. Basic partial discharges (PD) measurement test circuit [17]. Figure 1. 1.Basic discharges (PD) measurement test circuit [17]. Figure Basicpartial partial discharges (PD) measurement test circuit [17].
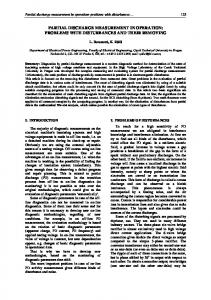
The high voltage (HV) filter plays an important role, especially in the diagnostics of rotary The high voltage (HV) filter plays an important role, in the diagnostics of rotary machines The high voltage (HV) filter plays an important role, especially inlong the power diagnostics ofcable, rotary machines and transformers that are fed through an HVespecially cable. Due to the supply and transformers that are fed through an HV cable. Due to the long power supply cable, the measured machines and transformers that are fed through an HV cable. Due to the long power supply cable, the measured signal may contain additional oscillations, reflections, and attenuation. The typical signal may contain additional oscillations, reflections, and attenuation. The typical calibration pulse the measured signal may contain additional oscillations, reflections, and attenuation. The typical calibration pulse used in an HV circuit for PD calibration and its variation with and without a filter used in an HV circuit forinPD andPD itscalibration variation with andvariation withoutwith a filter presented in pulse used an calibration HV circuit for and its andiswithout a filter iscalibration presented in Figure 2. Figure 2. is presented in Figure 2. 3 Circuit with HV filter Circuit with HV Circuit without HVfilter filter Circuit without HV filter
Voltage [mV] Voltage [mV]
3 2.5 2.5 2 2 1.5 1.5 1 1 0.5 0.5 0 0 -0.5 -0.5 -1 0 -1 0
1
2 1
3 Time [s] 3 2 Time [s]
4
5 4
5
Figure 2. Calibrating signal measured in the testing circuit (Figure 1) supplied by a 30-m-long shielded Figure Calibrating signal measured the testing circuit (Figure supplied a 30-m-long shielded Figure 2. 2.Calibrating signal measured inin the testing circuit (Figure 1)1) supplied byby a 30-m-long shielded cable. cable. cable.
This article proposes a design method for an HV filter applicable for PD measurement. The filter This article an proposes a design method for an HV filter applicable for PDparasitic measurement. The filter is constructed air-cored coil method with defined and optimized capacitance to This articleasproposes a design for an inductance HV filter applicable for PD measurement. The filter is constructed as an air-cored coil with defined inductance and optimized parasitic capacitance to meet a high-quality factor and predefined self-resonance frequency. The filter can be considered as is constructed as an air-cored coil with defined inductance and optimized parasitic capacitance toa meet a high-quality factor and predefined self-resonance frequency. The filterWhen can bethe considered as a complicated RLC circuit 8) with complex mutual interconnections. inductance meet a high-quality factor(see andFigure predefined self-resonance frequency. The filter can be considered as a complicated RLC circuit (see Figure 8) with complex mutual interconnections. When the inductance coils predefine resonance frequency to the tested insulation When system,thethe parasitic complicated RLCthe circuit (see Figure 8) withaccording complex mutual interconnections. inductance coils predefine the resonance frequency according to the tested insulation system, the parasitic capacitance affects its attenuation. coils predefine the resonance frequency according to the tested insulation system, the parasitic capacitance affects itsapplications attenuation.require the lowest stray capacitance possible. However, in this Therefore, many capacitance affects its attenuation. Therefore, many applications require the lowest so straycauses capacitance possible. However, in this particular case, many it is desired to set the straythe capacitance the self-resonance frequency of Therefore, applications require lowest strayitcapacitance possible. However, in this particular case, it is desired to set the stray capacitance so it causes the self-resonance frequency of the filter tocase, be between 80 kHz and kHz. particular it is desired to set the140 stray capacitance so it causes the self-resonance frequency of the the filter to be between 80 kHz and 140 kHz. filter to be between 80 kHz and 140 kHz. 2. Filter Design and Basic Specification 2. Filter Design and Basic Specification In the past, the design process was limited due to the low available computational performance In thecomputers. past, the design was limited due to athe low available computational of common So, it process was necessary to produce number of prototypes showingperformance the proper of common computers. So, it was necessary to produce a number of prototypes showing the proper
Sensors 2018, 18, 482
3 of 14
2. Filter Design and Basic Specification Sensors 2018, 18, x FOR PEER REVIEW
3 of 14
In the past, the design process was limited due to the low available computational performance of common computers. So, was it was necessary to produce a number of prototypes showing thematerial proper way of construction. This time-consuming and resulted in additional financial and way of construction. was time-consuming resulted in additional financial andconsiders material losses. losses. However, theThis modern design method,and usually called virtual prototyping, many However,requirements the modern design method, usually called virtual considers many technical technical and electrical and space limitations andprototyping, therefore reduces the time and money requirements anddevelopment. electrical andThe space limitations and therefore reduces the time and money spent spent during the virtual prototyping used in this approach includes an analytical during the The virtual prototyping used inanalyses this approach analytical design design withdevelopment. subsequent verification via finite element (FEA).includes The FEAanincludes both the with subsequent verification via finiteThe element analyses (FEA). The FEA includes both theon magnetic magnetic field and thermal analyses. proposed design methodology is demonstrated an HV field and analyses. The proposed designas methodology filter withthermal the following technical requirements, seen in Tableis1.demonstrated on an HV filter with the following technical requirements, as seen in Table 1. Table 1. Technical parameters required for the filter. Table 1. Technical parameters required for the filter.
Parameter Self-inductance Parameter Rated current Self-inductance Current density Rated current Current density Ambient temperature Ambient temperature Self-resonance frequency range Self-resonance frequency range
Value L =Value 6 [mH] I = 8 [A] (AC, 50/60 Hz, sinus wave) L = 6 [mH] 2] J