2010 Asia-Pacific International Symposium on Electromagnetic Compatibility, April 12 - 16, 2010, Beijing, China
Measuring IC Switching Current Waveforms Using a GMI Probe for Power Integrity Studies Fan Zhou#1, Songping Wu#2, David Pommerenke#3,Yoshiki Kayano*4, Hiroshi Inoue*5, Kenji Tan&6, and Jun Fan#7 #
EMC Laboratory, Missouri University of Science and Technology, 4000 Enterprise Dr., Rolla, MO,65401, USA 1 fzm73; 2swhv7; 3davidjp;
[email protected]
*
Department of Electrical and Electronic Engineering, Akita University, 1-1 Tegata Gakuen-machi,Akita 010-8502, Japan 4 kayano;
[email protected] & Akita Research and Development Center, 4-21 Sanuki, Araya, Akita 010-1623, Japan 6
[email protected]
Abstract— IC switching current is the main noise source of many power integrity issues in printed circuit boards. Accurate measurement of the current waveforms is critical for an effective power distribution network design. In this paper, using a giant magnetoimpedance (GMI) probe for this purpose is studied. A side-band detection and demodulation system is built up to measure various time-domain waveforms using an oscilloscope. It is found that the GMI probes are potentially suitable for this kind of time-domain measurements, but probe designs and measurement setups need further improvements for this application.
I. INTRODUCTION As clock rate and circuit density of electronic devices keep increasing, suppressing electromagnetic interference over a broad band is increasingly critical to ensure system performance as well as to meet regulatory requirements. Power distribution network design plays an important role in achieving this objective, since the simultaneous switching noise generated by ICs is a source to many noise coupling and emission problems. At the printed circuit board level, an effective power distribution network design relies a lot on the knowledge of the IC switching current waveforms. For example, the widely used design criterion of target impedance is specified based on the switching current. However, it is usually difficult for board engineers to obtain accurate IC SPICE models for current-waveform simulations, because of the proprietary nature of the chip designs. As a result, measurement becomes a viable alternative. Magnetic probes can be effectively used for current measurements. These probes need to have a high sensitivity, a high spatial resolution, and a wide frequency range, especially for time-domain measurements where the dynamic range of an oscilloscope is much smaller than a typical spectrum analyzer and the requirement for signal-to-noise ratio is much higher since a wide frequency band is involved. In terms of sensitivity and miniaturization, giant magnetoimpedance (GMI) sensor in a thin-film form has excellent performance. High sensitivity in the order of 10-12 T has been reported in [1]. The GMI sensor is designed based on the skin effect and permeability change of a soft magnetic material when it is exposed to an external magnetic field. Usually the change is more significant close to certain magnetic
978-1-4244-5623-9/10/$26.00 ©2010 IEEE
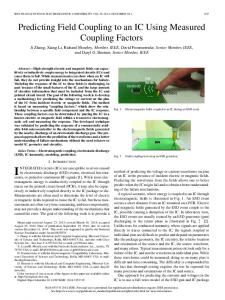
resonances. Previous research also reveals that the GMI sensor can remain highly sensitive in a wide frequency range from 5 KHz to 1 GHz without jeopardizing its spatial resolution [2]. In this study, a probe with a thin-film GMI sensor (element) is used to measure time-domain waveforms using an oscilloscope. A sideband detection and demodulation circuit is designed and implemented. The unique contribution of this work involves the extension of the previous GMI study to the time domain, which is much more challenging since the requirement for signal-to-noise ratio significantly increases. II. GMI PROBE A. GMI Probe Structure A GMI probe, as shown in Fig. 1, is used in this study. It is comprised of a thin-film GMI sensor at the tip and two 85 Ω microstrip traces with SMA connectors for cable connections. The GMI sensor includes a multilayer magnetic strip, which is deposited by RF sputtering on a 1 mm-thick glass substrate with a dielectric constant of 5.8. The stackup of the magnetic strip is Ta(5)/[NiFe(100)/Cu(5)]*9/NiFe(100)/Ta(5), where the numbers in parentheses are layer thicknesses in nm and *9 means there are 9 repetitive layer pairs. The length of the magnetic strip is 1000 μm and the width is 5 μm. A pair of copper electrodes with a thickness of 1 μm is formed at both ends of the magnetic strip by dc sputtering. The details of the GMI sensor are illustrated in Fig.2 [3].
Fig.1: Overall view of GMI probe.
B. DC Magnetic Field A carrier at 1 GHz is fed into the GMI probe. When the GMI sensor is in a time-varying external magnetic field, the field interacts with the GMI sensor and creates a sideband through amplitude modulation. Then, the strength of the
317
SS-12 Signal and Power Integrity for Multi-Gbps Digital Circuits open circuit, respectively. The trace was excited with a 5 V peak-to-peak sinusoidal wave with a frequency varying from 200 KHz to 100 MHz. The carrier fed into the GMI probe had a magnitude of 7 dBm. The GMI probe was placed in the middle of the trace. The lower sideband in the probe output was measured. S21 vs H-field -3 -3.2 -3.4 -3.6 S21 (dB)
magnetic field at the location of the GMI sensor can be measured from the sideband magnitude in the GMI probe output. The skin-effect and the permeability of the GMI sensor change with the external magnetic field, and further there are regions where the rate of the changes is larger than elsewhere [3]. In other words, under some dc bias, the GMI probe can be more sensitive to time-varying ac magnetic fields. To find a suitable dc magnetic field bias, the |S21| of the GMI probe as a function of the dc external magnetic field was examined first. The GMI sensor was placed in the center of a Helmholtz coil and was thus subject to a dc external magnetic field, sweeping from -15 Oe to 15 Oe. The direction of the dc magnetic field is parallel to the longitudinal direction of the GMI sensor. The test configuration is showed in Fig.3.
-3.8 -4 -4.2 -4.4 -4.6
0
5
10
15
H-field (oe)
Fig.4: |S21| versus dc magnetic field strength.
Fig.2: Illustration of GMI sensor.
Fig.5: Measuring magnetic field from trace in the frequency domain using a spectrum analyzer.
Fig.3: Experimental setup for dc magnetic field bias.
The measured |S21| results as a function of the dc magnetic field strength are plotted in Fig.4. For this particular GMI sensor, the stronger the dc magnetic field is, the higher the insertion loss. As mentioned earlier, to achieve the highest sensitivity, the dc bias point needs to be set at the location where the slope of the curve is the largest. In this study, the dc bias is chosen to be 10 oe. C. Characterization of the Probe In order to validate the measurement setup, the GMI probe was used to measure the magnetic field radiated from a microstrip trace in the frequency domain first, as shown in Fig.5. Three cases were studied with the 50 Ω microstrip trace terminated with a short circuit, a 50 Ω matched load, and an
The power of the lower sideband as a function of the excitation frequency for the three different termination conditions is shown in Fig.6. When the trace is shorted at the load RL, the magnetic field from the trace reaches the maximum and the electric field reaches the minimum nearly everywhere along the trace since it is electrically short. On the other hand, when the trace is open-ended, the magnetic field from the trace is the minimum while the electric field is the maximum. From Fig.6, the sideband power for the openended case is at least 20 dB lower than the short-ended case. This demonstrates that the magnetic field coupling dominates over the electric field coupling in the GMI probe, and thus further validates the measurement setup. It can also be observed that the output power of the lower sideband remains approximately the same at different frequencies for the 50 Ω matched load condition. In other words, the frequency response of the GMI probe is approximately flat in the frequency range under study. This is a significant advantage of the GMI probe compared with the conventional loop magnetic field probe in time-domain measurements. Because of its flat frequency response, the
318
SS-12 Signal and Power Integrity for Multi-Gbps Digital Circuits GMI probe potentially can directly reproduce the time-domain waveforms under test without any de-convolution procedure. Further, it may measure low-frequency magnetic fields more effectively than the loop probes where the sensitivity is proportional to frequency. -55 load open short
-60 -65
Amplitude (dBm)
-70 -75 -80 -85 -90 -95 -100 -105 10
0
10
1
10
2
Frequency (MHz)
Fig.6: Measured power of lower sideband versus excitation frequency.
III. TIME-DOAMIN WAVEFORM MEASUREMENTS To measure the time-domain waveforms using the GMI probe and an oscilloscope, the measurement setup shown in Fig.5 was further developed to include sideband detection and demodulation. A mixer was used to down convert the sideband to reproduce the trace current under measurement. Since the sideband power was very low and the carrier component was strong, several stages of amplification and low-pass filtering were needed. The improved experimental setup is illustrated in Fig.7.
Fig.7: Improved setup for time-domain waveform measurements.
In this design, the oscillator module generated two identical 1 GHz, 7 dBm sinusoidal signals. One signal served as the carrier and was fed into the GMI probe, which was place in a semi-anechoic chamber. The other oscillator signal was used as the local oscillator for the mixer. The 50 Ω microstrip trace was excited with various time-varying waveforms, and the
magnetic field from the trace was picked up by the GMI sensor and was further modulated with the 1 GHz carrier. The output of the probe, which included the modulated signal, was then fed into the mixer. The output of the mixer contained the wanted de-modulated signal as well the unwanted carrier and sideband signals. Unfortunately the wanted signal was more than 80 dB lower in power than the unwanted ones. Therefore a dc to 50 MHz first stage amplifier was used to amplify the wanted signal only. The narrow band of this amplifier could help increase the signal-to-noise ratio. Then a 700 MHz lowpass filter was used to attenuate the unwanted signals. Following this, another two stages of amplification and filtering were also included in order to raise the power ratio of the wanted to the unwanted signals. There was a 1 GHz band-pass filter, applied right before the carrier signal went into the probe. It was used to prevent the noise due to the electric field coupling from the GMI probe, which was not carefully designed for electric-field shielding, from propagating into the oscillator and from further creating modulated noise. For similar considerations, a 400 MHz highpass filter was used right after the output of the GMI probe in order to prevent the noise due to the electric field coupling from propagating into the mixer. The DUT was placed into a semi-anechoic chamber to prevent the coaxial cables used in the sideband detection and demodulation system from picking up the radiated noise from the microstrip trace. IV. RESULTS AND DISCUSSIONS Different waveforms were used to excite the microstrip trace, including a 20 MHz, 5 V peak-to-peak sinusoidal wave, a 10 MHz, 5 V peak-to-peak rectangular wave with a 50% duty cycle, and a 15MHz, 5 V peak-to-peak pulse train with a rise/fall time of 10 ns and a pulse width of 12.5 ns. The measured waveforms for the sinusoidal excitation are shown in Fig.8. The upper waveform is the one measured by the GMI probe. The lower one is obtained from the direct measurement of the trace load voltage (i.e., the trace current multiplied with 50 Ω), as a reference. The two waveforms are very similar with a phase shift, which is caused by the difference in cable delays. The measured peak-to-peak magnitude from the GMI probe is approximately 0.6% of the reference voltage. In other words, the transfer coefficient of the GMI probe is approximately 0.3. The measured waveforms for the rectangular excitation are shown in Fig. 9. They are almost the same except at the rising and falling edges. Since the bandwidths of the amplifiers and filters in the measurement setup are limited, the higher frequency spectrum associated with the edges cannot be fully measured by the GMI probe. The transfer coefficient of the GMI probe remains at approximately 0.3. The measured waveforms for the pulse train excitation are shown in Fig. 10. The waveform captured by the GMI probe looks similar to the reference one, with exactly the same period. But the details at the sharp edges are not well captured, again because of the bandwidth limitation of the amplifiers and the filters. The transfer coefficient of the GMI probe in
319
SS-12 Signal and Power Integrity for Multi-Gbps Digital Circuits this case is approximately 0.35, slightly off from the previous two cases. This inaccuracy is probably caused due to the loss of the high-frequency spectral information.
Fig.8: Measured waveforms for the sinusoidal excitation.
Based on the previous discussions, if the time-domain current waveform under measurement has a broadband spectrum, wider band amplifiers and filters have to be used. However, increasing the bandwidth may significantly reduce the signal-to-noise ratio and eventually the proposed currentwaveform measurements could fail. The biggest challenge is that the modulated signal in the current GMI probe design is relatively weak. Better probe designs may be possible to increase the amplitude modulation, and thus significantly improve the signal-to-noise ratio for time-domain measurements. V. CONCLUSIONS GMI probe is very sensitive to magnetic field, and it also has an approximately flat frequency response. These properties make it potentially suitable for time-domain current waveform measurements directly using an oscilloscope. A GMI probe is studied in this paper for its application in IC switching current measurements. A sideband detection and demodulation system is successfully developed, and the current of a microstrip line with different time-varying excitation waveforms is successfully obtained using an oscilloscope. The proposed measurement setup currently suffers from its bandwidth limitation. More improvements in the system and the probe designs are necessary to increase the sensitivity, bandwidth, and signal-to-noise ratio, in order to measure weak and fast-changing currents, such as the IC switching current for power integrity studies. ACKNOWLEDGEMENT This study was supported in part by Industrial Technology Research Grant Program in ′03 from New Energy and Industrial Technology Development Organization (NEDO) of Japan. REFERENCES
Fig. 9: Measured waveforms for the rectangular excitation.
[1]
[2] [3]
[4] [5]
[6]
Fig. 10: Measured waveforms for the pulse train excitation.
320
H. Kikuchi, S. Yabukami, M. Yamaguchi, K. I. Arai, and T. Suzuki “High sensitive detection of ac magnetic field using high-frequency carrier-type thin-film magnetic field sensor with carrier-suppressing circuit” J.Magn.Soc.Jpn., vol 26, pp. 562-565, 2002. K.Tan, K. Yamakawa, T. Komakine, M. Yamaguchi, Y. Kayano, and H. Inoue, ‘‘Detection of wide band signal by a high-frequency-carrier type magnetic probe,’’ J. Appl. Phys., vol. 99, 08B315, 2006. K. Tan, M. Yamaguchi, K. Yamakawa, K.Ocuchi, and K.I. Arai “Micro-Size Magnetic Strip for Ultra High Frequency carrier Type Magnetic Field Sensor,’’ IEEE Transactions on Magnetics, vol. 37, No.4, pp 2004-2006, July 2001. H. Kikuchi, M. Takezawa, M. Yamaguchi, and K. I. Arai, “Analysis of the high-frequency impedance of micromachined films,” J. Magn. Soc. Jpn., vol.21, pp. 782-792, Apr. 1997 Kenji Tan, Takashi Komakine, Kiyoshi Yamakawa, Yoshiki Kayano, Hiroshi Inoue, and Masahiro Yamaguchi “Detection of HighFrequency Magnetic Fields by a GMI probe,” IEEE Transaction on Magentics, vol. 42, No. 10, pp 3229-3331, Oct 206. K. I. Arai, H. Ohdaira, M. Baba, M. Takezawa, M. Yamaguchi, and A. Hage, ‘‘A high-frequency carrier-type thin-film magnetic field sensor,’’ J. Magn. Soc. Jpn., vol. 23, pp. 1617---1620, 1999.