Hindawi Publishing Corporation Shock and Vibration Volume 2016, Article ID 8189373, 10 pages http://dx.doi.org/10.1155/2016/8189373
Research Article Modeling and Experimental Validation for Hammer-Driven Type Penetrators under Horizontal Condition Yi Shen, Shengyuan Jiang, Chuanxi Xu, Weiwei Zhang, and Xiang Wu State Key Laboratory of Robotics and System, Harbin Institute of Technology (HIT), Harbin 150001, China Correspondence should be addressed to Shengyuan Jiang;
[email protected] Received 25 May 2016; Revised 16 September 2016; Accepted 5 October 2016 Academic Editor: Carlo Trigona Copyright © 2016 Yi Shen et al. This is an open access article distributed under the Creative Commons Attribution License, which permits unrestricted use, distribution, and reproduction in any medium, provided the original work is properly cited. This paper proposed a method used to analyze the motion of hammer-driven type penetrators and built a testbed for validating the result of structure optimization of the penetrator in deep space exploration. This method gave a clear understanding of the working principle of the penetrator. The penetrator mainly comprises five components: hammer element, suppressor element, housing element, brake spring, and force spring. Based on the structure of the penetrator, the maximum forward movement of housing element was chosen as optimal object. In order to describe the working process clearly and properly, the working stroke was divided into three phases: unlocking phase, colliding phase, and penetrating phase. In each phase, the displacement and velocity of hammer element, suppressor element, and housing element were described with equation sets when numerically solved. Then, the corresponding parameters of the penetrator were obtained in the testbed with high-speed camera. At last, comparing the parameters obtained by theoretical analysis with that obtained by experiment test with high-speed camera, the perfect ratio of mass element (hammer element, suppressor element, and housing element) and perfect ratio of stiffness of spring element (brake spring and force spring) were obtained.
1. Introduction The chemical component, physical form, mechanical properties, and interior structure of lunar regolith were related to the origin and evolution of the moon [1, 2]. The manned spacecraft or unmanned spacecraft were successfully launched or landed on the moon by America, Soviet Union, China, and other countries since the 1960s. The subsurface regolith characteristics of the moon were explored by drilling sampler and scientific instruments on the spacecraft. The lunar exploratory work had included collection of lunar samples, in situ measure parameters of lunar regolith, and heat flow data and did many other scientific work [3, 4]. All the above scientific work could enrich our understanding greatly of the moon. The penetrating exploration was carried out by Russia, America, ESA, and other countries since the 1990s. The exploration mission is mainly about exploring the subsurface regolith of Mars, Moon, Europa, and other planets. The first principle of this mobile penetrator had been invented and patented by the Russian Mobile Vehicle Engineering Institute
in St. Petersburg [5–7]. The penetrator types include highspeed impact type, hammer-driven type, screw type, and earthworm type. The high-speed impact type penetrators unlike simple impactors and the high-speed impact type penetrators were designed to survive impact and subsequently perform scientific observations [8, 9]. The first theoretical model of the hammer-driven type penetrators’ subsystems motion was proposed ideas by the Space Research Centre PAS [10]. The hammer-driven penetrators advance into loose to moderately strong soils by way of an internal sliding hammer system driven by a small electric motor being in constant rotation during hammering [11]. The screw type penetrator was used for the reactive torque of a wheel to drill into the regolith [12]. The earthworm type penetrators had propulsion unit and an excavation unit. The propulsion unit that was based on the peristaltic crawling of earthworm maintains the body position. The excavation unit excavates and clears a space for the penetrator to tunnel into densely packed soil [13, 14]. The penetrators could dig into depth of the subsurface regolith and do some science-oriented analysis. Compared with traditional drilling samples, the penetrating exploration
2
Shock and Vibration
Hammer element Mole
Suppressor element
Regolith simulant Housing element
(a)
(b)
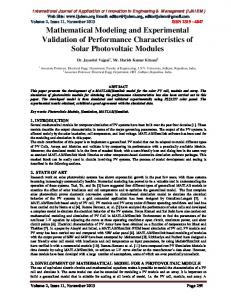
Figure 1: The prototype of HIT-1 penetrator: (a) experimental process of HIT-1 penetrator; (b) structures of HIT-1 penetrator.
had better advantage in weight, mechanical structure, power consumption, and on-orbit work time [15, 16]. The principle of penetrating exploration involves transporting equipment required in scientific research to assigned depth of regolith. In the penetrating process, the physical parameters about regolith were obtained by recording the load of penetration. The subsurface heat flux of the planets and thermal properties of the planetary regolith were obtained through measuring temperature information by fiber optic sensor arrays built in the penetrator [17–20]. In order to collect more and specific scientific message required in planets exploration, the design of compact and lightweight structure was critical to success [21]. In the interaction between penetrator and planetary regolith, the structure of penetrator was key to success. Thus, it has been one of the international research hotspots in outer space exploring field in recent years. In this paper, we proposed a common dynamic model about hammer-driven type penetrators. Under the horizontal condition, the dynamic model is validation to optimize the ratio of mass characteristics and that of stiffness characteristics of the penetrator. The optimization was to improve penetration depth in the same energy storage. In order to validate the model, an impact test device was designed. The impact test device validated the model by matching different mass blocks with different stiffness of springs. The velocity and displacement of the mass were obtained by high-speed camera. The dynamic model was verified by comparing the experimental and the theoretic results. In future study, the dynamic model will be applied to optimize the HIT-1 penetrator.
2. Model and Methods 2.1. HIT-1 Penetrator. HIT-1 mainly consisted of suppressor unit, hammer unit, housing unit, braking spring, and force spring (as shown in Figure 1(b)). The HIT-1 stored energy by periodic rotation suppressor unit shortening force spring.
In one periodic stroke, firstly, trigger mechanism released the hammer; then, the hammer stroked housing unit with certain velocity and momentum; finally, housing unit moved forward under the stroke. The hammer stroked the housing unit periodically and drove the housing unit to a certain depth to simulate regolith (as shown in Figure 1(a)). 2.2. Dynamic Model. The dynamic model mainly consists of five parts: brake spring, actuator, forcing spring, hammer, and housing. To analyze the movement of housing, actuator, and that of hammer during the force spring driving the hammer, the model can be simplified (as shown in Figure 2). In this dynamic model, 𝑀0 , 𝑀1 , and 𝑀2 represent suppressor element, hammer element, and housing element; 𝑘0 and 𝑘1 represent stiffness of brake spring and force spring. 𝜇𝑘 represents kinetic friction coefficient. At the beginning, 𝑀0 , 𝑀1 , and 𝑀2 kept still; a line was tied to actuator and hammer and forced the force spring to store energy; meanwhile, the brake spring kept relaxed. When the line between 𝑀0 and 𝑀1 was cut off, 𝑀0 and 𝑀1 moved against each other and 𝑀2 remained still. Then, 𝑀0 kept moving and compressed spring 𝑘0 continually; 𝑀2 kept still yet. To a certain degree, the force acts on 𝑀2 from the force spring greater than the maximum static friction acting on 𝑀2 ; then, 𝑀2 moved backward. Next, 𝑀1 collided with 𝑀2 and forced 𝑀2 to move forward. At last, 𝑀2 might stop with a certain displacement. In the whole process, the 𝑀2 might move backward first and then moved forward. If the backward displacement is greater than the forward displacement, the displacement of 𝑀2 was negative in this process; otherwise, the displacement of 𝑀2 was positive. 2.3. Modeling and Analysis. The whole movement process of the penetrator was divided into three phases: phase 1: (called unlocking phase for short) the hammer element (𝑀1 ) detached with the suppressor element (𝑀0 ). Phase 2 (called colliding phase for short): the hammer element (𝑀1 ) collides
Shock and Vibration
3 N
k0
k1
k0
M2
M1
M0
S
y 𝜇k o
x
f
k1
k0
M1
M0
M2
k1 M0
𝜇k
(a)
M0
k1
k0 M1
M2
M0
𝜇k
(c)
M2
M1
M2
𝜇k
k1
k0 M1
M0
M1 (d)
k1
k0
𝜇k
(b)
k1
k0
M2
M1
M2
M0
𝜇k
(e)
𝜇k
(f)
k1
k0
M1
M0
M2
𝜇k
(g)
Figure 2: Dynamic model of the penetrator.
with the housing element (𝑀2 ). Phase 3 (called penetrating phase for short): the status of all elements changed after colliding. According to the phases described above, different dynamic model equation set of the penetrator was built in different phases. In order to simplify the colliding model, the hammer element and the housing element were treated as rigid body 𝑀1 and rigid body 𝑀2 . The hammer stroked the static rigid body 𝑀2 with a constant energy (𝐸1 ), ignoring the effect of shocking on contact interface. The dynamic model equation sets were presented as follows. As 𝑥0 , 𝑥1 , and 𝑥2 are the displacements of 𝑀0 , 𝑀1 , and 𝑀2 , 𝑓 represents sliding friction. The sign of sgn and Heaviside mean sign function and step function in MATLAB. 𝑁 is a symbol of force used to simulate resistance of regolith. In order to describe it specifically, we defined several cases as follows. Case 1. 𝑀2 kept still. Case 2. The state of 𝑀2 changed from being static to speedup.
force, 𝑀2 kept still; on the other hand, if the inner force is greater than the outside force, 𝑀2 moved. The state of 𝑀2 was identified automatically by equation set (1). This equation failed when force spring recovered to original length in phase one or Case 3 occurred. The equation set (2) showed the situation that force spring recovered to original length while Case 1 or Case 2 occurred. This equation set failed when 𝑀1 collided with 𝑀2 or Case 3 occurred. The equation set (3) presented the state in phase one, at which Case 3 occurred while the force spring still did not recover to original length. It failed when 𝑀1 collided with 𝑀2 or force spring recover to original length or 𝑀2 slow down and stopped finally. The equation set (4) is used in phase two when 𝑀1 collided with 𝑀2 . And the equation set (5) is used in phase three to describe the state after 𝑀1 collided with 𝑀2 . 𝑀2 𝑥̈ 2 = 𝑘0 (𝑥0 − 𝑥2 )
Case 3. The state of 𝑀2 changed from being static to speedup and then changed to speed-down.
− 𝑓 sgn (𝑥̇ 2 ) heaviside [abs (𝑥0 − 𝑥2 ) −
The equation set (1) was used in phase one; it described the state of each mass block when solved by function of ode45() in MATLAB. In equation set (1), the state of 𝑀2 determined by the gap of the force from braking spring and the friction from outside was positive or negative. If the outside friction force is greater than the inner spring
− 𝑘0 (𝑥0 − 𝑥2 ) heaviside [
𝑓 ] 𝑘0
𝑓 − abs (𝑥0 − 𝑥2 )] 𝑘0
𝑀0 𝑥̈ 0 = 𝑘1 (𝑥1 − 𝑥0 ) − 𝑘0 (𝑥0 − 𝑥2 ) 𝑀1 𝑥̈ 1 = −𝑘1 (𝑥1 − 𝑥0 ) 𝑓 = 𝜇𝑘 𝑔 (𝑀0 + 𝑀1 + 𝑀2 ) + 𝜇𝑘 𝑁
(1)
4
Shock and Vibration 𝑀2 𝑥̈ 2 = 𝑘0 (𝑥0 − 𝑥2 ) − 𝑓 sgn (𝑥̇ 2 ) heaviside [abs (𝑥0 − 𝑥2 ) −
𝑓 ] 𝑘0
𝑓 − 𝑘0 (𝑥0 − 𝑥2 ) heaviside [ − abs (𝑥0 − 𝑥2 )] 𝑘0
(2)
𝑀0 𝑥̈ 0 = −𝑘0 (𝑥0 − 𝑥2 ) 𝑓 = 𝜇𝑘 𝑔 (𝑀0 + 𝑀1 + 𝑀2 ) + 𝜇𝑘 𝑁 𝑀2 𝑥̈ 2 = 𝑘0 (𝑥0 − 𝑥2 ) − 𝑓 sgn (𝑥̇ 2 ) 𝑀0 𝑥̈ 0 = 𝑘1 (𝑥1 − 𝑥0 ) − 𝑘0 (𝑥0 − 𝑥2 ) 𝑀1 𝑥̈ 1 = −𝑘1 (𝑥1 − 𝑥0 )
(3)
𝑓 = 𝜇𝑘 𝑔 (𝑀0 + 𝑀1 + 𝑀2 ) + 𝜇𝑘 𝑁 1 1 1 1 𝑀 𝑥̇ 2 + 𝑀 𝑥̇ 2 = 𝑀 𝑥̇ 2 + 𝑀 𝑥̇ 2 2 1 10 2 1 20 2 1 1 2 2 2
(4)
𝑀1 𝑥̇ 10 + 𝑀2 𝑥̇ 20 = 𝑀1 𝑥̇ 1 + 𝑀2 𝑥̇ 2 𝑀2 𝑥̈ 2 = 𝑘0 (𝑥0 − 𝑥2 ) − 𝑓 sgn (𝑥̇ 2 ) 𝑀0 𝑥̈ 0 = −𝑘0 (𝑥0 − 𝑥2 )
(5)
𝑓 = 𝜇𝑘 𝑔 (𝑀0 + 𝑀1 + 𝑀2 ) + 𝜇𝑘 𝑁. 2.4. Optimal Flow. As presented in the routine, firstly, the sample data was generated and imported into MATLAB (Figure 3); then, the function of ode45() in MATLAB was used to solve equation set (1) in a given time; next, the routine checked the state of 𝑀0 , 𝑀1 , and 𝑀2 along with the time; once anyone of the situations listed in the first judge-box occurred, the state data of 𝑀0 , 𝑀1 , and 𝑀2 was recorded along with the running of the routine and stopped recording when any situation occurred. In the case of situation (1), 𝑀1 was forced by 𝑘1 and moved forward and 𝑀0 was forced by 𝑘1 and moved backward. Then, along with the movement of 𝑀0 and 𝑀1 , to a certain degree, 𝑘1 , 𝑀1 might be separated with 𝑀0 . Situation (2) occurred when the mass of 𝑀1 is greatly bigger than that of 𝑀0 , and 𝑀1 moved slowly while 𝑀0 oscillated in this process; finally, 𝑀0 moved forward with 𝑀1 but faster than 𝑀1 . If situation (3) occurred firstly, the routine was over. In this situation, 𝑀2 moved backward at first and then moved to slow down because the force (𝐹) from 𝑘1 acting on 𝑀2 is less than the friction (𝑓) from outside. And this situation happened when 𝑀0 oscillated greatly. Actually, the oscillation of 𝑀0 could consume a lot of power, which obeyed the destination. Once situation (1) happened, 𝑀1 and 𝑘1 are separated with 𝑀0 ; the system of 𝑘0 -𝑀0 -𝑘1 -𝑀1 -𝑀2 changed into 𝑘0 -𝑀0 -𝑀2 ; the state equation set must be changed into equation set (2). Then, the same method was used to solve the state of 𝑀1 and 𝑀2 in the given time. Next, we judged situations (4) and (5) with the same procedure described
above. Luckily, if situation (4) occurred, it means that the routine can go to next procedure directly; unfortunately, if situation (5) occurred, it means 𝑀2 began to slow down before 𝑀1 and 𝑀2 collided, and the system changed from 𝑘0 -𝑀0 -𝑘1 -𝑀1 -𝑀2 to 𝑘0 -𝑀0 -𝑀2 ; the state equation set must be replaced with equation set (4). In the following, if 𝑀2 slow down to zero before 𝑀1 and 𝑀2 collided (situation (7)), it was the same as situation (3); the routine was over. If it collided firstly (situation (6)), move to next procedure. Situations (2), (4), and (6) move to colliding phase directly. After 𝑀1 collided with 𝑀2 , the velocity of 𝑀1 and 𝑀2 greatly changed. Then the system changed into 𝑘0 -𝑀0 -𝑘2 , solved the equation set, and recorded the state of 𝑀2 until the velocity of 𝑀2 was zero.
3. Device and Tests 3.1. The Impact Test Device Scheme. To analyze the transmission efficiency of impact of penetrator and make it optimal, study on the mass match and the spring stiffness match was necessary. The mass match among 𝑀0 , 𝑀1 , and 𝑀2 and the spring stiffness match in 𝑘0 and 𝑘1 had a great effect on transmission efficiency according to empirical analysis. To verify this point, a testbed was designed. Based on the testbed, the theory dynamic model will be verified, and the regular different ratio of mass and different ratio of stiffness will be confirmed. Furthermore, the resistance was another vital factor to the displacement of housing element. The resistance varies with different regolith and varies in different depth in the same regolith. Clarifying the relation between the resistance and the displacement of housing element was another mission of the testbed. The testbed mainly comprises test platform, high-speed camera, digital data acquisition unit, and integrated computer and simulated penetrator (as shown in Figure 4(a)). The test platform functions as a support which ensures the horizontal condition. high-speed camera was used to capture the transient state of each unit in the test. Integrated computer recorded the transient scenarios and processed the video recorded by high-speed camera. The simulated penetrator consists of weights, string, housing, braking spring, force spring, limiting mechanism, and some studs (as shown in Figure 4(b)). The weights can act as different weight of 𝑀1 , 𝑀2 , and 𝑀0 , if jointed by studs. There were three kinds of the weights: 64 grams, 128 grams, and 192 grams. The testbed works as the following procedures: firstly, choose the weights you want to test and joint them with studs and choose proper stiffness of force spring and brake spring. Then, put the weights and the spring into the housing (as shown in Figure 4(b)). Next, put the simulated penetrator onto the sliding bar and shorten the force spring with the limiting mechanism; the numerical value of shortening can read from the digital caliper. In the following, put a string into the slot made for keeping the state of shortening by limiting mechanism. At the same time, limiting mechanism was removed and the simulated penetrator was free on the slide bar. Finally, the line was cut off suddenly, which ensured 𝑀0 and 𝑀1 are released simultaneously. The shock process lasted only for tens of microseconds so that you cannot
Shock and Vibration
5 Start Input initial data
Solve equation (1) by ode45()
Situation (1) occurs with state (a) or (b)
(1) k1 and M1 separated firstly while M1 and M2 did not collide (2) k1 and M1 did not separate while M1 and M2 collide (3) k0 · abs(x0 − x2 ) less than f twice before (1) and (2) F = k0 · abs(x0 − x2 ) (a) F < f → F > f (b) F < f → F < f (c) F < f → F > f → F < f
Solve equation set (2) by ode45() (4) M1 and M2 collided (5) F = k0 · abs(x0 − x2 ) F < f → F > f → F < f before (1)
Situation (3) occurs with (c)
Situation (4) occurs with state (a) or (b)
Over
Situation (5) occurs firstly Solve equation set (4) by ode45()
(6) M1 and M2 collided (7) The velocity of M2 down to zero
Situation (6) occurs firstly
Situation (7) occurs firstly
M1 collided with M2
Over
Solve equation set (4) by ode45()
The velocity of M1 is zero
No
Yes Over
Figure 3: The optimal flow of dynamic model. High-speed
Integrated computer
camera
Brake
Force
Simulated
spring
spring
penetrator
String Limiting mechanism Weight
Impact test
elements
device (a)
(b)
Figure 4: The impact test device scheme: (a) experimental equipment of the impact test; (b) the components of simulated penetrator.
6
Shock and Vibration k0
M0
M1
Cutting string
k1
Impact test device
M2
(a)
(b)
Figure 5: The test process of impact test device: (a) the preparatory work for the test; (b) experimental process of simulated penetrator.
Table 1: Parameters of impact test device. Parameters The boundary dimension of housing element The boundary dimension of suppressor element The boundary dimension of hammer element The mass of suppressor element The mass of hammer element The mass of housing element The mass of weight Stiffness of brake spring Stiffness of force spring
Symbol — — — 𝑀0 𝑀1 𝑀2 𝑀𝑥 𝑘0 𝑘1
capture it with our eyes. Fortunately, the high-speed camera recorded the process for further study. Then, you can change the weight of 𝑀1 , 𝑀2 , and 𝑀0 as well as changing the stiffness of 𝑘1 and 𝑘0 and test again and again and finally find the best match. 3.2. Experiments Setup. Just as described above, hundreds of tests are conducted with the impact test device (as shown in Figure 5(a)). Each weight of 𝑀1 , 𝑀2 , and 𝑀0 varies from 64 grams to 1024 grams (actually, considering the compatibility of interface, 𝑀0 , 𝑀1 , and 𝑀2 increased based on 289 g, 355 g, and 846 g), certainly, increasing by 64 grams. Each stiffness value of the spring varies from 0.3 N/mm to 9.8 N/mm, and the stiffness value used in the test was listed in Table 1. To reduce the variable parameters, the shortened value of force spring was controlled to a constant value (20 mm). Then, adjusting the brake system to get the appointed friction (the symbol 𝑁 represented the friction in the theory model, and the 𝑁 derived from experiments. Because the theoretical method of calculating 𝑁 involved in the regolith is very complex we conducted another test, in which we used a hydraulic cylinder to drive different types and sizes of head to the appointed depth (1 m) in the simulated regolith (mechanical property: internal friction angle is 26.3∘ , cohesion is 0.33 MPa, and density is 1.79 g/cm3 ); then we acquired the pressure in the whole process in accordance with the pressure sensors,
Value Φ40 × 400 Φ33 × 70 Φ33 × 80 289 + 𝑀𝑥 355 + 𝑀𝑥 846 + 𝑀𝑥 64∼1024 0.3/0.5/1/2/2.9/3.9/4.9/9.8 0.3/0.5/1/2/2.9/3.9/4.9/9.8
Unit mm mm mm g g g g N/mm N/mm
and finally we got the data of 𝑁 in different depth of the simulated regolith). So far, the test was ready. The tests proved that the shock process shared same several procedures. One of the procedures captured by high-speed camera was as shown in Figure 5(b). As you can see, once the string was cut off, 𝑀1 and 𝑀0 moved toward opposition direction, simultaneously; the brake spring was shortened as 𝑀0 moved backward. Then, 𝑀1 is stroked with 𝑀2 and 𝑀2 obtained a velocity. Next, 𝑀2 moved forward and finally slowed down since the resistance acts on 𝑀2 . 3.3. Results and Discuss. The size of the simulated penetrator we built was Φ40 mm × 400 mm, and it is totally built with steel. Then, according to the principle of the simulated penetrator, a set of dynamic equations were built. To further simplify the model, the initial input value of the stiffness of 𝑘1 was confined to a constant value (20 mm). The parameter of each unit used in the test was listed in Table 2. Based on the parameters described above, study on the structure of the simulated penetrator was developed. According to the theory analysis, the maximum displacement in one stroke was 124.2 mm and the minimum displacement in one stroke was −5.3 mm among all the parameters groups. And the parameters group in maximum displacement and the parameters group in minimum displacement were shown in Table 3.
Shock and Vibration
7 140 120 124.2 mm
100 S (mm)
80 60 40 −5.3 mm
20
C
0 −20
B
A 0
2000 4000 6000 8000 10000 12000 14000 16000 18000 n(M0 , M1 , M2 , k0 , k1 ) Theoretical values Experimental values
Figure 6: The displacement curve with every structure parameter: the relationship of S with n.
Table 2: Parameters optimization of dynamic model. Parameters
Table 4: Comparison analysis between the theoretical displacement and experimental displacement.
Symbol
Value
Unit
The mass of suppressor element
𝑀0
0.1∼1.1
kg
The mass of hammer element
𝑀1
0.1∼1.1
kg
The mass of housing element
𝑀2
0.1∼1.1
kg
Theoretical displacement (mm)
Experiment displacement (mm)
Comparative points
1
1.09
−1.205
A
Dates
Step
𝜆𝑀
0.2
—
2
3.206
1.505
Stiffness of brake spring
𝑘0
0.5∼9.5
N/mm
3
𝑘1
3.885
1.329
Stiffness of force spring
0.5∼9.5
N/mm
Step
𝜆𝑘
4
1
—
4.93
2.29
Coefficient of dynamic friction
𝜇𝑘
0.15
—
5
5.828
2.521
6
7.144
6.728
7
8.156
4.844
8
9.467
2.491
9
13.54
12.45
10
11.34
8.409
11
20.73
12.71
12
24.62
17.73
13
37.76
19.91
Table 3: Optimal results of structural parameters. Parameters
Symbol
Value
Unit
The mass of suppressor element
𝑀0
0.1
0.3
kg
The mass of hammer element
𝑀1
1.1
1.1
kg
The mass of housing element
𝑀2
0.3
0.1
kg
Stiffness of brake spring
𝑘0
1.5
9.5
N/mm
Stiffness of force spring
𝑘1
8.5
4.5
N/mm
Coefficient of dynamic friction
𝜇𝑘
0.15
0.15
mm
Displacement of the penetrator
𝑆
124.2
−5.3
mm
Initially, 21600 groups of parameters were prepared to be simulated, but some groups of parameters were not chosen by algorithm; only 16650 groups of parameters finished the three phases and were finally be recorded. Then, the groups of parameters which were selected out were sorted by the value of the displacement of 𝑀2 , which resulted from each group of parameters. The sorted data was shown in Figure 6; each
B
C
theoretical point in the figure represents the displacement of 𝑀2 which resulted from the corresponding parameters. With the available device and equipment, test on the simulated penetrator was conducted. Among hundreds of tests, thirteen typical groups of parameters were chosen to be compared with the theory analysis (as shown in Figure 6). And the value of theoretical displacement and the value of experiment displacement were listed in Table 4. Compared with theoretical points, it was not hard to find that the experimental values were slightly lower than the theoretical values under the same parameter group, but the trend was
Shock and Vibration 2 1.5 1 0.5 0 −0.5 −1 −1.5 −2 −2.5 −3 −3.5
0.4 0.3 0.2 v (m/s)
S (mm)
8
0.1 0 −0.1 −0.2 −0.3
0
0
0.005 0.01 0.015 0.02 0.025 0.03 0.035 0.04 0.045 t (s)
0.005 0.01 0.015 0.02 0.025 0.03 0.035 0.04 0.045 t (s)
Theoretical values Experimental values
Theoretical values Experimental values
(a)
(b)
10 9 8 7 6 5 4 3 2 1 0 −1
1.2 1 0.8 v (m/s)
S (mm)
Figure 7: Comparison analysis between the theoretical and experiment base on A point. (a) The displacement curve with time. (b) The velocity curve with time. The collision conditions: 𝑀0 = 801 g, 𝑀1 = 355 g, 𝑀2 = 846 g, 𝑘0 = 4.9 N/mm, and 𝑘1 = 1 N/mm.
0.6 0.4 0.2 0
0
0.005
0.01
0.015
0.02
0.025
0
0.005
0.01
t (s)
0.015
0.02
0.025
t (s) Theoretical values Experimental values
Theoretical values Experimental values (a)
(b)
Figure 8: Comparison analysis between the theoretical and experiment base on B point. (a) The displacement curve with time. (b) The velocity curve with time. The collision conditions: 𝑀0 = 801 g, 𝑀1 = 355 g, 𝑀2 = 846 g, 𝑘0 = 4.9 N/mm, and 𝑘1 = 9.8 N/mm.
almost the same in a tolerant error range. Further, to confirm this conclusion, the velocity and the displacement of the chosen points (A, B, and C) were compared specifically (as shown in Figures 7, 8, and 9). Comparing the displacement and the velocity of points A, B, and C acquired in test with that recorded in theory analysis, you can find that the trend of the theoretical curve was almost in accordance with that from experiment. The disparity in the time of colliding might be caused by the inevitable error of the postprocessing software provided by high-speed camera. The slight difference in theoretical maximum displacement/velocity and experimental maximum displacement/velocity mainly caused by the friction existed
in experiment and the friction was ignored in theory. The critical values were recorded and listed in Table 5. The relationship between the resistance acting on the penetrator and the displacement of it is another focus of the analysis. According to the theory result, the maximum displacement of the penetrator decreases with the simulated resistance increase. And when the simulated resistance grew to about 500 N, the displacement of the penetrator kept the same and approached to zero (as shown in Figure 10(a)). And the maximum backward displacement increased with the simulated resistance increased when the simulated resistance is less than 60 N, but the backward displacement of the penetrator decreased when the simulated resistance is more
Shock and Vibration
9 1.2
45 40
1
35 0.8
25
v (m/s)
S (mm)
30
20
0.6
15
0.4
10
0.2
5 0
0 0
0.01
0.02
0.03
0.04
0.05
0.06
0
0.07
0.01
0.02
0.03
0.04
0.05
0.06
0.07
t (s)
t (s) Theoretical values Experimental values
Theoretical values Experimental values (a)
(b)
Figure 9: Comparison analysis between the theoretical and experiment base on C point. (a) The displacement curve with time. (b) The velocity curve with time. The collision conditions: 𝑀0 = 801 g, 𝑀1 = 355 g, 𝑀2 = 846 g, 𝑘0 = 0.3 N/mm, and 𝑘1 = 9.8 N/mm.
250
0 −1
200
150
−3 S (mm)
S (mm)
−2
100
−4 −5 −6
50
−7 0
−8 0
100
200
300
400 f (N)
500
600
700
800
(a)
0
100
200
300
400 f (N)
500
600
700
800
(b)
Figure 10: The displacement curve with friction force: the relationship of the 𝑆 with 𝑓: (a) the forward displacement curve with friction force; (b) the backward displacement curve with friction force.
than 60 N. And the displacement of the penetrator is up to zero when the simulated resistance grew to 120 N (as shown in Figure 10(b)). The available device and limited manpower could not validate the analysis parameters groups one by one. So this part did not validate them one by one.
4. Conclusions In this paper, a simplified universal dynamic model of hammer-driven type penetrators in horizontal movement was proposed. Based on the dynamic model, optimality of the structure of hammer-driven type penetrators was developed. According to the numerical analysis result on the condition of 𝑀0 : 𝑀1 : 𝑀2 = 11 : 1 : 3 and 𝑘0 : 𝑘1 = 3 : 17, the displacement of
the penetrator is maximum, and the maximum displacement is 124.2 mm. In the performed experiment for cases A, B, and C the maximum recorded displacement of the mole was 20 mm. Then, to validate the conclusion, a testbed was designed and huge tests were conducted. Comparing the experimental displacement and the experimental velocity with those from theoretical ones, you can find the trend of the curves was coincidental. Next, changing the simulated resistant force that acts on the penetrator, we found that, with the force increasing, the displacement of the penetrator decreases. And once the force increased to a certain value, the displacement of the penetrator, backward or forward, almost kept the same value.
10
Shock and Vibration Table 5: Comparison analysis between the velocities of the A, B, and C points.
Parameters Comparative points Theoretical maximal velocity after colliding firstly Experiment maximal velocity after colliding firstly The first collision time in theory The first collision time in experiment
A 0.3151 0.3981 0.0293 0.0272
Competing Interests The authors declare no conflict of interest.
Acknowledgments This project is supported by Self-Planned Task of State Key Laboratory of Robotics and System (HIT) (no. SKLRS201616B) and the National Natural Science Foundation of China (no. 51575122).
References [1] Z. Y. Ouyang, “Scientific Objectives of Chinese lunar exploration project and development strategy,” Advance in Earth Sciences, vol. 19, pp. 351–358, 2004. [2] Y. C. Deng, Z. Y. Ouyang, X. J. Wang, and Y. L. Zou, “Physical and mechanical properties of lunar regolith,” Journal of Mineralogy and Petrology, vol. 24, pp. 14–19, 2004. [3] P. Davies, A. Phipps, M. Taylor et al., “UK lunar science missions: MoonLITE & MoonRaker,” in Proceedings of the 3rd International Conference on Recent Advances in Space Technologies (RAST ’07), pp. 774–779, Istanbul, Turkey, June 2007. [4] S. Y. Jiang, S. J. Piao, W. W. Zhang et al., “Typical cases analysis and prospects for extraterrestrial subsurface boring exploration,” Journal of Deep Space Exploration, vol. 3, pp. 68– 76, 2016. [5] V. V. Gromov, A. V. Misckevich, E. N. Yudkin, H. Kochan, P. Coste, and E. Re, “The mobile penetrometer, a ‘mole’ for subsurface soil investigation,” in Proceedings of the 7th European Space Mechanisms & Tribology Symposium, pp. 151–156, Noordwijk, The Netherlands, October 1997. [6] Y. Gao, A. Ellery, M. N. Sweeting, and J. Vincent, “Bioinspired drill for planetary sampling: literature survey, conceptual design, and feasibility study,” Journal of Spacecraft and Rockets, vol. 44, no. 3, pp. 703–709, 2007. [7] P. Weiss and K. L. Yung, “Feasibility study of a lunar landing area navigation network deployed by impacting micro-probes,” Planetary and Space Science, vol. 58, no. 6, pp. 893–903, 2010. [8] T. Nakajima, M. Hinada, H. Mizutani, H. Saitoh, J. Kawaguchi, and A. Fujimura, “Lunar penetrator program: LUNAR-A,” Acta Astronautica, vol. 39, no. 1–4, pp. 111–119, 1996. [9] R. A. Gowen, A. Smith, A. D. Fortes et al., “Penetrators for in situ subsurface investigations of Europa,” Advances in Space Research, vol. 48, no. 4, pp. 725–742, 2011. [10] K. Seweryn, J. Grygorczuk, R. Wawrzaszek, M. Banaszkiewicz, T. Rybus, and Ł. Wi´sniewski, “Low velocity penetrators (LVP) driven by hammering action—definition of the principle of operation based on numerical models and experimental tests,” Acta Astronautica, vol. 99, no. 1, pp. 303–317, 2014.
Value B 1.106 0.8404 0.01 0.0084
C 1.141 0.8262 0.01 0.0034
Unit — m/s m/s s s
[11] L. Richter, P. Coste, V. Gromov et al., “Development and testing of subsurface sampling devices for the Beagle 2 lander,” Planetary and Space Science, vol. 50, no. 9, pp. 903–913, 2002. [12] S. Yasuda, K. Komatsu, and S. Tanaka, “Research into selfturning screw mechanism for lunar/planetary exploration,” Transactions of the Japan Society of Mechanical Engineers, Part C, vol. 77, no. 781, pp. 3405–3414, 2011. [13] D. G. Jie, W. W. Zhang, S. Y. Jiang et al., “Research on design of creepy-boring type subsurface investigation device for planetary exploration,” Journal of Deep Space Exploration, vol. 2, pp. 88–93, 2015. [14] H. Omori, T. Murakami, H. Nagai, T. Nakamura, and T. Kubota, “Development of a novel bio-inspired planetary subsurface explorer: initial experimental study by prototype excavator with propulsion and excavation units,” IEEE/ASME Transactions on Mechatronics, vol. 18, no. 2, pp. 459–470, 2013. [15] K. Zacny, S. Nagihara, M. Hedlund et al., “Pneumatic and percussive penetration approaches for heat flow probe emplacement on robotic lunar missions,” Earth, Moon and Planets, vol. 111, no. 1-2, pp. 47–77, 2013. [16] K. Zacny, D. Currie, G. Paulsen, T. Szwarc, and P. Chu, “Development and testing of the pneumatic lunar drill for the emplacement of the corner cube reflector on the Moon,” Planetary and Space Science, vol. 71, no. 1, pp. 131–141, 2012. [17] H. Arisumi, M. Otsuki, and S. Nishida, “Launching penetrator by casting manipulator system,” in Proceedings of the 25th IEEE/RSJ International Conference on Robotics and Intelligent Systems (IROS ’12), pp. 5052–5058, Vilamoura-Algarve, Portugal, October 2012. [18] R. D. Lorenz, W. V. Boynton, and C. Turner, “Demonstration of comet sample collection by penetrator,” Acta Astronautica, vol. 59, no. 8–11, pp. 1000–1007, 2006. [19] R. Jaumann, H. Hiesinger, M. Anand et al., “Geology, geochemistry, and geophysics of the Moon: status of current understanding,” Planetary and Space Science, vol. 74, no. 1, pp. 15–41, 2012. [20] N. I. K¨omle, E. S. H¨utter, W. MacHer et al., “In situ methods for measuring thermal properties and heat flux on planetary bodies,” Planetary and Space Science, vol. 59, no. 8, pp. 639–660, 2011. [21] Y. Shen, D. Wang, S. Y. Jiang et al., “Research on impact type penetrator for lunar regolith exploration project,” Journal of Deep Space Exploration, vol. 2, pp. 213–217, 2015.
International Journal of
Rotating Machinery
Engineering Journal of
Hindawi Publishing Corporation http://www.hindawi.com
Volume 2014
The Scientific World Journal Hindawi Publishing Corporation http://www.hindawi.com
Volume 2014
International Journal of
Distributed Sensor Networks
Journal of
Sensors Hindawi Publishing Corporation http://www.hindawi.com
Volume 2014
Hindawi Publishing Corporation http://www.hindawi.com
Volume 2014
Hindawi Publishing Corporation http://www.hindawi.com
Volume 2014
Journal of
Control Science and Engineering
Advances in
Civil Engineering Hindawi Publishing Corporation http://www.hindawi.com
Hindawi Publishing Corporation http://www.hindawi.com
Volume 2014
Volume 2014
Submit your manuscripts at http://www.hindawi.com Journal of
Journal of
Electrical and Computer Engineering
Robotics Hindawi Publishing Corporation http://www.hindawi.com
Hindawi Publishing Corporation http://www.hindawi.com
Volume 2014
Volume 2014
VLSI Design Advances in OptoElectronics
International Journal of
Navigation and Observation Hindawi Publishing Corporation http://www.hindawi.com
Volume 2014
Hindawi Publishing Corporation http://www.hindawi.com
Hindawi Publishing Corporation http://www.hindawi.com
Chemical Engineering Hindawi Publishing Corporation http://www.hindawi.com
Volume 2014
Volume 2014
Active and Passive Electronic Components
Antennas and Propagation Hindawi Publishing Corporation http://www.hindawi.com
Aerospace Engineering
Hindawi Publishing Corporation http://www.hindawi.com
Volume 2014
Hindawi Publishing Corporation http://www.hindawi.com
Volume 2014
Volume 2014
International Journal of
International Journal of
International Journal of
Modelling & Simulation in Engineering
Volume 2014
Hindawi Publishing Corporation http://www.hindawi.com
Volume 2014
Shock and Vibration Hindawi Publishing Corporation http://www.hindawi.com
Volume 2014
Advances in
Acoustics and Vibration Hindawi Publishing Corporation http://www.hindawi.com
Volume 2014