energies Article
Modeling and Experimental Validation of a Volumetric Expander Suitable for Waste Heat Recovery from an Automotive Internal Combustion Engine Using an Organic Rankine Cycle with Ethanol † José Galindo 1 , Vicente Dolz 1, *,‡ , Lucía Royo-Pascual 1,‡ , Regine Haller 2 and Julien Melis 3 1 2 3
* † ‡
CMT-Motores Térmicos, Polytechnic University of Valencia, 6D Building, Camino de Vera s/n, Valencia 46022, Spain;
[email protected] (J.G.);
[email protected] (L.R.-P.) Valeo Systèmes Thermiques, 8, rue Louis Lormand, La Verrière 78321, France;
[email protected] Exoès S.A.S., 6, avenue de la Grande Lande, Gradignan 33170, France;
[email protected] Correspondence:
[email protected]; Tel.: +34-963-877-650 Part of this work has been presented in 3rd International Seminar on ORC Power Systems, Brussels, Belgium, 12–14 October 2015. These authors contributed equally to this work.
Academic Editor: Sylvain Quoilin Received: 19 January 2016; Accepted: 31 March 2016; Published: 9 April 2016
Abstract: Waste heat recovery (WHR) in exhaust gas flow of automotive engines has proved to be a useful path to increase the overall efficiency of internal combustion engines (ICE). Recovery potentials of up to 7% are shown in several works in the literature. However, most of them are theoretical estimations. Some present results from prototypes fed by steady flows generated in an auxiliary gas tank and not with actual engine exhaust gases. This paper deals with the modeling and experimental validation of an organic Rankine cycle (ORC) with a swash-plate expander integrated in a 2 L turbocharged petrol engine using ethanol as working fluid. A global simulation model of the ORC was developed with a maximum difference of 5%, validated with experimental results. Considering the swash-plate as the main limiting factor, an additional specific submodel was implemented to model the physical phenomena in this element. This model allows simulating the fluid dynamic behavior of the swash-plate expander using a 0D model (Amesim). Differences up to 10.5% between tests and model results were found. Keywords: organic Rankine cycle (ORC); waste heat recovery (WHR); internal combustion engine (ICE); swash-plate; ethanol; modeling; thermal inertia
1. Introduction In the last years, the interest of improvement in efficiency in internal combustion engine (ICE) has increased, together with the entry into force of ever more stringent anti-pollution regulations. Many of these works are focused on the development of new technologies to recover waste heat from ICEs. Saidur et al. [1] propose four different groups to classify these technologies: thermoelectric generators (TEG) [2], organic Rankine cycles (ORC) [3], six-stroke cycle ICE [4] and new developments on turbocharger technology [5,6]. Turbocharging technology for vehicle ICEs has been widely developed in recent decades. In fact, turbochargers are used in practically all Diesel engines found in automotive vehicles. Regarding other available technologies and considering this classification, ORC technology is one of the most promising because of its implementation in the near future engines. ORC technology to recover low-grade heat sources has been wildly developed in geothermal or solar power plants and Energies 2016, 9, 279; doi:10.3390/en9040279
www.mdpi.com/journal/energies
Energies 2016, 9, 279
2 of 18
also in combined heat and power (CHP) in industrial processes. There are many studies about these facilities, both theoretical and experimental. Some of these theoretical studies describe mathematical models of different ORC facilities for recovery these low temperature heat sources. Table 1 presents a summary of several studies with the main characteristics of the described models. Table 1. Summary of papers about organic Rankine cycles (ORC) modeling. EES: engineerig equation solver. References
Model Features
Software
Max. Power
Working Fluid
[7] [8] [9] [10] [11] [12] [13] [14]
ORC with a scroll expander ORC for CHP with a volumetric expander Dynamic ORC model with a turbine ORC with a scroll expander Dynamic ORC model with a turbine ORC with a scroll expander Scroll expander Sliding vane rotary expander
1.5 kW (mechanical) 207 kW (output) 8 MW (net power) 1.8 kW (mechanical) 100 kW 2.16 kW (mechanical) 260 W (mechanical) 2 kW (mechanical)
R245fa R152a, R1234yf, R245fa Isobutene and R134a HCFC-123 R245fa R245fa Air and ammonia R236fa
[15]
Reciprocating expander
[16] [17]
Scroll expander Scroll expander
Amesim Matlab with RefProp Matlab (Simulink) EES Modelica and Dymola Amesim WAVE Ricardo Software and EES Matlab with Refprop -
2.26 kW (output)
Water
2 kW (mechanical) 1.8 kW (mechanical)
Several fluids HCFC-123
At present, some studies try to adapt this technology to waste heat recovery (WHR) on vehicle ICEs. WHR technologies seem to assume an essential role in the new regulations of the forthcoming decade. In ICE applications, space and weight restrictions are greater than in industrial installations, which greatly hinders their adaptation. On the other hand, the thermal power available in these engines for WHR is lower than in industrial processes. Therefore, the optimized expander, mass flows and working fluids for heat recovery in ICEs can be different from the options considered in other applications. Typically, the expanders used in industrial ORC facilities are turbines, screws, scrolls or rotary vane expanders [18]. However, ORC design for automotive engines generally presents a reciprocating machine as the optimal solution to convert waste heat energy into mechanical energy, due to the low working fluid flow, low rotational speeds, high expansion ratio values, fluid drop tolerance during its expansion and space restrictions. ORC solutions in automotive applications should be as light and compact as possible, in order to achieve an efficient system with minor modifications to the existing vehicles. Regarding the working fluids, several authors consider ethanol as a promising fluid due to its good features in the vehicle application temperature range (450–100 ˝ C). Although ethanol is positively evaluated taking into account its environmental, thermo-physical properties and cost, it is classified as a serious hazard by NFPA due to its high flammability. Seher et al. [19] concluded that ethanol is one of the most favorable solutions when a reciprocating machine is used as expander. Howell et al. [20] selected ethanol as the best working fluid for a successful ORC for a heavy duty (HD) truck. Despite these theoretical studies where ethanol has proven to be the most suitable working fluid for this type of installations, few experimental ORC works with this fluid have been published due to the flammability properties [21]. Therefore, it is necessary to take safety measures to prevent accidents arising from the use of this fluid. In previous studies, some methodologies to design these cycles have been proposed [22] and applied to define the main characteristics of an ORC facility for WHR in automotive ICEs. This experimental facility has been assembled and tested in order to estimate the viability of this technology. This installation uses a swash-plate reciprocating expander to transform thermal energy into mechanical energy using ethanol as working fluid. The main objective of this paper is to describe and validate a global simulation model of the ORC and a specific submodel of the main limiting factor of the cycle (the swash-plate expander). The proposed models develop in this article using Amesim are consistent due to the slight deviation between experimental and modelled results. The purpose of these models will be: firstly, it should be used to help the understanding of those physical phenomena which are difficult to observe by means experimentation and secondly, in order to estimate
into mechanical energy using ethanol as working fluid. The main objective of this paper is to describe and validate a global simulation model of the ORC and a specific submodel of the main limiting factor of the cycle (the swash-plate expander). The proposed models develop in this article using Amesim are consistent due to the slight deviation between experimental and modelled results. The purpose Energies 2016, 9, 279 3 of 18 of these models will be: firstly, it should be used to help the understanding of those physical phenomena which are difficult to observe by means experimentation and secondly, in order to the behavior of the cycle without need the for experimental tests under operating conditions that may estimate the behavior of the cyclethe without need for experimental tests under operating conditions cause danger to the installation and/or people. that may cause danger to the installation and/or people. 2. System SystemLayout Layout 2. As the is the of these of this As the expander expander is the most most innovative innovative element element of these cycles, cycles, the the description description of this system system layout has been divided in two parts: in the first part, a general ORC layout is described and in in the layout has been divided in two parts: in the first part, a general ORC layout is described and the second one, the expander is characterized. second one, the expander is characterized. 2.1. Organic Rankine Cycle Layout 2.1. Organic Rankine Cycle Layout In order to perform an experimental evaluation of this system, an ORC test bench was designed In order to perform an experimental evaluation of this system, an ORC test bench was designed and built at CMT-Motores Térmicos in Polytechnic University of Valencia in a research project with and built at CMT-Motores Térmicos in Polytechnic University of Valencia in a research project with the companies Valeo Systèmes Thermiques and Exoès. This facility can be coupled to different types the companies Valeo Systèmes Thermiques and Exoès. This facility can be coupled to different types of automotive combustion engines (an automotive diesel engine, a heavy duty diesel engine and an of automotive combustion engines (an automotive diesel engine, a heavy duty diesel engine and an automotive petrol engine). The test bench recovers energy from exhaust gases of a turbocharged 2 L automotive petrol engine). The test bench recovers energy from exhaust gases of a turbocharged 2 L gasoline engine and exchanges thermal energy to the ethanol side (Figure 1). gasoline engine and exchanges thermal energy to the ethanol side (Figure 1).
Figure 1. ORC mock-up. Figure 1. ORC mock-up.
Figure 2 shows the most relevant components of the ORC mock-up. The running principle is as Figure showsengine the most relevant components of the ORC mock-up. running principle is follows: heat2 from exhaust gases are transferred through the boilerThe to the working fluid, in as follows: heat from engine exhaustinto gases transferred through to the working fluid, this case, ethanol. Then, it is pumped theare high pressure loop and the thenboiler is evaporated in the boiler in this case, ethanol. Then, it is pumped into the high pressure loop and then is evaporated in and slightly superheated. Thus, working fluid under high temperature and high pressurethe is boiler and slightly superheated. fluid under highenthalpy temperature and high pressure is generated. After that, the vapour Thus, flows working into the expander where is converted into effective generated. After by that, the vapour flows into expander where enthalpy is converted intoexpander effective work measured a torque measuring unit.the Low pressure vapour is extracted from the work measured a torque measuring Low pressure extracted the expander and and flows to thebycondenser, reducing unit. its temperature by vapour coolingiswater and from producing condensed flows to the condenser, its temperature cooling and producing condensedaethanol. ethanol. Therefore, thereducing cycle starts again. The by ORC cyclewater contains as main elements: boiler, Therefore, the cycle starts again. The ORC cycle contains as main elements: a boiler, a swash-plate a swash-plate expander, a condenser, a fluid receiver, a subcooler, an expansion vessel and a pump. expander, a condenser, a fluidby receiver, a subcooler, an expansion vessel and athe pump. condenser is The condenser is followed an expansion vessel in order to impose low The pressure in the followed by It anisexpansion orderby to means imposeof the low pressure in the installation. It is connected installation. connectedvessel to theincircuit a three-way valve to the security tank. In closed to the circuit by means of a three-way valve to the security tank. In closed loop systems with volumetric machines, it is needed tanks in order to ensure the proper availability of working fluid in all operating points and not to have pressure pulses in the inlet of the expander. The ethanol tank is connected with the security tank. The security tank is used to absorb the working fluid in case the level is increased
Energies 2016, 9, 279
4 of 17
Energies 2016, 9, 279 loop systems with
4 of 18 volumetric machines, it is needed tanks in order to ensure the proper availability of working fluid in all operating points and not to have pressure pulses in the inlet of the expander. The ethanol tank is connected with the security tank. The security tank is used to absorb the working above the ethanol tank due to pressure pulses. Moreover, this security tank is connected through fluid in case the level is increased above the ethanol tank due to pressure pulses. Moreover, this a manual valve to an additional tank in order to fill the installation. The main elements have been security tank is connected through a manual valve to an additional tank in order to fill the installation. carefully insulated to avoid heat losses to the ambient. The main elements have been carefully insulated to avoid heat losses to the ambient.
Figure 2. ORC scheme. Figure 2. ORC scheme.
The thermodynamic properties of ethanol (pressure and temperature) have been measured The thermodynamic of ethanolverifying (pressure and temperature) measured upstream and downstreamproperties of all components, energy balances and have powerbeen estimations to upstream and downstream of all components, verifying energy balances and power estimations to ensure the proper operation of all the elements [21]. Table 2 synthesizes the absolute uncertainties of ensure the proper operation all the elements [21]. Table 2 synthesizes the absolute uncertainties of all the sensors installed in theofORC mock-up. all the sensors installed in the ORC mock-up. Table 2. Range and accuracy of sensors. Table 2. Range and accuracy of sensors. Variable Measured Type Range ExhaustMeasured gas pressure Piezoresistive 0–2 bar Variable Type Range Ethanol pressure loop Piezoresistive Exhausthigh gas pressure Piezoresistive 0–20–50 bar bar Ethanol low pressure loop Piezoresistive Ethanol high pressure loop Piezoresistive 0–500–5 bar bar EthanolTemperatures low pressure loop Piezoresistive bar °C K-type thermocouples (Class 2) 0–50–1100 ˝C Temperatures K-type thermocouples (Class 2) 0–1100 Ethanol flow meter Coriolis flow meter 0–2720 kg/h Ethanol flow meter Coriolis flow meter 0–2720 kg/h Water flow meter Electromagnetic flow sensor 0.3–1 m/s Water flow meter Electromagnetic flow sensor 0.3–1 m/s Expander rotational speed Optical tachymeter 0–20,000 Expander rotational speed Optical tachymeter 0–20,000 rpm rpm Expander torque meter Strain gauges 0–200 Nm Nm Expander torque meter Strain gauges 0–200
Accuracy 0.05% full scale Accuracy 0.05% scale 0.05% full full scale 0.05% scale 0.05% full full scale 0.05% full°C scale ±2.5 ˝ ˘2.5 ±0.1%C ˘0.1% ±0.5% rate ˘0.5% of of rate ±1 rpm ˘1 rpm 0.05% full full scale 0.05% scale
2.2. Swash-Plate Expander Layout The expander machine used in this installation is a swash-plate expander (Figure 3). It has been delivered by Exoès. Lower flow rates and higher higher expansion expansion ratios ratios could could be be reached reached in in this this machine, machine, thus displacement expanders are considered the main technology for recovering waste heat from low temperature sources and low expander power in vehicle applications. The geometrical features of the expander are listed in Table Table 3. 3. Table 3. Swash-plate characteristics. Pistons Number Bore Pistons Number Bore 5 40 5 40 mm mm
Stroke Maximum Expander Speed Stroke Maximum Expander Speed 31 4500 mm 31 rpm 4500 mm rpm
Energies 2016, 9, 279 Energies 2016, 9, 279
5 of 18 5 of 17
Energies 2016, 9, 279
5 of 17
Figure 3. Swash-plate expander delivered by Exoès.
Figure 3. Swash-plate expander delivered by Exoès. Figure 3. Swash-plate expander delivered by Exoès. of the indicated diagram The expander performance has been characterized by the measurement (Figure 4). Red and green crosses indicate the intake and exhaust valve closing angle (or volume)
The expander expanderperformance performancehas hasbeen been characterized by the measurement of indicated the indicated diagram The characterized theexhaust measurement of the diagram respectively. Red and green circles indicate the intakeby and valve opening angle (or volume) (Figure 4). Red and green crosses indicate the intake and exhaust valve closing angle (or volume) respectively. The area under the P-V curve the work in Jexhaust deliveredvalve by oneclosing piston inangle each cycle. (Figure 4). Red and green crosses indicate theisintake and (or volume) respectively. Redand andgreen greencircles circlesindicate indicate intake and exhaust valve opening angle (or volume) respectively. Red thethe intake and exhaust valve opening angle (or volume) respectively. The area under the P-V curve is the work in J delivered by one piston in each cycle. respectively. The area under the P-V curve is the work in J delivered by one piston in each cycle.
Figure 4. Scheme of P-V diagram.
One GU13P piezoelectric pressure sensor (AVL, Stuttgart, Germany) was placed on the chamber of one of the pistons to evaluate the pressure variations (Figure 5). It allows tracking pressure variations during filling and emptying processes. The piezoelectric transducer was connected to a Figure 4. Scheme of P-V diagram. 5015 charge amplifier (Kistler, Ostfildern, Germany). The pressure-volume diagram is used to Figure 4. Scheme of P-V diagram. describe changes of volume and pressure of a system. A swash-plate expander is a positive machine. It works assensor a two-stroke which means that during oneon revolution, One displacement GU13P piezoelectric pressure (AVL,machine, Stuttgart, Germany) was placed the chamber piston movement from the the top dead (AVL, center (TDC) to(Figure theGermany) bottom center (BDC) and back One GU13P piezoelectric pressure sensor Stuttgart, was placed on the chamber of of one ofwith theapistons to evaluate pressure variations 5). dead It allows tracking pressure again, one working cycle is completed. The superheated vapour flows through the intake port into one of the pistons to evaluate the pressure variations (Figure 5). It allows tracking pressure variations during filling and emptying processes. The piezoelectric transducer was connectedvariations to a the cylinder whose piston is near top dead center. Moving the piston downwards, the vapour during fillingamplifier and emptying processes. TheGermany). piezoelectric was connected 5015 charge 5015 charge (Kistler, Ostfildern, Thetransducer pressure-volume diagramtoisa used to expands and leads out by exhaust ports in the cylinder (slits) situated near the bottom dead center. amplifier (Kistler, Ostfildern, Germany). The pressure-volume diagram is used to describe changes of describe Finally, changes of volume and pressure of a system. A swash-plate expander is a positive the upmoving piston closes the exhaust ports and compresses the vapour remained in the displacement machine. It works as a two-stroke machine, which means that during one revolution, volume and pressure of a system. A swash-plate expander is a positive displacement machine. It works cylinder and the cycle starts again. Furthermore, a TDC sensor is used to know the position of the with a piston from themeans top dead center (TDC) the bottom dead center (BDC) and back BDC.movement TDC is an eddy current-Sensor which delivers signal correlating to distance between as a two-stroke machine, which that during oneato revolution, with a the piston movement from the sensor and the swash-plate. The piezoelectric pressure signal has been referenced using low again, onecenter working cycle is completed. Thecenter superheated vapour the intake into top dead (TDC) to the bottom dead (BDC) and backflows again,through one working cycleport is completed. frequency measurement (piezoresistive sensor). A torque meter measured the torque delivered by the cylinder whose piston is near top dead center. Moving piston whose downwards, thenear vapour The superheated vapour flows through the intake port into thethe cylinder piston is top dead the expander. In order to measure the expander speed with an ordinary brake, a pulley system was expands and leads out by exhaust ports in the cylinder (slits) situated near the bottom dead center. center. Moving piston downwards, the vapour and leads out exhaust ports in the installed the in order to increase the expander speed toexpands a brake feasible speed. Anby exterior oil loop Finally, the upmoving piston closes the exhaust ports and compresses the vapour remained in exhaust the lubricates the swash-plate expander. cylinder (slits) situated near the bottom dead center. Finally, the upmoving piston closes the
cylinder and the cycle starts again. Furthermore, a TDC sensor is used to know the position of the ports and compresses the vapour remained in the cylinder and the cycle starts again. Furthermore, a BDC. TDC is an eddy current-Sensor which delivers a signal correlating to the distance between TDC sensor is used to know the position of the BDC. TDC is an eddy current-Sensor which delivers sensor and the swash-plate. The piezoelectric pressure signal has been referenced using low a signal correlating to the distance between sensor and the swash-plate. The piezoelectric pressure frequency measurement (piezoresistive sensor). A torque meter measured the torque delivered by signal has been referenced using low frequency measurement (piezoresistive sensor). A torque meter the expander. In order to measure the expander speed with an ordinary brake, a pulley system was measured the torque delivered by the expander. In order to measure the expander speed with an installed in order to increase the expander speed to a brake feasible speed. An exterior oil loop ordinary a pulley expander. system was installed in order to increase the expander speed to a brake lubricates brake, the swash-plate feasible speed. An exterior oil loop lubricates the swash-plate expander.
Energies 2016, 9, 279
6 of 18
Energies 2016, 9, 279
6 of 17
Energies 2016, 9, 279
6 of 17
Figure 5. Swash-plate expander scheme. TDC: top dead center.
Figure 5. Swash-plate expander scheme. TDC: top dead center.
The analysis of P-V diagrams in different conditions can be used to identify the irreversibilities ofThe the analysis expansionofmachine. All the signals were recorded with a sampling of the 50 kHz and P-V diagrams in different conditions can be used frequency to identify irreversibilities Figure 5. Swash-plate expander scheme. TDC:was topfixed dead center. processed with program Labview. The engine operating point until the expander variables of the expansion machine. All the signals were recorded with a sampling frequency of 50 kHz and were constant (after approximately 15 min). Then, the pressure inside the cylinder was measured processed The with program Labview. The engine operating point was until the expander variables P-V diagrams in cycles different conditions usedfixed to identify the irreversibilities during 2 s, analysis which isof approximately 50 (depending oncan thebe expander speed). After that all the were constant (after approximately 15 min). Then, the pressure inside the cylinder was measured of the expansion machine. All the signals were recorded cycles were processed and plotted one over the other cycles.with a sampling frequency of 50 kHz and duringprocessed 2 s, which approximately onwas the fixed expander speed). After that all the withisprogram Labview. 50 Thecycles engine(depending operating point until the expander variables were constant (after approximately 15 min). Then, the pressure inside the cylinder was measured cycles were processed and plotted one over the other cycles. 3. Modelling during 2 s, which is approximately 50 cycles (depending on the expander speed). After that all the The authors have developed a comprehensive model of the ORC using Amesim. Considering 3. Modelling cycles were processed and plotted one over the other cycles. the swash-plate expander as the most critical element, one additional specific submodel was implemented model the physical phenomena inside the piston the swash-plate expander. The The authorstohave developed a comprehensive model of theofORC using Amesim. Considering the 3. Modelling software package provides a 0D model suite to simulate and analyze multi-domain intelligent swash-plate expander as the most critical element, one additional specific submodel was implemented The authors have their developed a comprehensive model of the usingconsists Amesim.ofConsidering systems, and to predict multi-disciplinary performances. ThisORC software available to model the physical phenomena inside thecritical piston of the swash-plate expander. The software package the swash-plate expander as the most element, one additional specific submodel was object-oriented libraries, where the user should connect them properly and fix the parameters. provides a 0D model suite to simulate and analyze multi-domain intelligent systems, and to predict implemented to model the physical phenomena inside the piston of the swash-plate expander. The their3.1. multi-disciplinary performances. Thissuite software consists available object-oriented libraries, software package provides 0D model to simulate andofanalyze multi-domain intelligent Global Organic Rankine CycleaModel wheresystems, the userand should connect them properly andperformances. fix the parameters. to predict their multi-disciplinary This software consists of available A simple layout of the ORC consisting of a boiler, a positive displacement pump, a volumetric object-oriented libraries, where the user should connect them properly and fix the parameters. expander, a fluid receiver, a condenser and an expansion vessel is considered in this model. Figure 6 3.1. Global Organic Rankine Cycle Model shows the Amesim of Cycle the cycle based on the ORC installation. A detailed description for the 3.1. Global Organicmodel Rankine Model main assumptions presentedof inathe following subsections. A simple layoutinofthis themodel ORCare consisting boiler, a positive displacement pump, a volumetric simple layout of the ORC consisting of a boiler, a positive displacement pump, a volumetric expander, A a fluid receiver, a condenser and an expansion vessel is considered in this model. Figure 6 expander, a fluid receiver, a condenser and an expansion vessel is considered in this model. Figure 6 shows the Amesim model of the cycle based on the ORC installation. A detailed description for the shows the Amesim model of the cycle based on the ORC installation. A detailed description for the main assumptions in this model areare presented followingsubsections. subsections. main assumptions in this model presentedin in the the following
Figure 6. ORC model. Working fluid.
Figure 6. ORC model. Working fluid. Figure 6. ORC model. Working fluid.
Energies 2016, 9, 279
7 of 18
In the modelling of a particular working fluid it is crucial to be able to reproduce both the thermodynamic and transport properties of the working fluid. Amesim provides built-in physical-thermo property data of different fluids. In this case the working fluid is ethanol. Table 4 summarizes the main characteristics of the working fluid. Table 4. Properties of ethanol. Property Chemical formula Critical temperature Critical pressure Atmospheric boiling point Ozone depletion potential Global warming potential NFPA health hazard NFPA flammability hazard Auto ignition temperature
Ethanol Tc Pc Tb ODP GWP H F Tign
C2 H6 O 240.9 61.4 78.3 0 n/a 2 3 363
˝C
bar ˝C ˝C
3.1.1. Heat Exchangers The boiler releases heat from exhaust gases to working fluid, based on plate and fin technology. This is a countercurrent heat exchanger, designed to withstand a maximum pressure of 40 bar. The condenser and the subcooler are plate and fin heat exchangers selected from industrial residential products. The condenser used in the experimental setup is a fin plate exchanger with ethanol as the hot loop and water as the cold loop. It is a stainless steel heat exchanger chosen among industrial residential products. The exchanger was set up in counter current configuration. This is a practical solution to ensure saturated liquid leaves the condenser so that the pump can operate properly. As the operating pressures of this component are relatively low, around 2 bar on both sides, no special attention is required. Plate and fin technology is preferred by the vast majority of the applications due to its compactness and high level of efficiency. A 0D discretization model with different small volumes of both elements (boiler and condenser) is presented by a two-counter flow streams. In the case of the boiler, the exhaust gases and the ethanol represent the hot and cold source respectively. In the case of the condenser, the ethanol and the cooling medium (water) represent the hot and cold source respectively. In each element, the volume has been divided in 3 small volumes, which in global terms exchanges the net thermal power of the global element. The heat exchange process takes into account both convective and conducting (just in longitudinal direction) process. Depending on the process, (boiling or condensation) different correlations implemented in Amesim have been taken into account. Shah correlation [23] and Verein Deutscher Ingenieure (VDI) for horizontal tubes correlation [24] were used for condensation and boiling process respectively. In order to improve the boiler model and take into account the thermal inertia properly, thermal capacities were adjusted using a transient experimental test. This was performed varying the engine exhaust gases power (and therefore, heat source) from 20 kW to 25 kW. Therefore, the experimental values of exhaust gases mass flow, temperature at the inlet in the exhaust gases side, ethanol mass flow and temperature and pressure at the inlet of the boiler in the ethanol side were used to validate this model. The objective of this validation was to obtain a similar temperature profile at the outlet of the boiler in the ethanol side, considering thermal inertias. 3.1.2. Volumetric Expander The swash-plate expander is the main element of the ORC system because it has a great impact in the overall system efficiency. The expander model uses three parameters to characterize the performance of the expander, i.e., isentropic efficiency in Equation (1), mechanical efficiency in Equation (2) and volumetric efficiency in Equation (3):
Energies 2016, 9, 279
8 of 18
.
ηiso “
W ind
(1)
.
W iso .
ηmec “
Ws
(2)
.
W ind .
.
W iso
mET ηvol “ ρET ˆ pNExp {60q ˆ Disp ` ˘ . “ mET ˆ hin_Exp_ET ´ hout_Exp_ET_iso .
W ind “ Wind ˆ ncyl ˆ NExp ˆ .
W s “ τExp ˆ NExp ˆ .
.
2ˆπ 60
1 60
(3) (4) (5) (6)
.
where W iso , W ind and W s are isentropic, indicated and shaft power respectively. They have been . calculated using Equations (4)–(6) respectively. mET is the mass flow through the expander, hin_Exp_ET is the enthalpy at the inlet of the expander (calculated by using temperature and pressure at the inlet), hout_Exp_ETiso is the isentropic enthalpy at the outlet of the expander (calculated by using pressure at the outlet and entropy at the inlet). Regarding the expander power, Wind is the indicated work in J, NExp is the expander speed (rpm) and ncyl the number of cylinders of the expander. Regarding the volumetric efficiency, ρET is the density of the ethanol at the inlet of the expander and Disp is the volume displaced by the expander. No leakages and internal pressure drops have been taken into account in this expander model. Thermal conduction with internal walls of the swash-plate expander is considered to model heat losses to the ambient. 3.1.3. Pump A fixed displacement pump is used in this model. The mass flow rate is obtained from volumetric efficiency. Mechanical and isentropic efficiency and the swept volume define the enthalpy increase. No correlations have been considered for efficiencies. Instead, some fixed values were specified for the points modelled, i.e., an isentropic efficiency of 80% and a displacement of 5 cm3 . 3.1.4. Pipes and Pressure Drops Internal piping losses in the system have been taken into account using hydraulic resistances. The transformation process is assumed isenthalpic. Using these elements both enthalpies and mass flows are computed. Pressure drops in the system have been calculated using correlations available in Amesim. The hydraulic diameter and the cross-sectional area were used to model different cross-sectional geometries. The pressure drops are regular and the friction factor depends on the flow regime and the relative roughness of the duct. Depending on the state of the fluid different correlations were applied: In the single phase flow (liquid or vapour) the Churchill [25] correlation was used, while in the two phase flow (TPF) the McAdams et al. [26] correlation was implemented. This correlation is used for computing pressure drop inside tubes in vaporization process. 3.1.5. Expansion Vessel The expansion vessel is modelled using a tank with modulated pressure and constant specific enthalpy. The user must specify the low pressure value with a constant.
Energies 2016, 9, 279
9 of 18
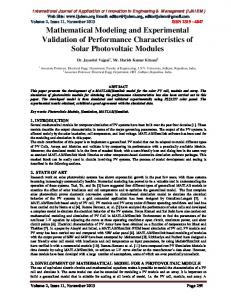
3.2. Swash-Plate Specific Model As shown previously, the volumetric expander tested in this installation is a swash-plate expander. Although in the global ORC model an Amesim submodel of the TPF library was used for modelling the expander using volumetric, isentropic and mechanical efficiencies, the need for an expander physical Energies 2016, 9, 279 9 of 17 model has led to the development of a specific model for just the swash-plate expander. Figure 77 shows shows the the swash-plate swash-plate expander expander model. model. Taking Taking into into account account the the number number of of pistons pistons in in Figure the swash-plate swash-plate expander, inin thethe compression andand expansion process, the swash-plate the expander,the theheat heattransfer transfer compression expansion process, the swashmechanism and mechanical losses, a swash-plate expander model was developed to the plate mechanism and mechanical losses, a swash-plate expander model was developedsimulate to simulate performance of the expander. It was modelled using Amesim and validated with the experimental the performance of the expander. It was modelled using Amesim and validated with the tests developed in developed the expander. The comparison P-Vbetween diagrams (modelled tested) and was experimental tests in the expander. The between comparison P-V diagramsand (modelled used to estimate the accuracy of the model. tested) was used to estimate the accuracy of the model.
Figure 7. Swash-plate expander model. Figure 7. Swash-plate expander model.
Figure 8 shows a zoom of the piston expander modelled in Amesim. The main part of the model Figure shows a zoomwith of the pistonvolume expander Amesim. The main part ofThis the consists of a8 TPF chamber variable andmodelled pressureinand temperature dynamics. model consists of a TPF chamber withthe variable volume and library pressuremodel and temperature This submodel has been modified from Amesim original to take intodynamics. account heat submodel has been modified from the Amesim original library model to take into account heat transfer transfer during compression and expansion. The filling (intake valve) and emptying (exhaust valve) during compression and expansion. The filling (intakeduring valve) the andprocess. emptying (exhaust valve)(obtained processes processes provide the mass and pressure exchanges The angle signal provide the mass and pressure exchanges during the process. The angle signal (obtained from the from the expander speed) is used in three parts of the model: expander speed) is used in three parts of the model: In the heat transfer element: Although the expander was insulated, the expansion and compression do not follow an adiabatic process. The transformation is rather polytropic with a ‚ In the heat transfer element: Although the expander was insulated, the expansion and compression heat exchange between the working fluid and the expander walls due to friction, temperature do not follow an adiabatic process. The transformation is rather polytropic with a heat exchange differences and possible condensation effects in the piston chamber. Therefore, the angle signal between the working fluid and the expander walls due to friction, temperature differences and was used to consider the angles of compression and expansion and to apply for each process a possible condensation effects in the piston chamber. Therefore, the angle signal was used to heat transfer coefficient to model these phenomena. consider the angles of compression and expansion and to apply for each process a heat transfer In the valves: The angle was considered to take into account the discharge coefficient for the coefficient to model these phenomena. intake and the exhaust valve at each particular angle. ‚ In the valves: The angle was considered to take into account the discharge coefficient for the In the rotary-linear transformer: It was considered to calculate the absolute displacement in intake and the exhaust valve at each particular angle. Equation (7) and therefore the volume variation in Equation (8) of the piston as a function of the swash-plate angle: 𝑋(Ф) = 𝑅sw × (1 − cos(Ф)) × tan(αsw ) 𝑉(Ф) = 𝑉d + π ×
𝐵2
× 𝑋(Ф)
(7) (8)
Energies 2016, 9, 279
‚
10 of 18
In the rotary-linear transformer: It was considered to calculate the absolute displacement in Equation (7) and therefore the volume variation in Equation (8) of the piston as a function of the swash-plate angle: (7) X pΦq “ Rsw ˆ p1 ´ cos pΦqq ˆ tan pαsw q V pΦq “ Vd ` π ˆ
Energies 2016, 9, 279 Energies 2016, 9, where R279 is
B2 ˆ X pΦq 4
(8) 10 of 17 of 17 the10angle
the radius of the swash-plate (m), αsw is the swash-plate angle (˝ ), Φ is 3 ), B is the bore (m), X pΦq is the displacement of covered by the piston, V dswash-plate is the dead volume where Rsw is the radius of the (m), αsw(m is the swash-plate angle (°), Ф is the angle covered where R sw is the radius of the swash-plate (m), α sw is the swash-plate angle effects (°), Ф is thebeen anglemodelled. covered 3 ). No leakages 3 thepiston, piston V (m) pΦq volume is the volume the piston have by the d isand the Vdead (m ), of B is the bore (m (m), 𝑋(Ф) is the displacement of the piston by the piston, Vd is the dead volume (m3), B 3is the bore (m), 𝑋(Ф) is the displacement of the piston (m) and 𝑉(Ф) is the volume of the piston (m ). No leakages effects have been modelled. (m) and 𝑉(Ф) is the volume of the piston (m3). No leakages effects have been modelled. sw
Figure 8. 8. Zoom swash-plate piston piston expander expander model. model. Figure Zoom swash-plate swash-plate Figure 8. Zoom piston expander model.
Figure 9. Validation of mechanical losses. Figure 9. Validation of mechanical losses. Figure 9. Validation of mechanical losses.
Regarding mechanical losses, they were estimated using experimental values [21]. The following Regarding mechanical losses, they were estimated using experimental values [21]. The following correlation was obtained, taking into account the expansion ratio and the expander speed: Regarding losses,into they were estimated usingratio experimental values [21]. The following correlation was mechanical obtained, taking account the expansion and the expander speed: correlation was obtained, taking into account the expansion ratio and the expander speed: 𝑃In_Exp_ET 𝑀𝑒𝑐ℎ𝑎𝑛𝑖𝑐𝑎𝑙 𝑙𝑜𝑠𝑠𝑒𝑠 (𝑊) = 4528.22 − 0.1126 × 𝑁Exp − 285.788 × 𝑃In_Exp_ET (9) 𝑀𝑒𝑐ℎ𝑎𝑛𝑖𝑐𝑎𝑙 𝑙𝑜𝑠𝑠𝑒𝑠 (𝑊) = 4528.22 − 0.1126 × 𝑁Exp − 285.788 × 𝑃Out_Exp_ET (9) P 𝑃 In_Exp_ET Mechanical losses pWq “ 4528.22 ´ 𝑃0.1126 ˆ NExp ´ 285.788 ˆ Out_Exp_ET (9) In_Exp_ET Out_Exp_ET where 𝑁Exp is the expander speed in rpm and 𝑃In_Exp_ET is the expansion ratioPthrough the expander. where 𝑁Exp is the expander speed in rpm and 𝑃Out_Exp_ET is the expansion ratio through the expander. Figure 9 shows the validation of Equation (9)𝑃Out_Exp_ET between estimation and experimental values with a Figure 9 shows the validation of Equation (9) between estimation and experimental values with a 2 correlation coefficient (R ) of 96%. correlation coefficient (R2) of 96%. 4. Model Validation 4. Model Validation 4.1. Global Organic Rankine Cycle Model
Energies 2016, 9, 279
11 of 18
P
In_Exp_ET where NExp is the expander speed in rpm and POut_Exp_ET is the expansion ratio through the expander. Figure 9 shows the validation of Equation (9) between estimation and experimental values with a correlation coefficient (R2 ) of 96%.
4. Model Validation 4.1. Global Organic Rankine Cycle Model In order to characterize the ORC system, three points have been tested at different steady working conditions of the ORC system, varying the expander speed (P1: 2000 rpm, P2: 2500 rpm and P3: 3000 rpm). The gasoline engine used in these tests is an inline four-cylinder turbocharged engine (Ford Ecoboost) with a volumetric capacity of 2 L. The engine steady-state operating point has remained constant with a value of 25 kW. The points presented in this study aim to show the recovery features at different expander operating points [21]. In these tests, the system has been controlled commanding three parameters: the speed of the pump, in order to control the mass flow of ethanol flowing through the installation, the balloon pressure of the expansion vessel, in order to control the outlet pressure of the expander, and the expander speed, in order to control the high pressure at the inlet of the expander. Table 5 shows the inputs of the ORC model. For each point (P1, P2 and P3), the mass flow of the expander, the pressure at the inlet of the pump, the expander speed, the temperature at the inlet of the boiler inthe EG side, the pressure at the boiler in the EG side, the mass flow of the exhaust gases and the temperature at the inlet of the condenser in the water side were fixed. Table 5. Inputs of the ORC model. Variable .
m ET P_in_PP_ET NExp T_in_B_EG P_out_B_EG . m EG T_in_C_W
P1
P2
P3
Units
73.85 1.571 2001 749.5 1.018 154.98 48.5
75.99 1.899 2502 740 1.024 159.47 49
74.79 1.589 3003 749 1.018 155.25 48
kg/h bar rpm ˝C bar kg/h ˝C
Table 6 shows the volumetric, the isentropic, the mechanical efficiency (calculated using Equations (1)–(3)) and the global efficiency of the expander (defined by the isentropic efficiency times the mechanical efficiency). They have been fixed in the model. Table 6. Experimental efficiencies of the swash-plate expander. Variable .
W ind . W mec . W iso ηvol ηiso ηmec ηglob
P1
P2
P3
Units
1739 1649 3431 19.37% 50.68% 94.81% 48.05%
2007 1543 3413 17.21% 58.81% 76.90% 45.22%
1874 1531 3338 14.54% 56.14% 81.72% 45.88%
W W W -
Table 7 presents the outputs of the model for the three points tested. For each point three columns are presented, the first one, called “Pi E”, corresponds to the experimental values, the second one, called “Pi M”, corresponds to the modelled values and the last one, called “Dif.”, corresponds to the
Energies 2016, 9, 279
12 of 18
absolute difference experimental-modelled. Temperatures are given in ˝ C, pressures in bar, and torque in Nm. Table 7. Outputs of the ORC model. Variable T_out_PP_ET T_out_B_ET T_out_Exp_ET T_in_C_ET T_out_C_ET T_in_PP_ET T_out_C_W P_out_PP_ET P_in_Exp_ET P_in_C_ET Energies 2016, 9, 279 τExp
Energies 2016, 9, 279
P1 E
P1 M
47.5 210 105 104 48 46.5 74 34.26 28.65 1.89 7.81
46.5 209 116 102.5 48.5 46 71 34.26 29.57 1.89 7.98
Difference P2 E 0.31% 0.33% 3.04% 0.33% 0.10% 0.28% 0.71% 0.01% 3.20% 0.20% 2.18%
47 215 109 103 48 46.5 67 31.01 27.00 2.01 5.86
P2 M
Dif.
P3 E
P3 M
Dif.
46 199 107 99 48.5 46 69 31.48 26.53 2.10 5.59
0.25% 3.28% 0.50% 1.16% 0.17% 0.23% 0.52% 1.51% 1.74% 4.48% 4.47%
48.5 208 111 102 48 47.5 73 31.77 26.01 1.90 4.87
46 201 110 97 48.5 46 71.5 31.16 26.36 1.88 4.96
0.70% 1.44% 0.30% 1.37% 0.22% 0.53% 0.38% 1.92% 1.33% 0.95% 1.85%
Units ˝C ˝C ˝C ˝C ˝C ˝C ˝C bar bar bar Nm
12 of 17 12 of 17
Figures 10–13 show the validation of this inmodel in each particular point. As regards Figures 10–13show show the of this each particular As regards temperatures, Figures 10–13 thevalidation validation ofmodel this model in eachpoint. particular point. As regards temperatures, the maximum deviation corresponds to the temperature atexpander the inlet of the2500 expander in the maximum corresponds the temperature at temperature the inlet of theat rpm, in temperatures, the deviation maximum deviation to corresponds to the the inletinofthe the expander the 2500 rpm, with a value of 3.28% (Figure 11). The remainder temperatures of the cycle are modelled with a value of 3.28% (Figure 11). The remainder temperatures of the cycle are modelled with a the 2500 rpm, with a value of 3.28% (Figure 11). The remainder temperatures of the cycle are modelled withdifference a difference than 3%. Regarding pressures, the deviation maximum deviationtocorresponds to the lowerlower than 3%. Regarding pressures, the maximum corresponds the pressure at with a difference lower than 3%. Regarding pressures, the maximum deviation corresponds to the the inlet condenser the 2500 rpm, valuerpm, of 4.48% (Figure 11). The remainder pressures pressure at of thetheinlet of theincondenser inwith the a2500 with a value of 4.48% (Figure 11). The pressure at the inlet of the condenser in the 2500 rpm, with a value oftorque 4.48% (Figureby11). of the system are calculated with a difference of 3%. The last parameter is the delivered theisThe remainder pressures of the system are calculated with a difference of 3%. The last parameter the remainder pressures of the system are calculated with aisdifference of 3%. lastare parameter the expander (Figure 13), in which the maximum approximately 4%,The which in order ofis 4%, torque delivered by the expander (Figure 13), indeviation which the maximum deviation is approximately torque delivered expander errors. (Figure 13), in which the maximum deviation is approximately 4%, magnitude of by theofthe measurement which are in order magnitude of the measurement errors. which are in order of magnitude of the measurement errors.
Figure 10. Validation of 2000 rpm. Figure10. 10.Validation Validation of Figure of2000 2000rpm. rpm.
Figure 11. Validation of 2500 rpm. Figure 11. Validation of 2500 rpm. Figure 11. Validation of 2500 rpm.
Energies 2016, 9, 279
13 of 18
Figure 11. Validation of 2500 rpm. Figure 11. Validation of 2500 rpm.
Figure 12. Validation of 3000 rpm. Figure12. 12. Validation Validation of Figure of3000 3000rpm. rpm.
Figure 13. Validation of torque. Figure 13. Validation of torque. Figure 13. Validation of torque.
Energies 2016, 9, 279
13 of 17
Regardingthe the thermal thermal inertias thethe boiler, the modelled and experimental curves of curves temperature Regarding inertiasofof boiler, the modelled and experimental of variation outside the boiler in the ethanol side as a function of time were compared. As shown temperature variation outside the boiler in the ethanol side as a function of time were compared. As in Figure the 14, temperature at the outlet the of boiler in the in ethanol side considering a mass of 3 kg shown in 14, Figure the temperature at the of outlet the boiler the ethanol side considering a mass node) to fit quitetowell experimental value. Temperatures lower of (1 3 kg kg in(1each kg in eachseem node) seem fit with quitethe well with the experimental value. differences Temperatures than 4% were found comparing model and experimental values. differences lower than 4% were found comparing model and experimental values.
Figure 14. Validation of temperature in the boiler. Figure 14. Validation of temperature in the boiler.
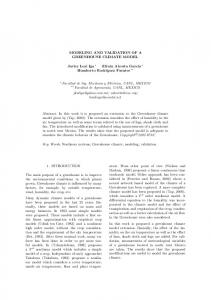
4.2. Swash-Plate Specific Model The modelled and experimental curves of the pressure variation inside the expander chamber as a function of volume are compared for the three points tested in previous sections (3000 rpm, 2500 rpm and 2000 rpm) in Figures 15–17.
Energies 2016, 9, 279
14 of 18 Figure 14. Validation of temperature in the boiler.
4.2. Swash-Plate Specific Model
4.2. Swash-Plate Specific Model
The modelled and experimental curves of the pressure variation inside the expander chamber as a The modelled and experimental curves of the pressure variation inside the expander chamber function of volume are compared for the three points tested in previous sections (3000 rpm, 2500 rpm as a function of volume are compared for the three points tested in previous sections (3000 rpm, 2500 and 2000 in Figures rpmrpm) and 2000 rpm) in 15–17. Figures 15–17.
Figure 15. P-V Diagram 3000 rpm.
Energies 2016, 9, 279
Figure 15. P-V Diagram 3000 rpm.
Figure 16. P-V Diagram 2500 rpm.
Figure 16. P-V Diagram 2500 rpm.
14 of 17
Energies 2016, 9, 279
15 of 18
Figure 16. P-V Diagram 2500 rpm.
Figure 17. P-V Diagram 2000 rpm. Figure 17. P-V Diagram 2000 rpm.
It was found a quite good agreement between experimental and modelled results in terms of It waswork found a quite good experimental and modelled terms of indicated delivered by theagreement expander. between In the right corner of these diagrams results both theinindicated indicated work delivered by the expander. In the right corner of these diagrams both the indicated work and the expander speed were presented. Differences up to 10.5% could be found in these models due to pressure drop in the valves and effects of pulsating flow, which is not modelled in Amesim with the TPF library. Table 8. Results of the swash-plate model. Variable
P1
P2
P3
Units
I/O
Pin_Exp_ET NExp W ind_E W ind_M . W ind_E . W ind_M Dif. Power (%)
28.65 2001 18 20 1739 1857 6.79%
27.00 2502 16 15 2007 1877 6.48%
26.01 3003 13 12 1874 1678 10.46%
bar rpm J J W W -
Input Input Output Output -
Table 8 summarizes the results of the models. The inputs of the model were obtained from pressure measurements at the inlet of the expander and expander speed. In order to take into account differences between heat transferred in the three points, the coefficients of compression and expansion were modified. In this model the higher the expander speed is, the higher heat transfer rate should be imposed in the model. Table 8 also shows the results of the indicated power in W. The maximum power deviation between experimental and modelled results corresponds to 10% in the point of 3000 rpm, which is considered acceptable to predict flow behavior. Although in this point the P-V diagram fits better than the others, the expander speed modifies this effect due to the computation of the indicated
Energies 2016, 9, 279
16 of 18
power using Equation (5). Besides, the model predicts properly the filling and emptying processes, as it can be seen in Figures 15–17. 5. Conclusions The presented work describes and analyzes some models based on an experimental ORC installation installed in a turbocharged 2.0 L gasoline engine to recover waste heat in exhaust gases. These models correspond on the one hand to the global ORC cycle and on the other hand to a specific submodel of the swash-plate expander. The comparison of performance parameters have been made in three points by means of changing the inputs and obtaining the outputs of the model. The results are summarized in the following points: (1)
(2)
An ORC model was developed using the software Amesim. This model allows to simulate the main parameters measured in the cycle. Comparing the three steady operating points, a maximum deviation of 4% regarding pressures and temperatures and a value of 5% regarding torque was attained. A swash-plate expander model was presented using the software Amesim. This model represents the fluid dynamic behavior of the swash-plate using discharge coefficients, displacement laws, heat transfer coefficients and mechanical losses. The P-V diagram was measured by a piezoelectric pressure sensor and was compared to the expander model one. Maximum deviation of 10% in indicated power was achieved at point of 3000 rpm.
Acknowledgments: This work is part of a research project called “Evaluation of bottoming cycles in ICEs to recover waste heat energies” funded by a National Project of the Spanish Government with reference TRA2013-46408-R. The authors thank also to Raul Luján and Rafael Carrascosa for their contribution in the testing process. Authors want to acknowledge the “Apoyo para la investigación y Desarrollo (PAID)” grant for doctoral studies (FPI S2 2015 1067). Author Contributions: Lucía Royo-Pascual conceived and performed the model; Vicente Dolz and José Galindo reviewed the model and analyzed the data; Regine Haller and Julien Melis contributed with analysis and experimental tools. Conflicts of Interest: The authors declare no conflict of interest.
Abbreviations BDC ICE CHP WHR NFPA HD E M ORC P-V TDC TPF ODP GWP
Bottom dead center Internal combustion engine Combined heat and power Waste heat recovery National fire protection association Heavy duty Experimental Modelled Organic Rankine cycle Pressure volume Top dead center Two phase flow Ozone depletion potential Global warming potential
Energies 2016, 9, 279
17 of 18
Nomenclature η
.
W W N . m P T ρ n Pi τ Disp Vd B Rswash X V
Efficiency Power (kW) Work (J) Expander speed (rpm) Mass flow (kg/h) Pressure (bar) Temperature (˝ C) Density (kg/m3 ) Number of cylinders State point i Torque (Nm) Displacement single cylinder (m3 ) Dead volume (m3 ) Cylinder bore (m) Radius of the swash-plate (m) Displacement covered by the piston (m) Volume covered by the piston (m)
Subscript ET W EG PP Exp C B In Out Iso Ind S Vol Mec cyl
Ethanol Water Exhaust gases Pump Expander Condenser Boiler Inlet Outlet Isentropic Indicated Shaft Volumetric Mechanical Cylinder
References 1. 2.
3.
4.
Saidur, R.; Rezaei, M.; Muzammil, W.K.; Hassan, M.H.; Paria, S.; Hasanuzzaman, M. Technologies to recover exhaust heat from internal combustion engines. Renew. Sustain. Energy Rev. 2012, 16, 5649–5659. [CrossRef] Yang, J. Potential Applications of Thermoelectric Waste Heat Recovery in the Automotive Industry. In Proceedings of the 24th International Conference on Thermoelectric 2005 ICT, Clemson, SC, USA, 19–23 June 2005; pp. 170–174. Apostol, V.; Pop, H.; Dobrovicescu, A.; Prisecaru, T.; Alexandru, A.; Prisecaru, M. Thermodynamic analysis of ORC configurations used for WHR from a turbocharged diesel engine. Procedia Eng. 2015, 100, 549–558. [CrossRef] Conklin, J.C.; Szybist, J.P. A highly efficient six-stroke internal combustion engine cycle with water injection for in-cylinder exhaust heat recovery. Energy 2010, 35, 1658–1664. [CrossRef]
Energies 2016, 9, 279
5.
6.
7. 8.
9. 10. 11. 12. 13. 14. 15. 16. 17. 18. 19.
20. 21.
22. 23. 24. 25. 26.
18 of 18
Dolz, V.; Novella, R.; García, A.; Sánchez, J. HD Diesel engine equipped with a bottoming Rankine cycle as a waste heat recovery system. Part 1: Study and analysis of the waste heat energy. Appl. Therm. Eng. 2012, 36, 269–278. [CrossRef] Serrano, J.R.; Dolz, V.; Novella, R.; García, A. HD Diesel engine equipped with a bottoming Rankine cycle as a waste heat recovery system. Part 2: Evaluation of alternative solutions. Appl. Therm. Eng. 2012, 36, 279–287. [CrossRef] Bracco, R.; Clemente, S.; Micheli, D.; Reini, M. Experimental tests and modelization of a domestic-scale ORC (Organic Rankine Cycle). Energy 2013, 58, 107–116. [CrossRef] Lecompte, S.; Huisseune, H.; Van den Broek, M.; De Schampheleire, S.; De Paepe, M. Part load based thermo-economic optimization of the Organic Rankine Cycle (ORC) applied to a combined heat and power (CHP) system. Appl. Energy 2013, 111, 871–881. [CrossRef] Manente, G.; Toffolo, A.; Lazzaretto, A.; Paci, M. An organic Rankine cycle off-design model for the search of the optimal control strategy. Energy 2013, 58, 97–106. [CrossRef] Quoilin, S.; Lemort, V.; Lebrun, J. Experimental study and modeling of an Organic Rankine Cycle using scroll expander. Appl. Energy 2010, 87, 1260–1268. [CrossRef] Wei, D.; Lu, X.; Lu, Z.; Gu, J. Dynamic modeling and simulation of an Organic Rankine Cycle (ORC) system for waste heat recovery. Appl. Therm. Eng. 2008, 28, 1216–1224. [CrossRef] Ziviani, D.; Beyene, A.; Venturini, M. Advances and challenges in ORC systems modeling for low grade thermal energy recovery. Appl. Energy 2014, 121, 79–95. [CrossRef] Mendoza, L.C.; Navarro-Esbrí, J.; Bruno, J.C.; Lemort, V.; Coronas, A. Characterization and modeling of a scroll expander with air and ammonia as working fluid. Appl. Therm. Eng. 2014, 70, 630–640. [CrossRef] Cipollone, R.; Bianchi, G.; Di Battista, D.; Contaldi, G.; Murgia, S. Mechanical energy recovery from low grade thermal energy sources. Energy Procedia 2014, 45, 121–130. [CrossRef] Ferrara, G.; Manfrida, G.; Pescioni, A. Model of a small steam engine for renewable domestic CHP (combined heat and power) system. Energy 2013, 58, 78–85. [CrossRef] Giuffrida, A. Modelling the performance of a scroll expander for small organic Rankine cycles when changing the working fluid. Appl. Therm. Eng. 2014, 70, 1040–1049. [CrossRef] Lemort, V.; Quoilin, S.; Cuevas, C.; Lebrun, J. Testing and modeling a scroll expander integrated into an Organic Rankine Cycle. Appl. Therm. Eng. 2009, 29, 3094–3102. [CrossRef] Qiu, G.; Liu, H.; Riffat, S. Expanders for micro-CHP systems with organic Rankine cycle. Appl. Therm. Eng. 2011, 31, 3301–3307. [CrossRef] Seher, D.; Lengenfelder, T.; Gerhardt, J.; Eisenmenger, N.; Hackner, M.; Krinn, I. Waste Heat Recovery for Commercial Vehicles with a Rankine Process. In Proceedings of the 21st Aachen Colloquium Automobile and Engine Technology, Aachen, Germany, 11 October 2012; pp. 7–9. Howell, T.; Gibble, J. Development of an ORC System to Improve HD Truck Fuel Efficiency. In Proceedings of Deer Conference, Deer, MA, USA, 5 October 2011; pp. 1–21. Galindo, J.; Ruiz, S.; Dolz, V.; Royo-Pascual, L.; Haller, R.; Nicolas, B.; Glavatskaya, Y. Experimental and thermodynamic analysis of a bottoming Organic Rankine Cycle (ORC) of gasoline engine using swash-plate expander. Energy Convers. Manag. 2015, 103, 519–532. [CrossRef] Macián, V.; Serrano, J.R.; Dolz, V.; Sánchez, J. Methodology to design a bottoming Rankine cycle, as a waste energy recovering system in vehicles. Study in a HDD engine. Appl. Energy 2013, 104, 758–771. [CrossRef] Shah, M.M. A general correlation for heat transfer during film condensation inside pipes. Int. J. Heat Mass Transf. 1979, 22, 547–556. [CrossRef] Steiner, D.; Taborek, J. Flow boiling heat transfer in vertical tubes correlated by an asymptotic model. Heat Transf. Eng. 1992, 13, 43–69. [CrossRef] Churchill, S.W. Friction-factor equation spans all fluid flow regimes. Chem. Eng. 1977, 84, 91–92. McAdams, W.H.; Woods, W.K.; Heroman, L.C. Vaporization inside horizontal tubes -II- Benzene-oil mixtures. Trans. ASME 1942, 64, 193–200. © 2016 by the authors; licensee MDPI, Basel, Switzerland. This article is an open access article distributed under the terms and conditions of the Creative Commons Attribution (CC-BY) license (http://creativecommons.org/licenses/by/4.0/).