the local thermal behavior, microstructure and melt zone condition. 1887 ... simulate the multi-layer powder deposition and melting/solidification process in SLM.
Solid Freeform Fabrication 2018: Proceedings of the 29th Annual International Solid Freeform Fabrication Symposium – An Additive Manufacturing Conference Reviewed Paper
MULTI-PHYSICS MODELING OF SINGLE TRACK SCANNING IN SELECTIVE LASER MELTING: POWDER COMPACTION EFFECT Bo Cheng1, Xiaobai Li2, Charles Tuffile1, Alexander Ilin3, Hannes Willeck3, Udo Hartel3 1
Robert Bosch LLC, Cambridge, MA, 02139, US Robert Bosch LLC, Sunnyvale, CA, 94085, US 3 Robert Bosch GmbH, Renningen, Stuttgart, 70465, GERMANY 2
Abstract In this work, a microscale computational fluid dynamics (CFD) model was developed for selective laser melting (SLM) process simulation using FLOW3D to study the effect of powder bed recoating methods on melt pool characteristics. The discrete element method (DEM) was used to simulate both the blade and the roller-compaction recoating processes, where layers of powder particles with different sizes were generated on a solid substrate. Melt pools propagating through the powder beds were simulated using the Volume of Fluid (VOF) method that tracks the free surface evolution of melt pools that are produced when a Gaussian distributed moving laser heat source, with given process parameters, irradiates the powder bed. Thermal and fluid material properties were incorporated in the model to improve simulation accuracy, and melt pool validation from single-track laser scanning simulation was performed. Keywords: Selective Laser Melting (SLM); Discrete Element Method (DEM); Powder Bed Packing; Melt Pool; Computational Fluid Dynamics (CFD); Volume of Fluid (VOF) 1. Introduction Powder bed fusion processes, such as Selective Laser Melting (SLM) and Electron Beam Melting (EBM), are emerging manufacturing technologies that can fabricate engineering components with nearly full density and complex structures in a layer-by-layer fashion. The process starts with the generation of a thin powder layer upon a substrate or prior solidified layers. A high-energy beam then selectively irradiates the top surface of the powder bed, locally melting the powder and surrounding material into a melt pool. The melt pool then solidifies and the process repeats. Parts fabricated with SLM frequently encounter build defects such as porosity and layer delamination that arise due to an insufficient understanding of the complicated process physics, e.g., mass and energy transport, material phase change, and microstructure evolution. A comprehensive understanding of the thermo-physical processes including powder bed generation and melting and solidification can provide critical information to correlate process conditions to final part quality. In SLM, many physical phenomena occur in a very short time and at a small scale, e.g., several milliseconds and micrometers, thus it is rather challenging to experimentally monitor the transient physical processes such as powder particle compaction, solidification and melt pool flow. The physical phenomena are interrelated such that changes in one phenomenon will affect other phenomena, e.g., different powder recoating mechanisms may result in different powder packing conditions thus affecting heat dissipation ability of the powder bed, which affects the local thermal behavior, microstructure and melt zone condition.
1887
Physics-based numerical models are well suited to investigate the influence of process characteristics such as powder layer porosity, temperature distribution, solidification, etc. Considering the heat and mass transportation phenomena in the melt pool, Computational Fluid Dynamics (CFD) methods can be used to numerically solve the mass, momentum and energy conservation equations. There are a number of CFD studies which investigated melt pool dynamics in powder bed fusion processes using the finite difference method (FDM) or finite volume methods (FVM). Yu et al [1] developed a 3D mesoscopic FVM model which considered the powder-tosolid transformation, motion of gas bubbles in melt pool and surface tension effect. The Volume of Fluid (VOF) method was used to track the shape changing of the powder particles and the free surface of the melt pool. The powder layer was modeled as an arrangement of identical spheres, and the evolution of pores and densification mechanisms were studied for AlSi10Mg material. Lee and Zhang [2] combined a powder packing model based on Discrete Element Method (DEM) and melt pool fluid flow FVM model to investigate the transient melt pool dynamics. The simulated thermal information was extracted for solidification morphology and grain size calculations. Wu et al [3] incorporated an experimental powder particle size distribution into a DEM model to simulate the powder distribution upon a solid substrate. The evaporation effect on melt zone along laser scanning track in SLM process was then simulated by FVM model. Chen et al [4] numerically studied the surface morphology under different laser energy densities, where randomly packed powders generated by DEM was used with a fluid flow model for powder melting and solidification simulation. Xia et al [5] employed the FVM software Fluent to develop a novel mesoscale model with a randomly packed powder bed for investigation of the formation and evolution of interlayer porosity in the SLM process. A novel method was used by Panwisawas et al [6] to generate a SLM powder bed, the powder location was determined by dropping spheres which followed a trajectory based on encountered obstacles. They were able to make the modeled powder bed comparable to experimental powder packing condition. Thermal fluid simulations were then performed to check the process parameter related solidified surface morphology and microstructure. A similar powder generation method was adopted by Shrestha and Chou [7] to simulate the multi-layer powder deposition and melting/solidification process in SLM. Their simulation indicated lack-of-fusion between different layers due to high scanning speed. Gürtler et al [8] incorporated a powder bed with a face-centered cubic structure into a FVM model to reproduce the fundamental physics in the SLM process using the open source software OpenFOAM. They were able to predict pores between adjacent scanning tracks due to low power input. The evolution of keyhole in the SLM process was simulated by Tan et al [9], where they modeled the collapse of the unstable keyhole and the formation of pore defects in the melt zone. Energy density related pore characteristics were revealed by their simulations. In the powder bed EBM process, Yan et al [10] [11] modeled the spreading of powders on a flat substrate or previously solidified layers using DEM, the process defects such as balling effect, irregular surface and lack-of-fusion were captured. Their results showed the interaction between current tracks/layers and previous layers, which could lead to potential inter-track/layer pores. Ge et al [12] also performed melt pool fluid flow simulations in the EBM process to investigate the formation mechanism of the balling defect and the distortion pattern in single track scanning under different process parameters. The simulated top surface morphology was in good agreement with experimental results.
1888
In addition to FVM simulations, researchers in Lawrence Livermore National Laboratory (LLNL) extensively studied the fluid and the elastic-plastic response in the SLM process [13, 14, 15, 16]. The ALE3D, an arbitrary Lagrangian-Eulerian (ALE) package developed at LLNL, was utilized to develop a multi-physics mesoscopic model to enhance the fundamental understanding of the SLM process. Systematic studies were performed to investigate a series of physical phenomenon such as melt pool dynamics, scanning track surface morphology, denudation of metal powder layers, spatter ejection from melt pool, etc. The Lattice Boltzmann Method (LBM) is another CFD method, suitable for problems with complex interfaces, which has also been used for powder bed fusion simulations. Körner et al [17] developed a 2D thermal free surface LBM model for the SLM process to investigate melting and solidification of a randomly packed powder bed subject to a 2D Gaussian beam irradiation. Process defects such as balling and discontinuous tracks were simulated and included in a process map, which was in good agreement with experiments. Ammer et al [18] proposed and described an improved 3D thermal free surface LBM method, which was well suited for handling the complex interactions between powder, liquid, and solid phases in the EBM process. With the inclusion of hydrodynamics, thermodynamics and multi-component evaporation into the LBM model, Klassen et al [19] were able to investigate the relationship between input energy, evaporation and Al element distribution in the EBM process for a TiAl alloy in multi-layer simulations. To achieve widespread applications for powder bed fusion technology, a fundamental understanding of the process physics is required, especially thermal and fluid characteristics. Given the fact that the incident beam spot size is comparable to powder particle size in the SLM process, the localized powder bed density in laser scanning domains may play a critical role for energy transfer. The objective of this study is to develop comprehensive multi-physics models for: (1) SLM powder bed recoating and compaction predictions, (2) laser melting and fluid dynamics simulations. A DEM model was developed for different powder spreading conditions with consideration of actual particle size distributions. A 3D FVM model, incorporating a Gaussian heat source, free surface tracking by VOF, surface tension, and evaporation effects, was then applied to investigate the powder packing effect on melt zones. Validation of melt pool dimensions is presented to demonstrate the prediction capability of the numerical tool. 2. Numerical Methodology 2.1 Discrete element simulation of powder bed In this study, DEM was utilized to model the creation of a single layer of powder above a solid substrate. The powder particles were assumed as perfect spheres with different radii and all substrates or walls were assumed as rigid. Newton’s second law of motion can be solved by DEM to calculate individual particle velocities in (x, y, z) directions including translational and rotational components. The particle-to-particle force determination is expressed in Figure 1 and equations (1)-(3) as follows: Particle contact force in normal direction: 𝐅𝐧 𝐢 = −𝑘𝑠 𝑑𝑙𝐧 − 𝜂𝑛 (𝐮′ ∙ 𝐧)𝐧
1889
(1)
Particle contact force in tangential direction: 𝐅𝐭 𝐢 = −𝜂𝑡 (𝐮′ − (𝐮′ ∙ 𝐧)𝐧) 𝐅𝐢 = 𝐅𝐧 𝐢 + 𝐅𝐭 𝐢 = −𝐅𝐣
(2) (3) 𝐥
𝑙0 = 𝑟𝑖 + 𝑟𝑗 ; 𝐥 = 𝐱 𝐣 − 𝐱 𝐢 ; 𝑑𝑙 = 𝑙0 − ‖𝐥‖ ; 𝐧 = ‖𝐥‖ ; 𝐮′ = 𝐮𝐣 − 𝐮𝐢 Where 𝐱 𝐢 is a coordinate vector of an individual particle center , 𝑟𝑖 is particle radius, 𝑘𝑠 is spring constant, 𝑚𝑖 is particle mass, 𝐮𝐢 is particle velocity vector, 𝜂 is drag coefficient.
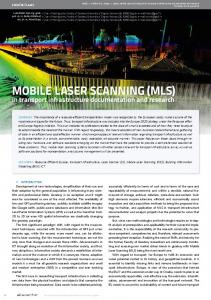
Figure 1. Particle to particle force model by DEM. 2.2 Thermal and fluid flow simulation The complicated physical processes such as melting, phase change and melt pool flow in the SLM process were numerically solved using the computational fluid dynamics (CFD) method. The melt pool is considered to be incompressible, laminar, and Newtonian fluid. The governing equations of mass, momentum and energy conservation are presented below: Mass: (4)
∇ ∙ 𝑣⃗ = 0 Momentum: ⃗⃗ ∂𝑣 ∂t
1
+ (𝑣⃗ ∙ ∇)𝑣⃗ = − 𝜌 ∇P + μ∇2 𝑣⃗ + 𝑔⃗ + 𝐹𝑏
(5)
Energy: ∂ℎ ∂t
1
+ (𝑣⃗ ∙ ∇)ℎ = − 𝜌 (∇ ∙ k∇T) + 𝑞̇
(6)
Where t is the time, 𝑣⃗ is the velocity of melted material, P is the pressure, 𝜌 is mass density, μ is kinetic viscosity, g is gravity, 𝐹𝑏 is the body force in the system, h is enthalpy, k is material thermal conductivity, T is temperature, 𝑞̇ is heat source term. The latent heat of fusion was considered in the model to simulate the solidus to liquidus phase transformation. When the material temperature is between the solidus and liquidus temperature, an additional energy term was added to the internal enthalpy. The enthalpy equation is defined as follows:
1890
(7)
ℎ = ∫ C𝑝 𝑑𝑇 + 𝐿𝑓 𝑓 Where f is the volumetric fraction of liquid determined by temperature: 0, 𝑇 < 𝑇𝑠 𝑇−𝑇𝑠
𝑓 = {𝑇
𝐿 −𝑇𝑠
(8)
, 𝑇𝑠 ≤ 𝑇 ≤ 𝑇𝐿
1, 𝑇 > 𝑇𝐿 Where C𝑝 is material specific heat, 𝐿𝑓 is latent heat of fusion, 𝑇𝑠 and 𝑇𝐿 are material solidus and liquidus temperatures, respectively. The VOF method was introduced to track the instant free surface evolution of the melt pool. In VOF the term, F, is defined as the fluid volume fraction (0 ≤ F ≤ 1). A void cell (no fluid) is defined as F=0 while a cell fully filled with fluid is defined as F=1. Thus, a cell that is partially fluid and partially void is represented as 0 < F < 1. The VOF equation is described as: ∂𝐹 + ∇ ∙ (𝑣⃗𝐹) = 0 (9) ∂t The Marangoni effect strongly affects the melt pool surface morphology and convection heat transfer. Thus, a surface tension term was included in the model to describe the main driving forces for fluid flow in the melt pool. The temperature dependent surface tension force is as follows: 𝑑γ γ(T) = γ𝑚 + 𝑑𝑇 (𝑇 − 𝑇𝑚 ) (10) Where γ is the surface tension at temperature T, γ𝑚 is the surface tension at melting 𝑑γ (liquidus) temperature 𝑇𝑚 and 𝑑𝑇 is the temperature coefficient of material surface tension. Evaporation will take place when temperature exceeds the material boiling point. Significant amount of energy will be carried away by escaped metal vapor from melt pool surface. Wu et al [3] pointed out that the implementation of evaporation effect to the numerical model can have a substantial influence on the simulated maximum temperature. Thus, the heat loss due to evaporation was defined as Lee and Zhang [2]: 0.82∆H𝑣 𝑇−𝑇 Q𝑒𝑣𝑎𝑝 = P0 exp(∆H𝑣 𝑅𝑇𝑇 𝑏) (11) √2𝜋𝑀𝑅𝑇
𝑏
Where ∆H𝑣 is the enthalpy of metal vapor, M is molar mass, P0 is the saturation pressure, R is gas constant and Tb is material boiling temperature. Additionally, the evaporation effect on the melt pool morphology can be modeled by introducing a recoil pressure term over the free surface of melting region. The recoil pressure is given as: 𝑇−𝑇 P𝑟 = 0.54P0 exp(∆H𝑣 𝑅𝑇𝑇 𝑏) (12) 𝑏
2.3 Laser heat source modeling
1891
The laser input was modeled as a moving heat flux with a Gaussian distribution on top of the powder bed: Q=
2𝐴𝑏 𝑃𝐿 𝜋𝛷𝑒
exp(−2
(𝑥−𝑥𝑠 )2 +(𝑦−𝑦𝑠 )2 𝛷𝑒 2
)
(13)
Where Q is the instant surface heat flux [20], Ab is the absorption coefficient, PL is the laser power, 𝛷𝑒 is the laser diameter, xS and yS are the horizontal positions of the laser beam center. 2.4 SLM model configuration A 3D CFD model was developed using Flow Science, Inc. commercial software FLOW3D® to study the complex thermal fluid phenomenon in SLM such as heat transfer, fluid flow and evaporation. The general model configuration is shown in Figure 2. One powder layer on top of a solid substrate (same material as powder) was used to represent the newly spread powder layer. The geometrical information of individual powder particles is provided by an STL file generated with the DEM method (described in Section 3.1). The laser beam travels along the x-axis with a given speed at the top surface of the powder particles. Due to relatively high laser energy input and small laser diameter, a fine mesh (3.5 µm) was used along the laser scanning path to produce reasonable simulation results. A coarser mesh (5 µm) was applied to the area away from the heat affected zone to reduce computational cost. The model has a domain dimension of 1.3 × 0.4 × 0.29 mm (x × y × z) and has a total number of 2.7 million cells. The upper region where no material is assigned was defined as void, its pressure was set to be one standard atmospheric pressure while the velocity was set to be zero. A continuative boundary condition was applied to all boundaries of the substrate, it can represent a smooth continuation of the flow through the boundary since zero normal derivatives was used at the boundary for all quantities. The material used in this study is H13 steel, of which the thermo-physical property information is shown in Table 1. The typical CFD computational time for one single track simulation is around 26 h using two Inter(R) Xeon(R) E5 processors and 24 GB memory.
Figure 2. 3D powder scale SLM CFD model.
1892
Table 1. Material property for H13 steel. Property Liquid Solid Conductivity (k), W × m−1 K−1 29 29 −3 6900 7760 Density (𝜌), kg × m −1 −1 480 460 Specific heat (C𝑝 ), J × kg K 5 −1 2.5 × 10 Latent heat of fusion (𝐿𝑓 ), J × kg −1 7.34 × 10⁶ Latent heat of evaporation (∆H𝑣 ), J × kg 5.0 × 10⁻³ Viscosity (μ), kg × m−1 s−1 1.7 Surface tension (γ𝑚 ), kg × s−2 𝑑γ −2 −1 –0.43 × 10⁻³ Surface tension coefficient ( ), kg × s K 𝑑𝑇
1727 1588 3133
Liquidus temperature (𝑇𝐿 ), K Solidus temperature (𝑇𝑠 ), K Boiling temperature (𝑇𝑚 ), K Laser absorptivity (Ab)
0.63
reference 3 3, 21 3 3 3 22 13 23 22 22 3 24
3. Results and Discussion 3.1 Investigation of powder bed compaction A DEM model was developed to simulate the powder layer generation on a solid substrate. To accurately capture the compaction characteristics of the powder bed, three simulation steps were performed: (1) a total of about 24000 powder particles was initiated above a rectangular container with rigid walls around. Different sized particles were generated and all the particles were randomly distributed in a cloud; (2) the particles dropped freely to the container under standard gravity; (3) a blade with given speed was used to spread one layer of the powder to the solid substrate. The geometrical information of generated power bed was then exported in STL format for further analysis. The H13 steel powder size distribution has been experimentally analyzed and the particles were found to follow Gaussian distribution with D10, D50, and D90 (indicating 10%, 50% and 90% of the cumulative mass) of 19, 29 and 43 µm in diameter, respectively [3]. The experimental particle size distribution was used as an input parameter to generate the powder cloud in the DEM model so as to match the actual condition. The blade has a translational moving speed of 10 cm/s and a width of 5 mm. The general DEM powder bed creation process has been illustrated in Figure 3. A typical DEM simulation requires about 10 h using two Inter(R) Xeon(R) E5 processors. The simulated powder bed has a solid ratio of 42.8%.
1893
Figure 3. Schematic plot of powder bed generation process. To investigate different powder bed compactions, a simulated roller with a diameter of 5 mm was used to spread the powders instead of a blade. The roller has the same translational moving speed as the blade (10 cm/s) and a rotational speed of 6.28 radians/s. It should be mentioned that no external downward force was applied to the roller or blade. Both clock-wise and counter clockwise rotations were considered in the simulations. It is noted that a clock-wise rotation pushes particles backward to an already-packed powder bed thus increasing the powder bed layer thickness, while the counter clock-wise rotation would not cause such phenomenon, as shown in Figure 4. Both cases were expected to generate only one layer of powder, however, the clock-wise rotation case resulted in a ~ 2 layer thick powder bed. The increased powder layer thickness may lead to larger melt pool size and potentially damage the recoating system due to elevated solidified scanning tracks.
Figure 4. Powder bed generation by roller. The counter clock-wise rotation roller was used to conduct a rotational speed effect study on the powder bed packing condition since it can produce the desired layer thickness. Four different rotational speeds (with the same translational speed) were used: 0, 3.14, 6.28 and 9.42
1894
radians/s. Figure 5 compares the powder bed solid ratio from different powder spreading mechanisms and parameters. It is found that the increase of rotational speed will decrease the solid ratio, as more powder was removed from the domain. In addition, it is observed that the roller can generate a powder bed of higher solid ratio than a blade if the roller does not rotate, e.g., 42.8% for blade vs. 51.7% for roller (0 radian/s).
Figure 5. Powder bed packing conditions. 3.2 Typical simulation results Single track melt pool simulation has been performed by incorporating the parameters in Table 1 and the experimental process conditions from [3]: the laser power of 200 W, laser speed of 1000 mm/s, spot size of 52 µm and the initial temperature of 298 K. The powder bed STL file from the blade spreading DEM simulation was incorporated. A 3D view of the simulated temperature field and surface morphology is shown in Figure 6 (a), where the laser beam traveled along the scanning track. A smooth scanning track is formed, where the powder is melted and solidified. Partially melted particles are observed at the scanning track edges. A noticeable melt pool depression is shown in the laser beam center area at the end of the track, which is partially due to material evaporation induced recoil pressure. In this study, the evaporation effect was activated when the cell temperature exceeded the material boiling point. It is also observed that the maximum temperature predicted was around the material evaporation point (3133 K), which indicates the loss of excessive energy due to a liquid to gas phase change and which is captured by taking latent heat of evaporation into consideration. The melt pool fluid flow is depicted in Figure 6 (b), with arrows representing flow vectors. It is clear that a strong backward flow (opposite to scanning direction) is formed in the length-depth plane. The surface tension force pushes the melt flow from the high temperature laser beam center to the cooler periphery, thus expanding melt pool area. The width-depth geometry at different locations in the scanning track is shown in Figure 6 (c). There is slight difference in the melt pool top surface morphology due to the non-symmetric powder particle distribution.
1895
(a)
(b)
(c) Figure 6. Typical single track simulation results: (1) temperature distribution, (b) 2D view of melt pool velocity, (c) transverse shape of melt pool at various locations. The time dependent melt pool evolution is shown in Figure 7 for a static width-depth plane in the melt pool. The temperature distribution as well as melt pool fluid flow have been plotted in 0.05 ms time increments. At 0 ms, the powder particles start to melt due to high laser input, and the liquid material flows both downward and outward. At 0.05 ms, the laser beam center moves toward the target plane, the substrate plate also melts and a depressed zone is formed due to a recoil pressure and the Marangoni effect. The melt pool continues to flow downward and outward. At 0.1 ms, a deeper valley-shaped melt pool is presented. At this point, the laser beam starts to move away from the target plane, thus upward flow is observed which brings the melt pool back into the neighboring void space. From 0.15 ms to 0.4 ms, the depressed zone is gradually replenished with molten material. Due to cooling and solidification of the melt pool, the flow velocity decreases with the increase of time. The maximum melt pool velocity is observed to be larger than 5 m/s at 0.1 ms. The high flow velocity indicates that there is strong melt flow recirculation. The Peclet number (Pe) is used to describe the contribution of convection and conduction; it is a ratio of heat transferred by convection to conduction, defined as the equation below [25]: 𝐻𝑒𝑎𝑡 𝑏𝑦 𝐶𝑜𝑛𝑣𝑒𝑐𝑡𝑖𝑜𝑛
𝑃𝑒 = 𝐻𝑒𝑎𝑡 𝑏𝑦 𝐶𝑜𝑛𝑑𝑢𝑐𝑡𝑖𝑜𝑛 =
1896
𝑉𝑙𝑖𝑞𝑢𝑖𝑑 𝜌 C𝑝 𝐿𝑅 𝑘
(14)
Where 𝑉𝑙𝑖𝑞𝑢𝑖𝑑 is the typical liquid velocity, LR is the characteristic length (melt pool half width). Heat transfer will be dominated by convection in the melt pool if Pe is much larger than one. For a typical simulation run using aforementioned process parameters, the Pe number is calculated to be about 31, which shows the convection is the main heat transportation mechanism in melt pool.
Figure 7. Typical example of melt pool evolution in width-depth plane, the magnitude of the fluid flow velocity vector in the melt pool is represented by color. 3.3 Numerical model validation The prediction accuracy of the numerical model has been verified by single track experiment from Wu et al. [3]. The cross-sectional (width-depth) image of the scan track was used for model validation. The dimension of the melt zone obtained from CFD simulations is comparable to the experimental measurement, as shown in Figure 8, where the red color indicates the fully solidified region. The maximum simulation error is less than 2% of both the melt pool width and depth. As such, the solidified powder layers above the substrate have been captured accurately; it is confirmed that the model can produce reasonable simulation results and be utilized for further analysis.
1897
Figure 8. Simulation and experiment comparison, experiment from [3]. 3.4 Effect of powder bed packing condition on melt zone Unlike the direct metal deposition (DMD) process which metal powder is deposited locally to form an object [26], the layer-based powder bed packing condition in SLM strongly affects the powder bed heat transfer, which governs multiple thermal-physical characteristics such as melt pool dimension and surface morphology. FEA simulation [27] has been performed to study the powder bed porosity effect on melt pool thermal characteristics. The continuum model was used for powder layer since the implementation of individual powder particle into an FEA model is quite challenging. The effective powder bed conductivity was based on theoretical powder arrangement, e.g., simple cubic (SC), body centered cubic (BCC) or face centered cubic (FCC). Thus, the calculated results may not be sufficient since it is observed that various powder bed packing densities have been realized by different recoating methods. Therefore, a set of simulations have been conducted with varied conditions of the powder spreading process: (1) powder bed (solid ratio 42.8%) generated by moving blade, (2) powder bed (solid ratio 51.7%) generated by moving roller with 0 rad/s rotational speed, (3) powder bed (solid ratio 34.9%) generated by moving roller with 9.42 rad/s rotational speed. The melt zone boundaries along the scanning paths from the three cases have been compared in Figure 9. The cross-sectional (widthdepth) figures at different locations of the scanning path are presented in Figure 10. Depressed keyhole zones are observed for all test cases, which indicates the evaporation effect took place for all tested powder bed conditions. The behavior of melt zone profile depends on the powder bed density, e.g., a smaller height of melt zone above substrate (formed by solidified powder particles) and deeper melt pool were found for case (3) when compared with case (1) and (2), as shown in Figure 9 and Figure 10. Reduced powder particle packing density results in lower solid volume available for melting thereby allowing the beam energy to be transferred to deeper location of the substrate. Compared to case (3), the average re-melting depth (melt depth of the solid substrate beneath powder bed) of case (1) and case (2) are ~8% and ~13% shorter, respectively.
1898
Figure 9. Cross-sectional (length-depth plane) comparison of melt zone profiles for different powder bed packing conditions: (a) profiles from case (1) (2) and (3); (b) profiles from case (1) and (3); (c) profiles from case (2) and (3).
(a) (b) (c) Figure 10. Cross-sectional (width-depth plane) comparison of melt zone profiles: (a) profiles from case (1) (2) and (3); (b) profiles from case (1) and (3); (c) profiles from case (2) and (3). 4. Conclusion In this study, two models have been developed to perform comprehensive simulations of the SLM process. First, a DEM model is utilized to calculate the powder particle compaction, incorporating experimental particle size distribution information for improved simulation accuracy. The obtained powder bed geometrical information is then extracted and used in the second model. The second model is a 3D thermal fluid model using the VOF method for melt pool dynamics studies. This model includes a moving Gaussian heat source, material phase transformation, surface tension force, evaporation pressure as well as thermal fluid properties. Single track scanning simulations have been performed to study the effect of powder packing conditions. The major findings can be summarized as follows: (1) Powder bed packing density is a controllable variable of the powder spreading mechanisms and parameters, e.g., blade spreading and roller spreading. In addition, the increase
1899
of roller rotation speed in a roller spreader will decrease powder bed density for a counter clockwise rotation. (2) The CFD model is able to capture the Marangoni effect, recoil pressure and evaporation heat loss. The simulated melt pool width and depth have reasonable agreement with experimental results, e.g., maximum error is ~2%. (3) The powder bed compaction condition affects the final solidified melt pool size and shape, e.g., a smaller height of melt zone above the substrate and deeper melt pool is formed by lower powder bed density. The average substrate re-melting depth of solid ratio 42.8% and 51.7% cases are ~8% and ~13% shorter than that of solid ratio 34.9% case, respectively. 5. Acknowledgement Technical simulation assistance was provided by Flow Sciences, Inc.. 6. Reference [1] Guanqun Yu, Dongdong Gu, Donghua Dai, Mujian Xia, Chenglong Ma, and Kun Chang. "Influence of processing parameters on laser penetration depth and melting/re-melting densification during selective laser melting of aluminum alloy." Applied Physics A 122, no. 10 (2016): 891. [2] Y. S. Lee, W. Zhang. "Modeling of heat transfer, fluid flow and solidification microstructure of nickel-base superalloy fabricated by laser powder bed fusion." Additive Manufacturing 12 (2016): 178-188. [3] Yu-Che Wu, Cheng-Hung San, Chih-Hsiang Chang, Huey-Jiuan Lin, Raed Marwan, Shuhei Baba, and Weng-Sing Hwang. "Numerical modeling of melt-pool behavior in selective laser melting with random powder distribution and experimental validation." Journal of Materials Processing Technology 254 (2018): 72-78. [4] Zhen Chen, Yu Xiang, Zhengying Wei, Pei Wei, Bingheng Lu, Lijuan Zhang, and Jun Du. "Thermal dynamic behavior during selective laser melting of K418 superalloy: numerical simulation and experimental verification." Applied Physics A 124, no. 4 (2018): 313. [5] Mujian Xia, Dongdong Gu, Guanqun Yu, Donghua Dai, Hongyu Chen, and Qimin Shi. "Porosity evolution and its thermodynamic mechanism of randomly packed powder-bed during selective laser melting of Inconel 718 alloy." International Journal of Machine Tools and Manufacture 116 (2017): 96-106. [6] Chinnapat Panwisawas, Chunlei Qiu, Magnus J. Anderson, Yogesh Sovani, Richard P. Turner, Moataz M. Attallah, Jeffery W. Brooks, and Hector C. Basoalto. "Mesoscale modelling of selective laser melting: Thermal fluid dynamics and microstructural evolution." Computational Materials Science 126 (2017): 479-490. [7] Subin Shrestha, Kevin Chou. "Computational Analysis of Thermo-Fluid Dynamics with Metallic Powder in SLM." In TMS Annual Meeting & Exhibition, pp. 85-95. Springer, Cham, 2018. [8] F-J. Gürtler, M. Karg, K-H. Leitz, and M. Schmidt. "Simulation of laser beam melting of steel powders using the three-dimensional volume of fluid method." Physics Procedia 41 (2013): 881886.
1900
[9] J.L. Tan, C. Tang, C.H. Wang. “A Computational Study on Porosity Evolution in Parts Produced by Selective Laser Melting.” Metall and Mat Trans A (2018), In press. [10] Wentao Yan, Ya Qian, Wenjun Ge, Stephen Lin, Wing Kam Liu, Feng Lin, and Gregory J. Wagner. "Meso-scale modeling of multiple-layer fabrication process in selective electron beam melting: inter-layer/track voids formation." Materials & Design 141 (2018): 210–219. [11] Wentao Yan, Wenjun Ge, Ya Qian, Stephen Lin, Bin Zhou, Wing Kam Liu, Feng Lin, and Gregory J. Wagner. "Multi-physics modeling of single/multiple-track defect mechanisms in electron beam selective melting." Acta Materialia 134 (2017): 324-333. [12] Wenjun Ge, Sangwoo Han, Yuchao Fang, Jason Cheon, and Suck Joo Na. "Mechanism of surface morphology in electron beam melting of Ti6Al4V based on computational flow patterns." Applied Surface Science 419 (2017): 150-158. [13] Saad A. Khairallah, Andy Anderson. "Mesoscopic simulation model of selective laser melting of stainless steel powder." Journal of Materials Processing Technology 214, no. 11 (2014): 26272636. [14] Saad A. Khairallah, Andrew T. Anderson, Alexander Rubenchik, and Wayne E. King. "Laser powder-bed fusion additive manufacturing: Physics of complex melt flow and formation mechanisms of pores, spatter, and denudation zones." Acta Materialia 108 (2016): 36-45. [15] Manyalibo J. Matthews, Gabe Guss, Saad A. Khairallah, Alexander M. Rubenchik, Philip J. Depond, and Wayne E. King. "Denudation of metal powder layers in laser powder bed fusion processes." Acta Materialia 114 (2016): 33-42. [16] Sonny Ly, Alexander M. Rubenchik, Saad A. Khairallah, Gabe Guss, and Manyalibo J. Matthews. "Metal vapor micro-jet controls material redistribution in laser powder bed fusion additive manufacturing." Scientific reports 7, no. 1 (2017): 4085. [17] Carolin Körner, Elham Attar, and Peter Heinl. "Mesoscopic simulation of selective beam melting processes." Journal of Materials Processing Technology 211, no. 6 (2011): 978-987. [18] Regina Ammer, Matthias Markl, Ulric Ljungblad, Carolin Körner, and Ulrich Rüde. "Simulating fast electron beam melting with a parallel thermal free surface lattice Boltzmann method." Computers & Mathematics with Applications 67, no. 2 (2014): 318-330. [19] Alexander Klassen, Vera E. Forster, Vera Juechter, and Carolin Körner. "Numerical simulation of multi-component evaporation during selective electron beam melting of TiAl." Journal of Materials Processing Technology 247 (2017): 280-288. [20] Bo Cheng, Subin Shrestha, and Kevin Chou. "Stress and deformation evaluations of scanning strategy effect in selective laser melting." Additive Manufacturing 12 (2016): 240-251. [21] I. R. Kabir, D. Yin, and S. Naher. "3D thermal model of laser surface glazing for H13 tool steel." AIP Conference Proceedings. Vol. 1896. No. 1. AIP Publishing, 2017. [22] N.S. Bailey, C. Katinas, and Y.C. Shin. 2017. “Laser direct deposition of AISI H13 tool steel powder with numerical modeling of solid phase transformation, hardness, and residual stresses.” Journal of Materials Processing Technology, 247, (2017): 223-233. [23] Fanrong, Kong, Radovan Kovacevic. "Modeling of heat transfer and fluid flow in the laser multilayered cladding process." Metallurgical and materials transactions B 41, no. 6 (2010): 1310-1320. [24] W. E. King, A. T. Anderson, R. M. Ferencz, N. E. Hodge, C. Kamath, S. A. Khairallah, and A. M. Rubenchik. "Laser powder bed fusion additive manufacturing of metals; physics, computational, and materials challenges." Applied Physics Reviews 2, no. 4 (2015): 041304.
1901
[25] R. Rai, S. M. Kelly, R. P. Martukanitz, and T. DebRoy. "A convective heat-transfer model for partial and full penetration keyhole mode laser welding of a structural steel." Metallurgical and Materials Transactions A 39, no. 1 (2008): 98-112. [26] Jingyuan Yan, Ilenia Battiato, and Georges Fadel. "Design of injection nozzle in direct metal deposition (DMD) manufacturing of thin-walled structures based on 3D models." The International Journal of Advanced Manufacturing Technology 91, no. 1-4 (2017): 605-616. [27] Mahdi Jamshidinia, Fanrong Kong, and Radovan Kovacevic. "Numerical modeling of heat distribution in the electron beam melting® of Ti-6Al-4V." Journal of Manufacturing Science and Engineering 135, no. 6 (2013): 061010.
1902