Robust Automated Image Registration using Python .... using Python, with C extensions for efficiency, and has undergone initial testing to successfully align.
Multiresolution Image Registration Algorithm(MIRA): Robust Automated Image Registration using Python Warren J. Hack (Space Telescope Science Institute), Nadezhda Dencheva (Space Telescope Science Institute) Popular image registration techniques A relatively few techniques have been developed and widely accepted for image registration, with each tuned to work best for a different set observations. The most common algorithms are: • Crosscorrelation: This technique works best for aligning images containing primarily indistinct objects such as nebulae, galaxies, unresolved clusters and so on. –
Disadvantages: • • •
•
Algorithm MIRA relies on a combination of techniques derived both from astronomical image analysis and from earth observation satellite image analysis as performed in the geosciences. The algorithm relies on multiresolution analysis for preparing the images for source identification, and on the featurebased registration algorithm described by Dai and Khorram (1999) for identifying the sources. Computation of the shifts for a set of images undergoes the following steps: I.
Build initial mosaic relationship for exposures using WCS header information and PyDrizzle (Hack, 2002).
II.
For each detector chip, create an instance of a Chip class. This class will take the chip’s image and:
Catalog matching: This technique was developed to provide highly accurate alignment of sources by matching crossidentified source positions between exposures. Sources positions are determined for each object using any number of techniques, PSF fitting for stars and/or isophote fitting for extended sources. –
Disadvantages: • • •
•
Does not work efficiently on images which are rotated relative to each other, can be very memory intensive Can be fooled by variability of objects from one exposure to the next
A primary problem with combining images taken at different epochs remains the difficulty in determining the offset between the images in an automated manner. Automated multiscale techniques have been adopted for use in aligning images taken with groundbased telescopes with great success. However, several characteristics of Hubble Space Telescope (HST) images made direct application of the groundbased multiscale techniques problematic. This paper describes how an algorithm developed for automated image alignment of Earth observing satellite imagery was merged with a multiscale analysis of the images to produce a new image registration task. This task was developed using Python, with C extensions for efficiency, and has undergone initial testing to successfully align HST images of the core of 47Tuc and, separately, mosaics of HST images of the Orion Nebula without any differences in the parameter settings. More work needs to be done to improve the run time and to generalize it to work on nonHST images before making it publicly available on all platforms which run Python.
Will not work for extended sources that fill the field of view Can be fooled by large offsets, rotations, cosmicrays, and variability of the sources Accuracy relies on source position determination accuracy, both in terms of image position and crossidentification of same source from one image to the next
Multiresolution matching using wavelets: Wavelets provide a means of sampling each exposure at different resolutions to identify and later match sources, as demonstrated and described initially by Vandame (2002). –
(b)
Correct for distortion and generate a distortionfree image for this chip only
2)
Generate multiresolution views using median filtering, doubling the filter size for each successively lower resolution.
3)
Starting with the lowest resolution view, use LaplacianofGaussian filter to generate contours of all sources in image. Closed contours with the strongest edges are identified using the Thin and Robust ZeroCrossing technique described by Dai and Khorram(1999). These will be the primary sources.
4)
Generate the modified Freeman chaincode for each source’s contour (Li, et al., 1995). These chain codes are invariant to scale, rotation, translations as well as being robust against noise in the contours.
5)
Compute the invariant moments and centerofgravity of the image within each source’s contour.
6)
For each successively higher resolution, extract sources, chaincodes and moments in the same way as described in Steps 35 from sources identified in the regions extracted from the lower resolution views of the image.
(d)
Disadvantages: •
1)
Cosmicrays are difficult (impossible) to detect and ignore in each exposure without considerable preprocessing and wavelets actually enhance their signature confusing the matching process
The disadvantages listed for each technique represent an obstacle which needs to be overcome by any new algorithm in order to be automatic and robust. The technique developed for use with HST images and described in this paper attempts to overcome most of these issues.
III. Combine source lists from chips associated with the same exposure into a single ‘Observation’ class.
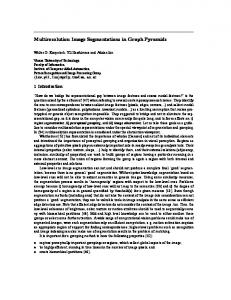
(c) (e) (a) Figure 2: HST/ACS images of a section of the Orion Nebula taken at 2 different pointings [a] and [b] combined into a single mosaic [c] after correcting for pointing offsets. The offset computed using MIRA was (∆x,∆y)=(15.18, 0.97) pixels. The effect of this offset can be seen in the RGB image [d] of a random region of the field where Pointing 1 [a] is displayed in red and Pointing 2 [b] is displayed in cyan prior to applying the offset, and in [e] after applying the offset.
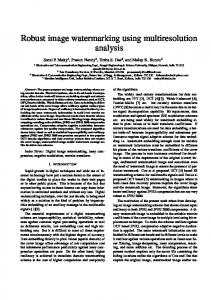
Applying MIRA to actual HST observations Initial verification of MIRA included running it on pairs of images containing vastly different types of sources; specifically, an extended source which filled the field of view and a crowded field of point sources. Images from the HST Advanced Camera for Surveys (ACS) taken of the Orion Nebula and 47Tucanae (globular cluster) were identified as initial test cases. The original WCS information in the headers of the images was used by PyDrizzle to combine each pair into a combined mosaic and an aligned pair of exposures on the same pixel grid as the combined mosaic to determine whether the images align properly. The Orion images used for this test can be seen in Figure 2 ([a] and [b]) while the 47Tuc images can be seen in Figure 3 ([a] and [b]). Errors in the WCS information in the image headers result in poor alignment in these pairs of images. An RGB image was generated for each pair using one aligned output image as the Red channel, and the other as the Green and Blue channels (creating cyan). The original alignment with the errors can be seen in Figure 2[d] for a expanded view of a portion of the Orion mosaic and Figure 3[c] for the 47Tuc mosaic. It can be seen from these images that a significant offset exists between the WCS information of these input exposures. MIRA was then used to compute the offsets between the images in each pair with no user provided parameters except the input filenames. The computed offsets were then used to combine the images again using PyDrizzle. A new set of RGB images was generated for each pair in exactly the same way as before. The same expanded view of the aligned Orion images can be seen in Figure 2[e], while Figure 3 [d] shows the alignment in the 47Tuc mosaic.
IV. Identify an exposure as the reference to use as the starting point for computing the offsets. This will usually just be the first image given by the user as input. V.
Perform image matching between the identified reference image and the next image in the list. 1)
Compute 3 matrices based on the moments, centerofgravity, and chaincodes for all the sources from the reference image and the comparison image.
2)
Search for potential matches with the matrices. For any pair of regions, there will be a threshold which defines the limit for differences between the sources in terms of the moments and contour coding.
3)
Generate a reducedpotential match set based on the resulting set of potential matches which represents the ‘distance’ between the features in each pair. Find the ‘mode’ of those distances and identify all the pairs which fall within that mode.
4)
Use the 3 best matched points to perform an initial linear fit between the images and report the results.
VI. The offsets computed by this algorithm are then fed to PyDrizzle to generate the final aligned images.
Current Status This algorithm has been tested only with a few pairs of images representing widely discrepant types of observations. It has successfully computed the offsets for these pairs with no inputs specified by the user demonstrating its potential for automatically and robustly computing offsets for astronomical images without regard for cosmicray contamination. This program has been developed using Python, with C extensions for some pixelbased operations, and can be supported on any platform which the STScI_Python package can be ported; including Linux, Solaris, Mac, Mac/Intel, and Windows.
Future Development
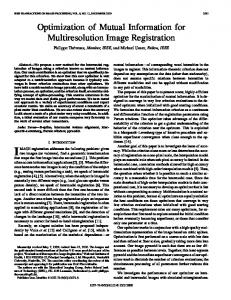
Multiresolution image analysis Each exposure contains information on many different scales, and this information can be used to constrain the crossidentification of sources from one exposure to the next. Wavelet transforms, and in particular algorithm a’ trous (Vandame, 2002), provide the most common transformation to build views of an exposure at increasingly lower resolutions. This transformation is represented in Figure 1 where the simple median filtering replaces the wavelet transform. Those sources which exhibit the greatest signal (sources with red and dark green in Figure 1) at the lowest resolution (’30 Pixel smoothing’ in Figure 1) would be identified as objects for matching. This eliminates any confusion from weaker targets, while reducing the confusion generated from crowded fields. The pixel area covered by these objects would then be examined at successively lower resolutions for the positions of any bright sources to refine the position. These positions would then be used for matching images taken at different positions or times.
This algorithm still requires a considerable amount of work to make it a fully general routine for image registration. That work would include: (a)
(c)
Testing on a larger set of image types to verify the robust nature of the algorithm Verify that it can work on large mosaics of data, instead of just pairs of images, and characterize the amount of image overlap which is required for a good fit Iterate on the initial solution to identify a larger set of sources for generating a more accurate final fit Improve the operational speed of the algorithm. Current testing indicates it takes about 2 minutes to process each ACS/WFC with an undistorted size of about 4200x4200 pixels. •A new median algorithm, one that can be up to 9 times faster than traditional median filters, has been developed. This new median filter will be implemented within MIRA soon to provide initial significant improvements.
Support nonHST images. This will require making PyDrizzle support nonHST images while requiring some adherence to FITS WCS keyword standards. (b)
(a)
Figure 3: HST/ACS observations of the core of 47 Tucanae (globular cluster) taken at 2 different times of the year ([a] and [b]). The combined image based on the WCS information in the headers can be seen in [c]. The offset computed by MIRA was (∆x,∆y)=(81.37, 31.34) pixels, where the average separation between stars is approximately 50 pixels. The combined image using the offset computed by MIRA [d] shows how well the images can be aligned using the MIRA offsets.
References Dai, X., & Khorram, S., 1999, IEEE Trans. On GeoScience And Remote Sensing, 37, 2351. Hack, W.J., 2002, in ADASS XI, ASP Conf. Series, 281, 197. Li, H., Manjunath, B.S., Mitra, S.K, 1995, IEEE Trans. On Image Processing, 4, 320. Vandame, B., 2002, in Astronomical Data Analysis II, Proc. SPIE, 4847, 123.