Sep 2, 2011 - ticle filter (MCMC-PF), and the direction of arrival infor- mation of the sources to the microphone array is estimated. A robust least squares ...
19th European Signal Processing Conference (EUSIPCO 2011)
Barcelona, Spain, August 29 - September 2, 2011
MULTIMODAL BLIND SOURCE SEPARATION WITH A CIRCULAR MICROPHONE ARRAY AND ROBUST BEAMFORMING Syed Mohsen Naqvi1 , Muhammad Salman Khan1 , Qingju Liu2 , Wenwu Wang2 , Jonathon A. Chambers1 1 Advanced
Signal Processing Group, Department of Electronic and Electrical Engineering Loughborough University, Loughborough, UK. 2 Centre for Vision, Speech and Signal Processing, Department of Electronic Engineering University of Surrey, Guildford, UK. Email: {s.m.r.naqvi, m.s.khan2, j.a.chambers}@lboro.ac.uk, {q.liu, w.wang}@surrey.ac.uk.
ABSTRACT A novel multimodal (audio-visual) approach to the problem of blind source separation (BSS) is evaluated in room environments. The main challenges of BSS in realistic environments are: 1) sources are moving in complex motions and 2) the room impulse responses are long. For moving sources the unmixing filters to separate the audio signals are difficult to calculate from only statistical information available from a limited number of audio samples. For physically stationary sources measured in rooms with long impulse responses, the performance of audio only BSS methods is limited. Therefore, visual modality is utilized to facilitate the separation. The movement of the sources is detected with a 3-D tracker based on a Markov Chain Monte Carlo particle filter (MCMC-PF), and the direction of arrival information of the sources to the microphone array is estimated. A robust least squares frequency invariant data independent (RLSFIDI) beamformer is implemented to perform real time speech enhancement. The uncertainties in source localization and direction of arrival information are also controlled by using a convex optimization approach in the beamformer design. A 16 element circular array configuration is used. Simulation studies based on objective and subjective measures confirm the advantage of beamforming based processing over conventional BSS methods. 1. INTRODUCTION The cocktail party problem was introduced by Professor Colin Cherry, who first asked the question: ”How do we [humans] recognise what one person is saying when others are speaking at the same time?” in 1953 [1]. This was the genesis of the so-called machine cocktail party problem, i.e. mimicing the ability of a human to separate sound sources within a machine. Despite being studied extensively, it remains a scientific challenge as well as an active research area. A main stream of effort made in the past decade in the signal processing community was to address the problem under the framework of convolutive blind source separation (CBSS) where the sound recordings are modeled as linear convolutive mixtures of the unknown speech sources [2–4]. Most of the CBSS algorithms are unimodal, i.e. operating only in the audio domain. However, as is widely accepted, both speech production and perception are inherently multimodal processes which involve information from multiple modalities. As also suggested by Colin Cherry [1], combining the multimodal information from different sensory measurements would be the best way to address the machine cocktail
© EURASIP, 2011 - ISSN 2076-1465
party problem and limited number of papers are presented in this direction [4, 5]. The state-of-the-art algorithms in CBSS commonly suffer in the following two practical situations, namely, for the highly reverberant environment, and when multiple moving sources are present. In both cases, most existing methods are unable to operate due to the data length limitations, i.e. the number of samples available at each frequency bin is not sufficient for the algorithms to converge [6]. Therefore, new BSS methods for moving sources are very important to solve the cocktail party problem in practice. Only a few papers have been presented in this area [4, 7]. In [4] the 3-D visual tracker was implemented and a simple beamforming method was used to enhance the signal from one source direction and to reduce the energy received from another source direction. In [7] a robust least squares frequency invariant data independent (RLSFIDI) beamformer in linear array configuration for two moving sources was implemented to perform real time speech enhancement. The beamforming approach only depends on the direction of speaker, thus an online real time source separation was obtained. In this paper, the RLSFIDI beamformer is extended to circular array configuration for multiple speakers and realistic 3-D scenarios for physically moving sources. The velocity information of each speaker and DOA information to the microphone array is obtained from a 3-D visual tracker based on the MCMC-PF from our work in [4]. In the RLSFIDI beamformer we exploit sixteen microphones to provide greater degrees of freedom to achieve more effective interference removal. To control the uncertainties in source localization and direction of arrival information, constraints to obtain wider main lobe for the source of interest (SOI) and to better block the interference are exploited in the beamformer design. The white noise gain (WNG) constraint is also imposed which controls robustness against the errors due to mismatch between sensor characteristics [8]. The beamforming approach can only reduce the signal from a certain direction and the reverberance of the interference still exists, which also limits the BSS approach. The RLSFIDI beamformer provides good separation for moving sources in a low reverberation environment when the statistical signal processing based methods do not converge due to the limited number of samples. The RLSFIDI beamformer is also found to provide better separation than state-of-the-art CBSS methods for physically stationary sources within room environments with longer impulse responses. The paper is organized as follows: A brief description of the system model is shown in Figure 1. Section-II provides
1050
Video Localization Camera Array
Video Tracking Mixed Audio Sources
Circular Microphone Array
Direction of Arrival and Velocity Information
3-D VisualTracking
Robust Least Squares Frequency Invariant Data Independent Beamforming
Post Processing (if required)
Convolutive Blind Source Separation Method
Separated Sources
Y
Moving Sources
N
Decision Making
Audio Sources Separation
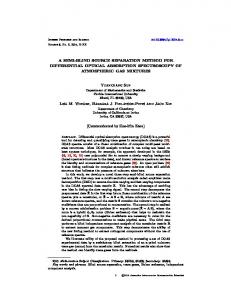
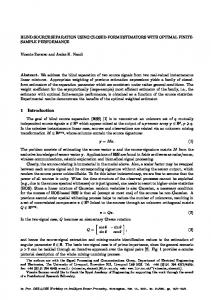
Fig. 1. System block diagram: Video localization is based on the combination of face and head detection. The 3-D location of each speaker is approximated after processing the 2-D image information obtained from at least two synchronized colour video cameras through calibration parameters and an optimization method. The approximated 3-D locations are fed to the visual-tracker based on a Markov Chain Monte Carlo particle filter (MCMC-PF) to estimate the 3-D real world positions. The position of the microphone array and the output of the visual tracker are used to calculate the direction of arrival and velocity information of each speaker. Based on the velocity information of the speakers the audio mixtures obtained from the circular microphone array configuration are separated either by a robust least squares frequency invariant data independent (RLSFIDI) beamformer or by a convolutive blind source separation algorithm. the problem statement. Section-III presents frequency invariant data independent beamformer design for a circular array configuration in a 3-D room environment. Experimental results are discussed in Section-IV. Finally, in Section-V we conclude the paper. 2. CONVOLUTIVE BLIND SOURCE SEPARATION (CBSS) The N convolutive audio mixtures of M sources are given by M P−1
xi (t) =
∑ ∑ hi j (p)s j (t − p)
i = 1, ..., N
(1)
where W(ω ) is MxN separation matrix. The audio mixtures from circular array configuration are separated with the help of visual information from the 3-D tracker which provides the DOA and velocity information of each speaker. The 3-D visual tracker is based on the MCMCPF and details of state model, measurement model, and sampling mechanism are provided in [4]. The DOA information of each speaker is fed to the beamformer. Based on the velocity information, if the speakers are moving the speech signals are separated by the RLSFIDI beamformer, otherwise, by the convolutive blind source separation algorithm. The details of the beamformer are in the following section.
j=1 p=0
where s j is the source signal from a source j, xi is the received signal by microphone i, and hi j (p), p = 0, . . . , P − 1, is the p-tap coefficient of the impulse response from source j to microphone i. In time domain CBSS, the sources are estimated using a set of unmixing filters such that N Q−1
y j (t) = ∑
∑ w ji (q)xi (t − q)
j = 1, ..., M
(2)
3. ROBUST FREQUENCY INVARIANT DATA INDEPENDENT BEAMFORMING - CIRCULAR ARRAY CONFIGURATION The least squares approach is the suitable choice for data independent beamformer design [9], by assuming the over determined case i.e. N > M which provides greater degrees of freedom and hence we obtain the over-determined least squares problem as:
i=1 q=0
where w ji (q), q = 0, . . . , Q − 1, is the q-tap weight from microphone i to source j. Using a T -point windowed discrete Fourier transformation (DFT), the time domain signals xi (t), where t is a time index, can be converted into the frequency domain signals xi (ω ), where ω is a normalized frequency index. The N observed mixed signals can be described in the frequency domain as: x(ω ) = H(ω )s(ω )
(3)
where x(ω ) is an Nx1 observation column vector for frequency bin ω , H(ω ) is NxM mixing matrix, s(ω ) is Mx1 speech sources vector, and the source separation can be described as (4) y(ω ) = W(ω )x(ω )
min ||HT (ω )w(ω ) − rd (ω )||22
w(ω )
(5)
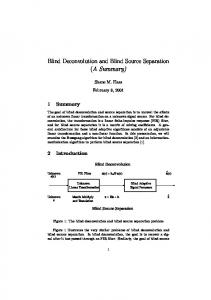
where w(ω ) is an Nx1 separation vector and rd (ω ) is an Mx1 desired response vector and can be designed from a 1D window e.g. the Dolph-Chebyshev or Kaiser windows. A frequency invariant beamformer design can be obtained by choosing the same coefficients for all frequency bins i.e. rd (ω ) = rd [10]. The mixing filter is formulated as H(ω ) = [d(ω , θ1 , φ1 ), ..., d(ω , θM , φM )], and is based on the visual information i.e. DOA from 3-D visual tracker. An N-sensor circular array with radius of R and a target speech having DOA information (θ ,φ ), where θ and φ are elevation and azimuth angles respectively, is shown in Figure 2. The sensors are equally spaced around the circumference, and their 3-D positions, which are calculated from the array configuration, are provided in the matrix form as:
1051
ux1 U = ... uxN
uy1 .. . uyN
uz1 .. . uzN
(6)
The beamformer response d(ω , θi , φi ) for frequency bin ω and for source of interest (SOI) i = 1, ..., M, can be derived [11] as:
d(ω , θi , φi ) =
exp(− jk(sin(θi ).cos(φi ).ux1 + sin(θi ). sin(φi ).uy1 + cos(θi ).uz1 )) .. . exp(− jk(sin(θi ).cos(φi ).uxN + sin(θi ). sin(φi ).uyN + cos(θi ).uzN ))
where k = ω /c and c is the speed of sound in air at room temperature. z
|wT (ω )d(ω , θ0 + ∆θ , φi + ∆φ )|2 wH (ω )w(ω )
(8)
where γ is the bound for WNG. To control the uncertainties in source localization and direction of arrival information the angular range is divided into discrete values which in response provide the wider main lobe for the SOI and wider attenuation beam pattern to block the interferences. The constraints in (7) for each discrete pair of elevation and azimuth angles, the respective constraint for WNG in (8), and the cost function in (5) are convex [8], therefore the convex optimization is used to calculate the weight vector w(ω ) for each frequency bin ω . Finally, after optimizing w(ω )Nx1 vector for M sources we formulate W(ω )MxN matrix and placed in (4) to estimate the sources. Since the scaling is not a major issue [2] and there is no permutation problem, the estimated sources are aligned for reconstruction in the time domain.
Speaker
4. EXPERIMENTS AND RESULTS
θ
y
ф
x
Fig. 2. Circular array configuration. The least squares problem in (5) is optimized subject to the constraints [8] of the form wT (ω )d(ω , θi + ∆θ , φi + ∆φ ) = 1 wT (ω )d(ω , θ0 + ∆θ , φ0 + ∆φ )
≥ γ
< ε
(7)
where θi , φi and θ0 , φ0 are respectively, the angles of arrival of SOI and interference, α1 ≤ ∆θ ≤ α2 and β1 ≤ ∆φ ≤ β2 , where α1 , β1 and α2 , β2 are lower and upper limits respectively, and ε is the bound for interference and assigned a positive value. The white noise gain (WNG) is a measure of the robustness of a beamformer and a robust superdirectional beamformer can be designed by constraining the WNG. Superdirective beamformers are extremely sensitive to small errors in the sensor array characteristics and to spatially white noise. The errors due to array characteristics are nearly uncorrelated from sensor to sensor and affect the beamformer in a manner similar to spatially white noise. The WNG is also controlled in this paper by adding the following quadratic constraint [8]
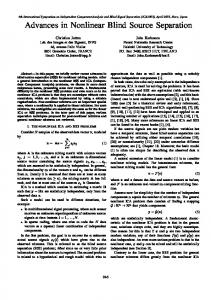
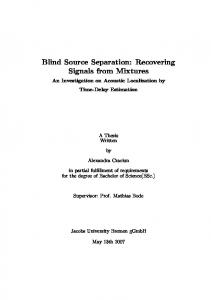
Data Collection: The simulations are performed on audiovisual signals generated from a room geometry as illustrated in Fig. 3. Data was collected in a 4.6 x 3.5 x 2.5 m3 smart office. Four calibrated colour video cameras (C1, C2, C3 and C4) were utilized to collect the video data. Video cameras were fully synchronized with an external hardware trigger module and frames were captured at 25Hz with an image size of 640x480 pixels. For BSS evaluation, audio recordings of three speakers M = 3 were recorded at 8KHz with circular array configuration of sixteen microphones N = 16 equally spaced around the circumference. Radius of circular array R = 0.2m. The other important variables were selected as: DFT length T = 1024 & 2048 and filter lengths were Q = 512 & 1024, ε = 0.1, γ = −10dB, for SOI α1 = +5degree and α2 = −5degree, for interferences α1 = +7degree and α2 = −7degree, speed of sound c = 343m/s, and the room impulse duration RT 60 = 130ms. Speaker 2 was physically stationary and Speakers 1 & 3 were moving. The same room dimensions, microphone locations and configuration, and selected speakers locations were used in the image method [12] to generate the audio data for RT 60 = 300, 450, 600ms. The reverberation time was controlled by varying the absorption coefficient of the walls. C3 Video Camera
C4 Speaker 2
r1 ke g ea vin p S Mo
Sp Moeake vin r 3 g
m .53 Circular Microphone Array C2 Room Layout
Room = [ 4.6, 3.5, 2.5 ] 4.6 m
C1
Fig. 3. Room layout and audio-visual recording configuration.
1052
Evaluation Criteria: The objective evaluation e.g. performance index (PI) and signal-to-interference ratio (SIR) [4] are limited by the requirement of the knowledge of the mixing filter. Therefore for such testing the audio signals are convolved with real room impulse responses recorded in certain positions of the room. The separation of the speech signals is evaluated subjectively by listening tests and mean opinion scores (MOS tests for voice are specified by ITU-T recommendation P.800) are also provided. It is highlighted that the mixing filter H(ω ) = [d(ω , θ1 , φi ), ..., d(ω , θM , φM )] for least squares solution in (5) depends only on DOA and room impulse responses are only required for objective evaluation. In the first simulation, the recorded mixtures of length = 0.5s (near to the moving sources case) were separated by the original IVA method [13] and RLSFIDI beamformer. The elevation angles from the 3-D tracker for speakers 1, 2 and 3 were -70, 65 and 71 degrees respectively. The azimuth angles for speakers 1, 2 and 3 were -45, 90, 46 respectively. The DOA is passed to the RLSFIDI beamformer and the resulting performance indices are shown in Fig.4(top), which indicate good performance, i.e., close to zero across the majority of the frequencies. The SIR-Input = -3.3dB and SIR-Improvement = 14.3dB. This separation was also evaluated subjectively and MOS = 4.2 (five people participated in the listening tests). The performance of the original IVA method is shown in Fig.4(bottom), it is clear from the results that the performance is poor because the CBSS algorithm can not converge due to limited number of samples f loor(0.5Fs/T ) = 3 in each frequency bin.
Performance Index
2.5 2 1.5 1 0.5 0
0
500
1000
1500 2000 2500 Frequency (Hz)
3000
3500
4000
0
500
1000
1500 2000 2500 Frequency (Hz)
3000
3500
4000
Performance Index
2.5 2 1.5 1 0.5 0
Fig. 4. Performance index at each frequency bin for the RLSFIDI beamformer at the top and the original IVA method [13] at the bottom, length of the signals is 0.5 s. A lower PI refers to a superior method. In the second simulation, the generated mixtures of length = 4s for RT60 = 300, 450, 600ms were separated by the RLSFIDI beamformer, original IVA method [13], and Para et al. algorithm [14]. The respective signal to interference improvement (SIR-Improvement) for each RT60 is shown in Table 1, which verifies the statement in [15] that at long impulse responses the separation performance of CBSS algorithms (based on second order and higher order statistics) is highly limited. For the condition T > P, we also increased the DFT length T = 2048 and there was no significant improvement observed because the number of samples in each frequency bin were reduced to f loor(4Fs/T ) = 15. The lis-
tening tests were also performed for each case and MOSs are presented in Table 2, which indicate that the performance of the RLSFIDI beamformer is better than the CBSS algorithms. Table 1. Objective evaluation: SIR improvement (dB) for the RLSFIDI beamformer, the original IVA method [13], and the Para et al. [14] algorithm, for different reverberation times, and when speakers are physically stationary. RT60 (ms) RLSFIDI beamformer IVA Parra 300 10.5 12.2 5.6 450 7.9 6.9 5.0 600 6.4 5.8 4.3
Table 2. Subjective evaluation: MOS for the RLSFIDI beamformer, the original IVA method [13], and the Para et al. [14] algorithm, for different reverberation times, and when speakers are physically stationary. RT60 (ms) RLSFIDI beamformer IVA Parra 300 3.9 3.2 2.9 450 3.6 3.0 2.6 600 3.3 2.8 2.3 The justification of better MOS for RLSFIDI beamformer than original IVA method, specially, at RT60 = 300ms (Tables 1&2) when SIR improvement of IVA method is higher than RLSFIDI beamformer, is shown in Figs. 5&6. Actually, the CBSS method removed the interferences more effectively, therefore, the SIR improvement is slightly higher. However, the separated speech signals are not good in listening, because the reverberations are not well suppressed. According to the “law of the first wave front” [16], the precedence effect describes an auditory mechanism which is able to give greater perceptual weighting to the first wave front of the sound (the direct path) compared to later wave fronts arriving as reflections from surrounding surfaces. On the other hand beamforming accepts the direct path and also suppresses the later reflections therefore the MOS is better. This result indicates that in high reverberant environments a very good separation can be achieved by post processing the output of the RLSFIDI beamformer. 5. CONCLUSIONS A novel multimodal (audio-visual) approach is evaluated when multiple sources are moving and the environment is highly reverberant. Visual modality is utilized to facilitate the source separation. The movement of the sources is detected with the 3-D tracker based on a Markov Chain Monte Carlo particle filter (MCMC-PF), and the direction of arrival information of the sources to the microphone array is estimated. A robust least squares frequency invariant data independent (RLSFIDI) beamformer is implemented with circular array configuration. The uncertainties in the source localization and direction of arrival information are also controlled by using convex optimization in the beamformer design. The proposed approach is a better solution to the separation of speech signals from multiple moving sources. It also provides better separation than the conventional CBSS methods when the environment is highly reverberant. This
1053
G11
G12 0.1
0.1
0.05
0.05
0.05
0
0
0
−0.05
−0.05
−0.05
0
2000
4000
0
G21 Amplitude
G13
0.1
5000 G22
0.1
0.1
0.05
0.05
0.05
0
0
0
−0.05
−0.05
−0.05
5000
0
G31
5000
0
G32 0.1
0.1
0.05
0.05
0.05
0
0
0
−0.05
−0.05
−0.05
5000
0 5000 Frequency (Hz)
5000 G33
0.1
0
5000 G23
0.1
0
0
0
5000
Fig. 5. Combined impulse response G = W H by the original IVA method. The reverberation time RT60 = 300ms and SIR improvement was 12.2dB. G11
G12 0.1
0.1
0.05
0.05
0.05
0
0
0
−0.05
−0.05
−0.05
0
2000
4000
0
G21 Amplitude
G13
0.1
5000 G22
0.1
0.1
0.05
0.05
0.05
0
0
0
−0.05
−0.05
−0.05
5000 G31
0
5000
0.1
0.05
0.05
0.05
0
0
0
−0.05
−0.05
−0.05
0 5000 Frequency (Hz)
5000 G33
0.1
5000
0
G32
0.1
0
5000 G23
0.1
0
0
0
5000
Fig. 6. Combined impulse response G = W H by the RLSFIDI beamformer. The reverberation time RT60 = 300ms and SIR improvement was 10.5dB. can be further enhanced by applying post processing to the output of the beamformer. Acknowledgement Work supported by the Engineering and Physical Sciences Research Council (EPSRC) of the UK (Grant number EP/H049665/1). REFERENCES [1] C. Cherry, “Some experiments on the recognition of speech, with one and with two ears,” The Journal Of The Acoustical Society Of America, vol. 25, no. 5, pp. 975–979, September 1953.
[2] A. Cichocki and S. Amari, Adaptive Blind Signal and Image Processing: Learning Algorithms and Applications, John Wiley, 2002. [3] W. Wang, S. Sanei, and J.A. Chambers, “Penalty function based joint diagonalization approach for convolutive blind separation of nonstationary sources,” IEEE Trans. Signal Processing, vol. 53, no. 5, pp. 1654– 1669, 2005. [4] S. M. Naqvi, M. Yu, and J. A. Chambers, “A multimodal approach to blind source separation of moving sources,” IEEE Journal of Selected Topics in Signal Processing, vol. 4, no. 5, pp. 895–910, 2010. [5] B. Rivet, L. Girin, and C. Jutten, “Mixing audiovisual speech processing and blind source separation for the extraction of speech signals from convolutive mixtures,” IEEE Trans. on Audio, Speech and Language processing, vol. 15, no. 1, pp. 96–108, 2007. [6] S. Haykin and Ed., New Directions in Statiatical Signal Processing: From Systems to Brain, The MIT Press, Cambridge, Massachusetts London, 2007. [7] S. M. Naqvi, M. Yu, and J. A. Chambers, “A multimodal approach to blind source separation for moving sources based on robust beamforming,” accepted for IEEE ICASSP, Prague, Czech Republic, May 22-27, 2011. [8] E. Mabande, A. Schad, and W. Kellermann, “Design of robust superdirective beamformers as a convex optimization problem,” Proc. IEEE ICASSP, Taipei, Taiwan, 2009. [9] B. Van Veen and K. Buckley, “Beamforming: A Versatile Approach to Spatial Filtering,” IEEE ASSP Magazine, vol. 5, no. 2, pp. 4–24, April 1988. [10] L. C. Parra, “Steerable frequency-invarient beamforming for arbitrary arrays,” Journal of the Acoustical Society of America, pp. 3839–3847, 2006. [11] H. L. Van Trees, Detection, Estimation, and Modulation Theory, Part IV, Optimum Array Processing, John Wiley and Sons, Inc., 2002. [12] J. A. Allen and D. A. Berkley, “Image method for efficently simulating small-room acoustics,” Journal of the Acoustical Society of America, vol. 65, no. 4, pp. 943–950, 1979. [13] T. Kim, H. Attias, S. Lee, and T. Lee, “Blind source separation exploiting higher-order frequency dependencies,” IEEE Transactions on Audio, Speech and Language processing, vol. 15, pp. 70–79, 2007. [14] L. Parra and C. Spence, “Convolutive blind separation of non-stationary sources,” IEEE Trans. On Speech and Audio Processing, vol. 8, no. 3, pp. 320–327, 2000. [15] S. Araki, R. Mukai, S. Makino, T. Nishikawa, and H. Sawada, “The fundamental limitation of frequency domain blind source separtion for convolutive mixtures of speech,” IEEE Trans. Speech and Audio Processing, vol. 11, no. 2, pp. 109–116, March 2003. [16] R. Y. Litovsky, H. S. Colburn, W. A. Yost, and S. J. Guzman, “The precedence effect,” Journal of the Acoustical Society of America, vol. 106, pp. 1633– 1654, 1999.
1054