Nov 25, 1999 - classification system consists of a neural attractor network that .... Hertz J, Krogh A, Palmer RG: Introduction to the theory of neural computation.
Neural attractor network classification of visual field data
283
NEURAL ATTRACTOR NETWORK CLASSIFICATION OF VISUAL FIELD DATA WOLFGANG FINK1, ULRICH SCHIEFER2 and ERICH W. SCHMID3 Lab, California Institute of Technology, Pasadena, CA, USA; 2University Eye Hospital, Department II and 3Institute for Theoretical Physics, Tübingen, Germany
1Kellogg
Abstract Since many neuro-ophthalmological diseases and lesions, even subtle ones, may be recognized from perimetric examinations, the appropriate classification of visual field data is essential for diagnosis. However, adequate classification and interpretation of perimetric examination results is not a trivial task and requires well-trained personnel with long-term experience. Therefore, a computer-based clas-sification system for visual field data is introduced that may act as a ‘counsellor’ to the diagnosing physician. The classification system consists of a neural attractor network that obtains its input data from perimetric examination results. Due to an iterated relaxation process, which determines the states of the neurons dynamically, even ‘noisy’ perimetric output, e.g., early stages of a disease, may be classified correctly according to the predefined attractors (diseases) of the network.
Introduction Since many neuro-ophthalmological diseases and lesions, even subtle ones, may be recognized from perimetric examinations, the appropriate classification of visual field data is essential for diagnosis. However, adequate classification and interpretation of perimetric examination results is a non-trivial task and requires well-trained personnel with long-term experience. There has been recent interest in computer-based classification systems for visual field data using different approaches, e.g., feed-forward networks and Kohonen maps1-11. In the work presented here, we propose an alternative kind of neural network12,13, namely a Hopfield net14-16, for application in visual field data classification. It may be considered a ‘counsellor’ to, rather than a substitute for the diagnosing physician, providing an additional opinion in judging perimetric examination results.
Address for correspondence: Wolfgang Fink, PhD, WK Kellogg Radiation Laboratory, California Institute of Technology, Mail Code 106-38, Pasadena, CA 91125, USA
Perimetry Update 1998/1999, pp. 283–288 Proceedings of the XIIIth International Perimetric Society Meeting, Gardone Riviera (BS), Italy, September 6–9, 1998 edited by M. Wall and J.M. Wild © 1999 Kugler Publications, The Hague, The Netherlands
back 06.p65
283
11/25/99, 12:07 PM
284
W. Fink et al.
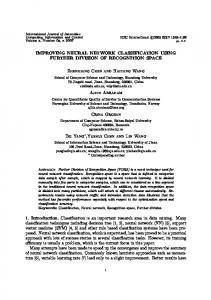
Fig. 1a. Hopfield attractor network with N=6 neurons.
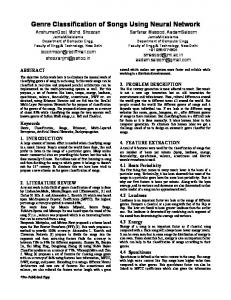
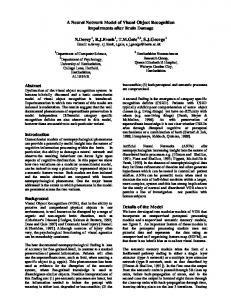
Methods The classification system is based on a neural attractor network (Fig. 1a) consisting of N binary neurons. These neurons are assigned to the N stimulus locations of the stimulus grid used to examine the visual field. Therefore, the neurons obtain their input data from perimetric examination results. We define ‘+1’ as a scotoma and ‘-1’ as no scotoma at a particular test location within the visual field under examination. The N neurons are fully connected with each other via synaptic couplings Jij. The synaptic coupling strengths can be calculated directly out of the patterns to be stored as attractors of the network by means of, e.g., the Hebb rule or the Projection rule15,16. In general, these attractors may be numbers or image pixels. In the particular case of visual field data classification, the attractors are predefined idealized scotomata patterns (see e.g. Ref. 17) that are typical for specific diseases, e.g., hemianopic field defects, sectoral defects, central, paracentral and centrocecal scotomata, nerve fiber bundle defects, etc. The following iterated relaxation process Si(t+1) = sgn(Σi Jij Sj(t)), with sgn() = sign function determines the states Si(t) of the neurons dynamically. Therefore, even ‘noisy’ perimetric output (Fig. 1b), e.g., early stages of a disease, may be classified correctly (Fig. 1c) according to the predefined attractors of the network. ‘Noisy’ perimetric output means a scotomata pattern that differs from any attractor (idealized scotomata pattern) stored in the network. A fix-point or attractor of the network dynamic is reached if the following condition is fulfilled for each neuron i of the network simultaneously: Si(t+1) = Si(t).
06.p65
284
11/25/99, 12:07 PM
Neural attractor network classification of visual field data
285
Fig. 1b. Initial neural network configuration: visual field data derived from perimetric examination.
Fig. 1c. Final neural network configuration: fix-point of the network dynamic after relaxation process.
06.p65
285
11/25/99, 12:07 PM
286
W. Fink et al.
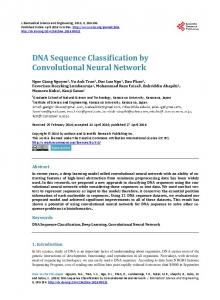
In the classification system presented here, we use two classification criteria 15,16: 1. Overlap parameter qµ defined as qµ := Σi σi σµi 2. Hamming distance Hµ defined as Hµ := Σi (σi - σµi)5 with σ being the scotomata pattern derived from the perimetric examination and with σµ being the µth idealized attractor (both normalized to unity). For better comparison, we calculate the overlap parameter and the Hamming distance for all predefined network attractors both, before and after the relaxation process described above. Table 1 shows a classification example of the visual field data depicted in Figures 1b and c. From the definition of the overlap parameter and the Hamming distance, it follows that the attractor with the largest overlap (closest to 1 or 100%) and the smallest Hamming distance (closest to 0) classifies the scotomata pattern under examination best (in this case a hemianopic visual field defect, DC=22). There is a theoretical limit (αc) in the storage capacity α:= (number of classifiable attractors per total number of neurons) of a Hopfield attractor net for independent and randomly chosen attractors15,16: αc ≈ 0.138. However, in case the storage capacity of one neural attractor network is not sufficient for the classification task, each disease may be assigned with its own neural network, e.g., a classification system that is specialized only in scotomata patterns caused by glaucoma.
Table 1. Classification result sorted in descending order of probability: disease code (DC), overlap parameter and Hamming distance, before and after the relaxation process, respectively Overlap
06.p65
Hamming
DC
before
after
before
after
22 0 20 11 2 14 12 21 19 1 17 8 7 5 3 13 4 18 6 9 15 16 10
92.34% 61.36% 61.90% 55.56% 49.95% 43.03% 40.00% 36.72% 43.03% 39.28% 38.49% 35.36% 23.57% 28.81% 21.61% 22.22% 10.48% 15.71% 8.89% 7.51% 11.11% 11.11% 8.89%
96.83% 68.51% 68.49% 59.39% 55.44% 45.69% 45.56% 45.20% 45.17% 44.59% 39.93% 37.04% 32.00% 31.64% 29.84% 24.41% 21.57% 17.26% 15.05% 12.72% 12.20% 12.20% 9.76%
0.15 0.77 0.76 0.89 1.00 1.14 1.20 1.27 1.14 1.21 1.23 1.29 1.53 1.42 1.57 1.56 1.79 1.69 1.82 1.85 1.78 1.78 1.82
0.06 0.63 0.63 0.81 0.89 1.09 1.09 1.10 1.10 1.11 1.20 1.26 1.36 1.37 1.40 1.51 1.57 1.65 1.70 1.75 1.76 1.76 1.80
286
11/25/99, 12:07 PM
Neural attractor network classification of visual field data
287
Results Preliminary test results of the classification system on real visual field data derived from perimetric examinations have come up with a classification success of over 80%. This success rate may be significantly improved in future versions of the classification system (see Discussion and Outlook).
Discussion and Outlook Advantages of the classification system presented here are that the classification of visual field data is computationally fast, and no neural learning process (e.g., back propagation18,19) is required to determine the synaptic coupling strengths. Furthermore, the assignment of a confidence level to the diagnosis by means of the overlap parameter and the Hamming distance makes the system a real ‘counsellor’ rather than just a ‘yes/no’ machine. Finally, the classification system may be readily applied to arbitrary stimulus grids for static perimetry (e.g., 30° or 90° visual fields), since only the idealized scotomata patterns (network attractors) have to be adjusted accordingly. In our study, we used the Tübingen Automated Perimeter stimulus grid for a 30° visual field. Its 191 test locations allow for a high spatial resolution of position, shape and extent of scotomata (compared to only 60–70 test locations of conventional automated threshold perimetry). Future developments of the attractor network classification system should take into account relative scotomata as well as binocular visual field data for the diagnosis of binocular scotomata. Furthermore, more research is needed on the detailed specification of the network attractor sets (idealized scotomata patterns) to allow for more precise and specific classifications. Since we are at the start of a new era of computer-based classification systems in medical sciences, the choice of the appropriate neural network type should not be too restricted. Rather, combinations of different neural network types should also be taken into account.
References 1. Kelman SE, Perell HF, D’Autrechy L, Scott RJ: A neural network can differentiate glaucoma and optic neuropathy visual fields through pattern recognition. In: Mills RP, Heijl A (eds) Perimetry Update 1990/1991, pp 287-290. Amsterdam/New York/Milano: Kugler & Ghedini 1991 2. Nagata S, Kani K, Sugiyama A: A computer-assisted visual field diagnosis system using a neural network. In: Mills RP, Heijl A (eds) Perimetry Update 1990/1991, pp 291-295. Amsterdam/New York/ Milano: Kugler & Ghedini 1991 3. Keating D, Mutlukan E, Damato B, Evans A: A back propagation neural network for the classification of visual field data. Invest Ophthalmol Vis Sci 33:970, 1992 4. Keating D, Mutlukan E, Evans A, McGaryle J, Damato B: A back propagation neural network for the classification of visual field data. Phys Med Biol 38:1263-1270, 1993 5. Mutlukan E, Keating D: Visual field interpretation with a personal computer based neural network. Eye 8:321-323, 1994 6. Goldbaum MH, Sample PA, White H, Côlt B, Raphaelian P, Fechtner RD, Weinreb RN: Interpretation of automated perimetry for glaucoma by neural network. Invest Ophthalmol Vis Sci 35:3362-3373, 1994 7. Spenceley S, Henson DB, Bull DR: Visual field analysis using artificial neural networks. Ophthalmic Physiol Opt 14:239-248, 1994
06.p65
287
11/25/99, 12:07 PM
288
W. Fink et al.
8. Henson DB, Spenceley S, Bull DR: Fieldnet: Package for the spatial classification of glaucomatous visual field defects. In: Wall M, Heijl A (eds) Perimetry Update 1996/1997, pp 289-298. Amsterdam/ New York: Kugler 1997 9. Henson DB, Spenceley S, Bull DR: Spatial classification of glaucomatous visual field loss. Br J Ophthalmol 80:526-531, 1996 10. Henson DB, Spenceley S, Bull DR: Artificial neural network analysis of noisy visual field data in glaucoma. Artif Intell Med 10:99-113, 1997 11. Brigatti L, Nouri Mahdavi K, Weitzman M, Caprioli J: Automatic detection of glaucomatous visual field progression with neural networks. Arch Ophthalmol 115:725-728, 1997 12. Fink W: Anwendung theoretisch-physikalischer Methoden in der Ophthalmologie. Dissertation, Institute for Theoretical Physics, University of Tübingen 1997 13. Fink W: Neural attractor network for application in visual field data classification. (to be published) 14. Hopfield JJ: Neural networks and physical systems with emergent collective computational abilities. Proc Nat Acad Sci US 79:2554-2558, 1982 15. Hertz J, Krogh A, Palmer RG: Introduction to the theory of neural computation. Lecture Notes Volume I. Addison-Wesley Publishing Company 1991 16. Müller B, Reinhardt J: Neural Networks: An Introduction. Berlin/Heidelberg/New York: Springer 1990 17. Schiefer U, Wilhelm H: Gesichtsfeld-Kompendium. Interpretation perimetrischer Befunde. Fachübergreifende diagnostische Maßnahmen. Klin Monatsbl Augenheilkd 206:206-238, 1995 18. Rumelhart DE, Hinton GE, Williams RJ: Learning representations by back-propagating errors. Nature 323:533-536, 1986 19. Rumelhart DE, Hinton GE, Williams RJ: Learning internal representations by error propagation. In: Rumelhart DE, McClelland JL (eds) Parallel Distributed Processing, Vol 1, Ch 8. Cambridge, MA: MIT Press 1986
06.p65
288
11/25/99, 12:07 PM