No-Redundant Metrics for UML Class Diagram Structural Complexity Mª Esperanza Manso1 , Marcela Genero 2 , Mario Piattini 2 1 Deparment of Computer Science University of Valladolid - Valladolid - Spain
[email protected] 2 Department of Computer Science University of Castilla-La Mancha - Ciudad Real – Spain {Marcela.Genero, Mario.Piattini}@uclm.es
Abstract. In software engineering it is widely acknowledged that the usage of metrics at the initial phases of the object oriented software life cycle can help designers to make better decisions and to predict external quality attributes, such as maintainability. Following this idea we have carried out three controlled experiments to ascertain if any correlation exists between the structural complexity and the size of UML class diagrams and their maintainability. We used 8 metrics for measuring the structural complexity of class diagrams due to the usage of UML relationships, and 3 metrics to measure their size. With the aim of determining which of these metrics are really relevant to be used as class diagrams maintainability indicators, we present in this work a study based on Principal Component Analysis. The obtained results show that the metrics related to associations, aggregations, generalizations and dependencies, are the most relevant whilst those related to size seem to be redundant.
Keywords: class diagram structural complexity, class diagram maintainability, metrics, empirical validation, principal component analysis
1 Introduction One of the principal goals of software engineering is to assure the quality of object oriented (OO) software from the early phases of the life-cycle, such as conceptual modelling. As class diagrams constitute a key artifact in the conceptual modelling phase, the effort spent on improving their maintainability is likely to pay off many times over in later phases. We focus on maintainability because it has become one of the software product quality characteristics [25] that software development organizations are more concerned about, since it is the major resource consumer of the whole software life
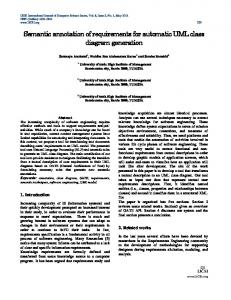
cycle [28]1. But we are aware that maintainability is an “external quality attribute” that can only be evaluated once the product is finished or nearly finished. Therefore, it is necessary to have early indicators of such qualities based, for example, on the structural properties of class diagrams [5], such as their structural complexity and size. The theoretical basis for developing quantitative models relating structural properties and external quality attributes has been provided by Briand et al. [6] (see figure 1). It is the basis for much empirical research in the area of software artifact structural properties [16,17,30]. In this work we assume a similar representation to hold for UML class diagrams. We hypothesized that the structural properties (such as structural complexity and size) of a UML class diagram have an impact on its cognitive complexity. By cognitive complexity we mean the mental burden of the people who have to deal with the artifact (e.g. developers, testers, maintainers). High cognitive complexity leads to an artifact which reduces their understandability, and this conduces undesirable external qualities, such as decreased maintainability.
Structural Properties (e.g. STRUCUTURAL COMPLEXITY, SIZE)
affect affect Cognitive complexity
? External quality attributes ? (e.g. MAINTAINABILITY: understandability, analizability and modifiability)
indicate
Fig. 1. Relationship between structural properties, cognitive complexity, understandability and external quality attributes [6] In response to the great demand for measures of quality characteristics of class diagrams, and after a thorough review of some of the existing OO measures that can be applied at a high level design stage, not only to products [4,7,10,12, etc.] but also to development techniques [31], we have proposed a set of 8 measures for UML class diagram structural comp lexity [21] 2, related to the usage of UML relationships such as, associations, dependencies, aggregations and generalizations; and we also considered traditional metrics, such as size merics (see table 1). Table 1. Metrics for UML class diagram structural complexity
Type of Metrics Size metrics Structural complexity 1
Metric definition Number of Classes (NC). The total number of classes. Number of Attributes (NA). The total number of attributes. Number of Methods (NM). The total number of methods Number of Associations (NAssoc).The total number of associations
Maintainability is not restricted to code, it is an attribute of the different software products we hope to maintain [18], including also conceptual models. 2 We focused on UML because it is considered a standard in OO modelling.
metrics
Number of Aggregations (NAgg). The total number of aggregation relationships within a class diagram (each wholepart pair in an aggregation relationship) Number of Dependencies (NDep). The total number of dependency relationships Number of Generalisations (NGen). The total number of generalization relationships within a class diagram (each parent-child pair in a generalization relationship) Number of Generalization hierarchies (NGenH). The total number of generalization hierarchies in a class diagram Maximum DIT (MaxDIT). It is the maximum DIT value obtained for each class of the class diagram. The DIT value for a class within a generalization hierarchy is the longest path from the class to the root of the hierarchy. Maximum HAgg (MaxHAgg). It is the maximum HAgg value obtained for each class of the class diagram. The HAgg value for a class within an aggregation hierarchy is the longest path from the class to the leaves.
Part of the information that these metrics provide might be redundant, which in statistical terms is equivalent to saying that metrics might be very correlated. This justifies the interest of analyzing the information that each metric captures to eliminate such redundancy. In the experimental research in software engineering [3,7,9], like in the other disciplines, this problem is solved by using the Principal Component Analysis (PCA) [15]. In this case, through the PCA, the purpose is to reduce the space of 11 metric dimensions that contain the initial information, in order to later study the correlation among these new dimensions, and the dependant variables of interest, in our case of maintainability. With the aim of ascertaining if any correlation exists between the metrics we presented in table 1, and the class diagram maintainability characteristics, such as understandability and analizability [25] 3, we have carried out a familiy of three experiments [20,22,23]. The metric values calculated within the class diagrams used in these three experiments, is the data used in the PCA. Summarising, and using the Goal-Question-Metric template (GQM) [1] for goal definition, the goals of this work are the following: − First goal : Perform an exploratory study of the UML class diagrams to characterize them with respect to a set of metrics, from the point of view of the software designers, in the context of students and professors in the Department of Computer Science at the University of Castilla-La Mancha, in Spain. − Second goal: Analize the structural complexity and the size the UML class diagrams, to evaluate them with respect to their correlation with class diagram maintainability, from the point of view of the software designers in the context 3
Even though understandability has not been considered as a maintainability sub-characteristic by the ISO 9126 [25], we include it because there exists a lot of work related to software measurement, that considers understandability to be a factor that influences maintainability [8,18,24].
of students and professors in the Department of Computer Science at the University of Castilla-La Mancha, Spain. The rest of this paper is organized as follows: Section 2 briefly describes the PCA. The description of the data used in this study is presented in section 3, and the data analysis for obtaining no-redundant metrics for UML class diagrams comes in section 4. Finally, the last section presents some concluding remarks, and identifies further work related to OO metrics applied at early phases of OO software development.
2 Principal Component Analysis If a group of variables in a data set are strongly correlated, these variables are likely to measure the same underlying dimensions (i.e., class internal quality attribute) of the object to be measured. PCA is a standard technique used to identify the underlying, orthogonal dimensions that explain relations between the variables in the data set. Principal components (PCs) are linear combinations of the standarized independent variables. The sum of the square of the coefficients in each linear combination is equal to one. PCs are calculated as follows: The first PC is the linear combination of all standarized variables that explain a maximum amount of variance not explained in the data set. The second and subsequent PCs are linear combinations of all standarized variables, where each new PC is orthogonal to all previously calculated PCs, and captures a maximum variance under these conditions. Usually, only a subset of all variables have large coefficients –also called the loading of the variable– and therefore, contributes significantly to the variance of each PC. The variables with high loadings help identify the dimensions the PC is capturing, but this usually requires some degree of interpretation. In order to identify these variables and interpret the PCs, we consider the rotated components. This is a technique where PCs are subjected to an orthogonal rotation. As a result, the rotated components show a clearer pattern of loadings, where the variables either have a very low or high impact on the PC. Several strategies exist to perform such a rotation. We used the varimax rotation, which is the most frequently used strategy in the literature. For a set of n measures, there are at most, n orthogonal PCs, which are calculated in decreasing order of variance they explain in the data set. Associated with each PC is its eigenvalue, which is a measure of the variance of the PC. Usually, only a subset of the PCs is selected for further analysis (interpretation, rotated comp onents, etc.). A typical stopping rule that we also use in this study, is that only PCs whose eigenvalue is larger than 1.0 are selected. Regarding replicated studies, it is interesting to see which dimensions are also observable in other systems, and find possible explanations for differences in the results. We would expect to see consistent trends across systems for the strong PCs, which explain a large percentage of the data set variance, and can be readily interpreted. From such observations, we can also derive recommendations regarding which measures appear to be redundant, and need not be collected, without losing a significant amount of design information.
3 Data Description The data used in this research was obtained through three controlled exp eriments carried out by professors and students of the Department of Computer Science at the University of Castilla -La Mancha, in Spain 4 [20,22,23]. We have followed some suggestions provided by Wohlin et al. [36], Perry et al. [27], [5] and Kitchenham et al. [26] on how to perform controlled experiments. The common characteristics of the three experiments are the following: − The independent variables are the structural complexity and the size of UML class diagrams, measured via the 11 metrics shown in table 1. The dependent variables are maintainability sub-characteristics of class diagrams, measured in each experiment in a different way. − We selected a within-subject design experiment, i.e., all the tests (experimental tasks) had to be solved by each of the subjects. The tests were put in a different order for each subject. − Subjects were given an intensive training session before the experiments took place. However, the subjects were not aware of what aspects we intended to study. Neither were they aware of the actual hypothesis stated. − We wanted to test the hypothesis that exists correlation between the metrics we presented in table 1 and the class diagram maintainability characteristics, such as understandability, analyzability and modifiability. In the next subsections the main characteristics of each experiment are described. 3.1 First Experiment Description −
− − −
− −
4
The subjects were seven professors and ten students enrolled on the final-year of Computer Science at the Department of Computer Science at the University of Castilla-La Mancha in Spain. The professors belong to the Software Engineering area. The material we handed to the subjects consisted of twenty eight UML class diagrams of the same universe of discourse, related to Bank Information Systems. Each diagram had a test enclosed which included the description of three maintainability sub-characteristics: understandability, analyzability and modifiability. Each subject had to rate each sub-characteristic using a scale consisting of seven linguistic labels. For example for understandability we proposed seven linguistic labels ranging from, extremely difficult to understand, to extremely easy to understand. The subjects were given all the materials and we explained to the to them how to carry out the tests. We allowed one week for them to do the experiment, i.e., each subject had to carry out the test alone, and could have unlimited time to solve it.
The experimental material can be found in http://alarcos.inf-cr.uclm.es
−
We summarised the empirical data in a table consisting of 28 rows and 14 columns. The 28 rows represent each one of the 28 UML class diagrams given out to the subjects. The first 11 columns represent the values of the dependent variables (metrics), and the final three, the median of the subjects´ ratings for understandability, analysability and modifiability.
3.2 Second Experiment Description −
−
− −
−
−
−
The subjects were ten professors and twenty students enrolled on the final-year of Computer Science at the Department of Computer Science at the University of Castilla-La Mancha in Spain. All of the professors belong to the Software Engineering area. The dependent variable was measured by the time the subjects spent carrying out the tasks required in the experiment. We called this time “maintenance time”. Maintenance time is comprised of the time taken to comprehend the class diagram, to analyse the required changes and to implement them. Our assumption here is that, for the same modification task, the faster a class diagram can be modified, the easier it is to maintain. The material we gave to the subjects consisted of nine UML class diagrams of different application domains. Each diagram had an enclosed test that included a brief description of what the diagram represented, and two new requirements for the class diagram. Each subject had to modify the class diagrams according to the new requirements, and specify the start and end time. The difference between the two is what we call maintenance time (expressed in minutes and seconds). The modifications to each class diagram were similar, including adding attributes, methods, classes, etc. The subjects were given all the materials described in the previous paragraph. We explained to them how to carry out the tests. We allowed one week for them to do the experiment, i.e., each subject had to carry out the test alone, and could use unlimited time to solve it. Once the data was collected, we controlled if the tests were complete, and if the modifications had been done correctly. We discarded the tests of seven subjects, which included a required modification that was done incorrectly. Therefore, we took into account the responses of 23 subjects. We summarised the empirical data in a table consisting of 9 rows and 12 columns. The 9 rows represent each one of the 9 UML class diagrams given out to the subjects. The first 11 columns represent the values of the measures of the independent variables (the metrics presented in table 1), and the last column represents the mean of the maintenance time for each diagram.
3.3 Third Experiment Description
− The data of this sample are very similar to the second experiment’s ones. The − −
−
only difference is that 9 different UML class of diagrams were taken, which implies that the values of the metrics are also different. The modifiability and understandability time (expressed in seconds) were considered as measures of the dependent variables. The subjects had to answer a questionnaire (5 questions) that reflected whether or not they had understood each diagram and they also had to write down how long it took to answer the questions. The understandability time was obtained from that. The maintenance time was obtained in the same way as in the second experiment. The subjects were 30 undergraduate students enrolled on the third-year of Computer Science, but we also used the empirical data obtained from the responses of 23 subjects, because the other results were incomplete.
3.4 Threats to validity of te empirical data We will discuss the various issues that threaten the validity of the empirical studies and how we attempted to alleviate them: − Threats to conclusion validity. The conclusion validity defines the extent to which conclusions are statistically valid. The only issue that could affect the statistical validity of this study is the size of the sample data. We are aware of this, but it is wel acknowledged that Empirical Software Engineering suffer form the lack of enough data. − Threats to Construct Validity. The construct validity is the degree to which the independent and the dependent variables are accurately measured by the measurement instruments used in the studies. The construct validity of the measures used for the independent variables is guaranteed by Poels and Dedene´s framework [21] used for their theoretical validation [29]. The measures we used for the dependent variable are different in each experiment but in all cases we used measures that really measure what we purpose to measure: the subjects´rating (first experiment), the maintenace time (second experiment), the understandability and modifiability time (third experiment), so we consider these measures constructively valid. − Threats to Internal Validity. The internal validity defines the degree of confidence in a cause-effect relationship between factors of interest and the observed results. Seeing the results of the experiment we can conclude that empirical evidence of the existing relationship between the independent and the dependent variables exists. The analysis performed here is correlational in nature. We have demonstrated that several of the metrics investigated had a statistically and practically significant relationship with maintainability sub-characteristics. Such statistical relationship do not demonstrate per se a causal relationship. They only provide empirical evidence of it. Only controlled experiments, where the metrics would be varied in a controlled manner and all other factors would be
held constant, could really demonstrate causality. However, such a controlled experiment would be difficult to run since varying structural complexity in a system, while preserving its functionality, is difficult in practice. On the other hand, it is difficult to imagine what could be alternative explanations for our results besides a relationship between structural complexity and maintainability sub-characteristics . We have tackled different aspects that could threaten the internal validity of the study, such as: differences among subjects, knowledge of the universe of discourse among class diagrams, precision in the time values, learning effects, fatigue effects, persistence effects and subject motivation. − Threats to External Validity. External validity is the degree to which the research results can be generalised to the population under study (UML diagrams used as design artifacts for developing OO software) and to other research settings. The greater the external validity, the more the results of an empirical study can be generalised to actual software engineering practice. Two threats to validity have been identified which limit the ability to apply any such generalisation, and we tried to alleviate them: o Materials and tasks used. In the experiments we tried to use class diagrams which can be representative of real cases. Related to the tasks, the judgement of the subjects (in the first experiment) is to some extent subjective, and does not represent a real task. But we improved this aspect considering more real tasks in the second and third experiment. o Subjects. To solve the difficulty of obtaining professional subjects, we used professors and advanced students from software engineering courses. We are aware that more experiments with practitioners and professionals must be carried out in order to be able to generalise these results. However, in this case, the tasks to be performed do not require high levels of industrial experience, so, experiments with students could be appropriate [2]. For the sake of brevity we do not explain in detail the experimental process for each experiment. Further details for each experiment can be found in [20,22,23].
4. Data Analysis and Interpretation First, we used PCA 5 [5] to reduce the initial space of 11 metric dimensions, in which the structural complexity and the size of UML class diagrams are represented, which were the first goal of this study; eliminating redundant information (in this case metrics). In this PCA we have worked with rotated components, in order to reduce the dimension so that each one of the new components is going to be very correlated with very few of the old metrics or dimensions, which will ease the comprehension.
5
The 11.0 version of SPSS has been used [35] to analyse the samples of data described in the previous section.
Later on, we used a Pearson or Spearman correlation analysis [34], depending on the type of variables of the research, with the aim of studying the correlation of the new dimensions given by the PCA with the dependant variables related to the maintainability, which is the second goal of this study.
4.1 Analysis of the Data of the First experiment
4.1.1 Dimensions reduction (PCA). Three rotated PCs were obtained (see table 2), with the constraint that the eigenvalue is larger than 1.0. With these PCs 93.76% (see table 3) of the total variability is explained. As you can observe while observing table 2: − The PC1 picks out information of the structural complexity relative to the aggregation. − The PC2 picks out information of the structural complexity given by the generalization. − The PC3 refers to the structural complexity given by the relations of association and dependencies among classes. The metrics NA, NGenH, NM and NC seem not to be relevant in the PCA. Because the correlation with the metrics that do appear in the PCA is high (see table 4), we can think that the information that they contain has already been transmitted through the metrics that are relevant in the PCA.
Table 2. Rotated Components PCs Metrics PC1 PC2 PC3 MaxHAgg 0.911 0.231 0.126 NAggH 0.879 0.141 0.349 NAgg 0.873 0.382 0.185 NA 0.669 0.539 0.492 NGenH 0.586 0.494 0.513 MaxDIT 0.187 0.962 0.408 NGen 0.263 0.893 0.300 NM 0.567 0.675 0.429 NC 0.560 0.648 0.501 NDep 0.123 0.136 0.943 NAssoc 0.450 0.265 0.817
NC NA NM NGH
Table 3. Total Variation Explained by the PCs Eigenvalue Percentage Accumulated Percentage PC1 4.112 37.383 37.383 PC2 3.441 31.278 68.661 PC3 2.761 25.101 93.763 PCs
Table 4. Correlation between metrics NAssoc NAagg NAggH NDep NGen NGH 0.843 0.817 0.761 0.607 0.893 0.928 0.830 0.884 0.841 0.627 0.802 0.897 0.776 0.851 0.728 0.591 0.856 0.843 0.849 0.759 0.723 0.548 0.753 1.000
MaxHAgg MaxDIT 0.717 0.728 0.784 0.659 0.732 0.786 0.712 0.568
4.1.2 Correlation between the structural complexity and the PCs. The correlation of the new components with dependent variables, understandability, analyzability and modifyability has been studied by using the Spearman correlation coefficient (see table 5). For that, the coefficients for factorial punctuations have been previously calculated with the Anderson-Rubi method. These are the three components of the class diagrams in the new space of three dimensions. Table 5. Spearman’s correlation coefficient PC1 PC2
PC3
The observed results were the following: - (p=0.005 0.679− Understandability is highly 0.520 correlated with) PC2 (generalizations) (0.6790.312 Understandability (p=0.000) (p=0.106 ) p=0.000) and less with PC1 (aggregations (0.520 p= 0.005) 0.544 - (p=0.003 ) 0.702 0.265 − Analizability Analizability is highly correlated with PC2 (generalizations) (0.702 p=0.000) (p=0.000) (p=0.174) and less with PC1 (aggregations) (0.544 p= 0.003) 0.502 - (p=0.006) 0.747 0.268 − Modificability Modifiability is highly corelated with PC2 (generalizations) (0.747 p=0.000) (p=0.000) (p=0.168) and less with PC1 (aggregations) (0.502 p= 0.006) In conclusion, it seems that PC3, that refers to dependencies and associations, is not correlated with none of the studied dependent variables. This fact might have been produced because, after analyzing the class diagrams that were used in the experiment, it was observed that mostly they had very few associations and even less dependencies. From that comes the necessity of making a next experiment in which more emphasis is put on this type of relations. Definitively, after analyzing the data obtained in the first experiment, we can say that apparently the metrics that have to do with the aggregation and the generalization, influence the maintainability of class diagrams. Although these results are partial, they are similar to the ones found in different empirical researches made to evaluate the effect of the relation of generalization about the OO software maintainability [3,12,13,24,31]. Otherwise, as Deligiannis et al. [14] affirm, the relations of aggregation have been less studied from an empirical point of view. That is why they insist on the necessity to deepen on this subject, now that there exists the suspicion that the usage of the aggregation might complement the design of more extensive and reusable products. 4.2 Second experiment analysis
4.2.1 Dimensions Reduction (PCA). The solution obtained in the PCA after the rotation of the components, with an eigenvalue larger than 1 (see table 6), explains 79,151% of the total variability (see table 7). Table 6. Rotated components PCs Metrics NC NA NM NAssoc NAgg NDep NGen NAggH NGenH MaxHAgg MaxDIT
PC1 0.796 0.359 0.683 -0.08817 0.729 0.728 0.927 0.632 0.870 0.872 0.832
Table 7. Total Variation Explained by the PCs Eigenvalue Percentage Accumulated Percentage PC1 5.768 52.440 52.440 PC2 2.938 26.711 79.151 PCs
PC2 0.561 0.862 0.686 0.911 0.239 -0.248 0.00895 0.348 0.399 0.269 0.330
NC NM NAggH NAgg NDEP
Table 8. Correlation between metrics NA NGen NGenH MaxHAgg 0.775 0.794 0.886 0.833 0.900 0.651 0.887 0.760 0.341 0.570 0.710 0.634 0.338 0.501 0.651 0.928 0.148 0.684 0.438 0.610
MaxDIT 0.822 0.827 0.607 0.536 0.406
In this case the conclusions that can be extracted are the following: − The PC1 is determined because of the complexity given by the generalization. − The PC2 otherwise, picks out the complexity of the associations and the number of attributes. In this research the metrics that allows elimination because of having redundant information, are NC, NM, NAgg, NDep and NAggH (see table 6). The information they contain will be picked out through the metrics with the correlated ones (see table 8) that intervene in the principal components.
4.2.2 Correlation between the structural complexity and the PCs. The correlation of the new PCs has been studied (see table 8) with the dependent variable and the maintenance time, using the Pearson´s correlation coefficient (see table 9). For that, the coefficients for the factorial punctuations were previously calculated with the Anderson-Rubi method. These are the two components of the class diagrams in the new space of two dimensions. The correlation between maintenance time and the PCs shown in the table, is only significant for the PC2 (see table 9) that corresponds to associations and attributes. Table 9. Pearson´s correlation coefficient PC1 PC2 Maintenance time 0.485 - (p=0.185) 0.853 - (p=0.003)
4.3 Analysis of the third experiment
4.3.1 Dimensions reduction (PCA). While studying the table of correlations among the metrics, it was observed that NM was not correlated with any of the others, that is why the PCA was made without including it, because it constitutes a dimension. After the rotation, the PCA presented the results of table 10, with the same restriction as in the previous cases (autovalues that are bigger than one), and explained 92.075% of the total variability (see table 11). Table 10. Rotated components Metrics PCs
NC NA NAssoc NAgg NDep NGen NAggH NGenH HAggMax MaxDIT
PC1 0.643 0.423 0.667 0.397 0.855 0.956 -0.247 0.961 0.741 0.941
NC NC NM NAssoc MaxHAgg
1.000 0.214 0.819 0.909
Table 11. Total Variation Explained by the PCs PCs Eigenvalue Percentage Accumulated Percentage PC1 5.260 52.596 52.596 PC2 3.948 34.480 92.075
PC2 0.753 0.859 0.579 0.901 0.414 0.221 0.955 0.044 0.591 0.111
Table 12. Correlation between metrics NAssoc NA NAgg NDep NGen 0.819 0.509 1.000 0.828
0.928 0.281 0.763 0.748
0.953 0.133 0.714 0.834
0.863 0.342 0.862 0.926
0.778 0.394 0.714 0.858
MaxHAgg
MaxDIT
0.909 0.314 0.828 1.000
From the PCs shown in table 10 the following can be concluded: − The PC1 picks out the information related to dependencies and generalizations. − The PC2 picks out the information related to aggregations and attributes. In this research, the metrics that allow elimination because of having redundant information are NC, NAssoc and MaxHAgg. As seen in table 12, they are very correlated among themselves, besides others being part of the selected PCs. In this way, NC is very correlated with metrics that determine the PC2, meanwhile, NAssoc y MaxHAgg are very correlated with metrics of the PC1.
0.714 0.176 0.654 0.688
4.3.2 Correlation between the structural complexity and the PCs. Correlation of new PCs (see table 10) and NM with the dependent variables, the understandability and maintenance time have been studied, using Pearson´s correlation coefficient (see table 13). For that, coefficients for factorial punctuations were previously calculated with the Anderson-Rubi method. These are the two components of the class diagrams in the new space of two dimensions Table 13. Pearson´s correlation coefficients PC1 PC2
NM
Understandability time
0.355 (p=0.348)
0.769 (p=0.016)
0.401 (p=0.285)
Maintenance time
0.472 (p=0.199)
0.365 (p=0.376)
0.146 (p=0.709)
Analysing the obtained results in table 13, it can be observed that: − The understandability time is highly correlated with PC2, which is related with aggregations and attributes. − The maintenance time is not correlated with the PCs. − Besides, the third dimension that NM represents is not related to any of the two dependent variables. Given that in the previous experiment the maintainance time has been evaluated without making the difference between understandability and maintenance time, it is considered to be a new dependent variable in this case Total Maintenance Time that measures the maintenance time as the sum of both of them. In this way the results of both experiments can be better compared (see table 14). Table 14. Pearson´s correlation coefficients PC1 PC2 Total maintenance time
0.472 (p=0.199)
0.669 (p=0.049)
NM 0.146 (p=0.709)
In table 14 the results can be observed. Only the component PC2, that picks out the information of the aggregations and the number of attributes, is positively correlated with the maintainance time. As expected, the sum of the two times reduces the correlation grade, from 0.769 to 0.669, and the level of signification gets worse, from 0.016 to 0.049, although the result keeps being significant at the level 0.05.
5 Conclusions and future work It is well known that softeare product metrics are very useful to evaluate the different characteristics that affect the quality of OO software, for example the maintainability
[18]. With this idea in mind, we have carried out three controlled experiments to test if the metrics we had defined for class diagram structural complexity, and other traditional metrics related to class diagram size, could be really used as class diagram maintainability indicators at the early phases of the OO software life-cycle. With the aim to discover which of the used metrics might not be redundant in these empirical studies, we have used PCA in this work. After performing the PCA we managed to observe in the three samples of data, that the PCs containing non-redundant information present well known characteristics of the OO design, which have to be with the usage of relations, associations, dependencies, aggregations and generalizations. The metrics related to the size do not seem to be relevant, like NC and NM, but NA is. Although it is reasonable to think that the more classes there are in a diagram the more dependencies and associations can exist, in this research it is declared that these last ones could influence the maintainability. If we examine the correlation among the maintainability and/or the understandibility and the PCs in the two experiments where they are measured objectively using the maintenance time (see table 9 and 14), it is clear that it is correlated in the first experiment with the PC that picks out the structural complexity of class diagrams due to the number of associations together with the number of attributes. In the second experiment it is correlated with the PC that picks out the number of aggregations and the number of attributes. When separating the maintenance time considering the modifiability and the understandability time, the grade of dependence and the signification improve, so it would seem correct to make this difference, unless in the dependent variables. The results of the first experiment deserve a separate comment, for the dependent variables are subjective measures. No size metric appears to be relevant in the PCA. The PC1 and PC2, that pick out the information of the aggregration and the generalization, are the ones being significantly correlated with dependent variables. These results confirm what is already known [3,9], that the results obtained in the PCA are dependent on the data, for that even though in the three data samples the results obtained are in a certain way similar, it will be necessary to keep on making empirical researches that for one part allow people to explore the obtained results, building prediction models for the class diagram maintainability. On the other hand, it is necessary to make a family of experiments that allow the extension of conclusions as much as possible to increase the external validity of the results, including experiments with professionals and also data about real projects. Besides we are conscious of the necessity to make laboratory packages with the information of the empirical studies, to encourage their external replication and obtain a body of knowledge about the utility of metrics[2,11,33]. This can contribute to metrics being useful for OO software designers to make better decisions in the early phases of OO software development, which is the most important goal for any measurement proposal to pursue if it aims to be useful [19].
Acknowledgements This research is part of the DOLMEN (TIC 2000-1673-C06-06) and the CALDEA (TIC 2000-1673-C06-06) projects, financed by Subdirección General de Proyectos de Investigación - Ministerio de Ciencia y Tecnología.
References 1. 2. 3.
4. 5.
6.
7.
8.
9. 10. 11.
12. 13.
14.
15. 16.
Basili, V., Rombach, H.: The TAME project: Towards improvement-oriented software environments. IEEE Transactions of Software Engineering, Vol. 14 Nº 16 1998 728-738 Basili, V., Shull, F., Lanubile, F.: Building Knowledge Through Families of Experiments. IEEE Transactions on Software Engineering, Vol. 25 Nº 4 , (1999) 435-437 Briand, L., Wüst, J., Lounis, H.: Replicated Case Studies for Investigating Quality Factors in Object-oriented Designs. Technical report ISERN 98-29 (version 3), International Software Engineering Research Network, (1998) Briand, L., Morasca, S., Basili, V.: Defining and validating measures for object-based high level design. IEEE Transactions on Software Engineering, Vol. 25 Nº 5, (1999) 722-743 Briand, L., Arisholm, S., Counsell, F., Houdek, F., Thévenod-Fosse, P.: Empirical Studies of Object-Oriented Artifacts, Methods, and Processes: State of the Art and Future Directions. Empirical Software Engineering, Vol. 4 No. 4, (1999) 387-404 Briand, L., Wüst, J., Lounis, H.: A Comprehensive Investigation of Quality Factors in Object-Oriented Designs: an Industrial Case Study. 21st Int´l Conference on Software Engineering, Los Angeles, (1999) 345-354 Briand, L., Melo, W., Wüst, J.: Assessing the applicability of fault-proneness models across object-oriented software projects. IEEE Transactions of Software Engineering, Vol 28 Nº 7, (2001) 706-720 Briand, L., Bunse, C., Daly, J.: A Controlled Experiment for evaluating Quality Guidelines on the Maintainability of Object-Oriented Designs. IEEE Transactions on Software Engineering, Vol. 27 No. 6, (2001) 513-530. Briand, L., Wüst, J.: Empirical studies of quality models. Advances in Computers Academic Press, Zelkowitz (ed), Vol. 59, (2002) 97-166 Brito e Abreu, F., Melo, W.: Evaluating the impact of object-oriented design on software quality. Proceedings of 3rd International Metric Symposium, (1996) 90-99 Brooks, A., Daly, J., Miller, J., Roper, M., Wood, M.: Replication of experimental results in software engineering. Technical Report ISERN-96-10, International Software Engineering Research Network, (1996) Cartwright, M.: An Empirical view of inheritance. Information and Software Technology, Vol. 40 Nº 14, (1998) 795-799. Daly, J., Brooks, A., Miller, J., Roper, M., Wood, M.: An Empirical Study Evaluating Depth of Inheritance on Maintainability of Object-Oriented Software. Empirical Software Engineering, Vol. 1 Nº 2, (1996) 109-132 Deligiannis, I., Shepperd, M., Webster, S., Roumeliotis, M.: A Review of Experimental into Investigations into Object-Oriented Technology, Empirical Software Engineering, Vol. 7 Nº 3, (2002) 193-231 Dunteman, G.:Principal Component Analysis. Sage University Paper 07-69, Thousand Oaks, CA, (1989) El-Emam, K.: The Prediction of Faulty Classes Using Object-Oriented Design Metrics, NRC/ERB1064, National Research Council Canada, (1999 )
17. El-Emam, K.: Object-Oriented Metrics: A Review on Theory and Practice, NRC/ERB 1085, National Research Council Canada, (2001) 18. Fenton, N., Pfleeger, S.: Software Metrics. A Rigorous and Practical Approach. Second edition. International Thomson Publishing Inc., (1997) 19. Fenton, N., Neil, M.: Software Metrics: a Roadmap. Future of Software Engineering, Ed. Anthony Finkelstein, ACM, (2000) 359-370 20. Genero, M., Olivas, J., Piattini, M., Romero, F.: Using metrics to predict OO information systems maintainability. CAISE 2001, LNCS 2068, Interlaken, Switzerland, (2001) 388401 21. Genero, M.: Defining and validating metrics for conceptual models. Ph.D. Thesis Department of Computer Science, University of Castilla-La Mancha, (2002) 22. Genero, M., Olivas, J., Romero, F., Piattini, M.: Assessing OO Conceptual Models Maintainability. 1st International Workshop on Conceptual Modeling Quality (IWCMQ´02), within the ER 2002, LNCS (to appear) (2002) 23. Genero, M., Piattini, M., Calero, C.: Empirical Validation of Class Diagram Metrics. International Symposium on Empirical Software Engineering (ISESE 2002), Nara, Japan, IEEE Computer Society, (2002) 195-203 24. Harrison, R., Counsell, S., Nithi, R.: Experimental Assessment of the Effect of Inheritance on the Maintainability of Object-Oriented Systems. The Journal of Systems and Software, 52, (2000) 173-179. 25. ISO 9126.: Software Product Evaluation-Quality Characteristics and Guidelines for their Use, ISO/IEC Standard 9126, Geneva, (2001) 26. Kitchenham, B., Pflegger, S., Pickard, L., Jones, P., Hoaglin, D., El-Emam, K., Rosenberg, J.: Preliminary Guidelines for Empirical Research in Software Engineering. IEEE Transactions of Software Engineering, Vol. 28 No. 8, 721-734 27. Perry, D., Porter, A., Votta, L.: Empirical Studies of Software Engineering: A Roadmap, Future of Software Engineering, ACM, Ed. Anthony Finkelstein, (2000) 345-355. 28. Pigoski, T.: Practical Software Maintenance. Wiley Computer Publishing, New York, USA, (1997) 29. Poels, G., Dedene, G.: Distance-based software measurement: necessary and sufficient properties for software measures, Information and Software Technology, Vol. 42 No. 1, (2000) 35-46 30. Poels, G., Dedene, G.: Measures for Assessing Dynamic Complexity Aspects of ObjectOriented Conceptual Schemes. 19th International Conference on Conceptual Modelling (ER 2000). Salt Lake City, USA, (2000) 499-512 31. Poels, G., Dedene, G.: Evaluating the Effect of Inheritance on the Modifiability of ObjectOriented Business Domain Models. 5th European Conference on Software Maintenance and Reengineering (CSMR 2001), Lisbon, Portugal, (2000) 20-29 32. Rossi,, M., Brinkkemper, S.: Complexity Metrics for Systems Development Methods and Techniques. Information Systems,Vol. 21 No. 2, (1996) 209-227 33. Shull, F., Basili, V., Carver, J., Maldonado, J.: Replicating Software Engineering Experiments: Addressing the Tacit Knowledge Problem. 2002 International Symposium on Empirical Software Engineering (ISESE 2002), Nara, Japan, IEEE Computer Society, (2002) 7-16 34. Snedecor, G., Cochran, W.: Statistical Methods, 8 ª ed., Iowa State University Press 35. SPSS 11.0. 2001. Syntax Reference Guide, Chicago, SPSS Inc, (1989) 36. Wohlin, C., Runeson, P., Höst, M., Ohlson, M., Regnell, B., Wesslén, A.: Experimentation in Software Engineering: An Introduction, Kluwer Academic Publishers, (2000)