Department of Computer Science. Kent State ... graph layout criteria emphasizing UML class diagrams, based on laws of .... undergraduate (2) and graduate students (18) in computer science. .... them which one they liked best in terms of.
Andriyevska, Dragan, Simoes, Maletic
VISSOFT05 Submission
Evaluating UML Class Diagram Layout based on Architectural Importance Olena Andriyevska, Natalia Dragan, Bonita Simoes, Jonathan I. Maletic Department of Computer Science Kent State University Kent Ohio 44242 {oandriye, ndragan, bsimoes, jmaletic}@cs.kent.edu investigate whether laying out UML class diagrams according to control, boundary and entity class stereotypes [1] information improves the understanding of the diagrams (i.e., class model). We present a pilot study to evaluate the effectiveness of stereotype-based architectural importance of UML layout. The paper is organized as follows. In section 2 we describe the design of our pilot study. Results and analysis of the experiment are described in section 3. Discussion and conclusions are presented last.
Abstract The paper presents and assesses a layout scheme for UML class diagrams that takes into account the architectural importance of a class in terms of its stereotype (e.g., boundary, control, entity). The design and running of a user study is described. The results of the study supports the hypothesis that layout based on architectural importance is more helpful in class diagram comprehension compared to layouts focusing primarily on aesthetics and/or abstract graph guidelines.
2. Design of the Study
1. Introduction
The purpose of the pilot study is to verify the usefulness of our ideas and to gather more information in the process. The overall structure of the study consists of three stages: preprocessing/preparation step, experiment, and analysis of the results. In the preprocessing step, all participants filled out a questionnaire consisting of eight questions. The reason for this was to collect as much information as possible about participants in order to be able to form three equal and fair groups. The reason for choosing three groups is mentioned in the following section. The questions asked information about programming experience, UML usage and whether or not they were taught (or learnt) a particular UML layout. There were two questions targeted at examining the basic knowledge of UML class diagrams. The purpose was to make sure the subjects/participants knew the commonly used relationships and structure of a UML class diagram. We decided to use three levels of UML expertise: expert, intermediate and basic. Subjects who correctly answered all UML related questions were considered as experts. On the other extreme, subjects who did not get one or both questions right, but had general OO experience and some fundamental understanding of class relationships, were considered to be basic users. Subjects who got an answer partially correct were at the intermediate level. Besides gauging the level of users only on correct answers, we also looked
There have been a number of studies conducted on the layout of UML class diagrams. Researchers have investigated the problem of class diagram layout from different perspectives such as efficiency of layout algorithms, user aesthetics, and ease of navigation. In a recent study Sun et al. [12] propose a classification of graph layout criteria emphasizing UML class diagrams, based on laws of perceptual theories. Eiglsperger et al. [4], Eichelberger [2, 3], and Gutwenger [5, 6] propose algorithms for layout of UML class diagrams, whereas Purchase at al. [9-11] did extensive empirical studies on different types of graph layouts including UML class diagrams. Also, Ware and Purchase defined guidelines for abstract graph structures [13]. Eichelberger suggests incorporating information such as annotated complexity, spatial distribution, scaling according to complexity, and coloring into the set of aesthetic criteria for the layout of a UML class diagram. With regards to navigation Musial et al. [8] incorporated a focus+context information visualization technique to interact with UML diagrams. We believe that organizing a class diagram based within the context of these techniques but emphasizing architectural importance is a better method of layout. Our hypothesis is that organizing a class diagram based on architectural importance will help users build better mental models thereby gaining more information about the system under consideration. Specifically we
1 of 6
Andriyevska, Dragan, Simoes, Maletic
VISSOFT05 Submission
Most (75%) of the subjects had no experience with HippoDraw. The other 25% were somewhat familiar with HippoDraw stating that they did not really use it but had heard about it before. Two of the subjects had reverse engineered HippoDraw using Visual Paradigm (as part of a course project). However, they pointed out that they were not very familiar with the design details of the system. All of the participants were familiar with object oriented design methodology. Before the subjects were asked any questions, they were given ten minutes to familiarize themselves with the HippoDraw system. A short description was given to them along with an overview class diagram of the major hierarchies that would be used during the study. Each group saw the same set of classes but in a different UML layout – this will be discussed in section 2.1. In this introduction, we also added some information about the UML notations used. This was primarily done to refresh the memory of participants who mainly fell under the basic level of UML expertise. Most of the questions were multiple choice questions. Each question was accompanied by a class diagram.
at their experience in industry as well as the approximate number of lines of code they wrote and projects they worked on. The experiment itself was divided into two parts: comprehension and preference. Finally, the results were analyzed. The following sub-sections will describe details of class diagram layouts used as well as the comprehension and preference part of the experiment. Table 1. Participant summary. Number of subjects/participants Number of groups Environment Controlled Uncontrolled Subject’s Expert Level Intermediate Basic Familiarity Very Familiar with Somewhat Familiar Hippodraw Not Familiar
20 3 11 9 6 6 8 0 5 15
Table 1 is a summary of the information about the participants in our study. We gathered 20 subjects to participate in the study. The subjects were a mixture of undergraduate (2) and graduate students (18) in computer science. These 20 participants were classified into one of the three available levels: expert, intermediate and advanced. We then created three groups, each of which had an equal number of experts, intermediates, and basics. For the comprehension (quantitative) part of the study we considered only six of the basic level subjects (to make each group even). The study was administered in two forms so that we could accommodate as many participants as possible. Eleven out of the twenty participants were required to meet in an instructional lab at a specific time. We considered this to be the controlled part of the experiment. The other nine participated in the study at their own convenience and not in a lab setting. We conducted the study on Hippodraw [7], an open source data visualization and analysis library. The library can be used for building custom applications in either C++ or Python. It is written in C++ with nearly 200 classes and 50K LOC. Our study focused on the main class hierarchies in the HippoDraw system and their most important related classes. However, wherever possible we also showed associations, aggregation, composition, and dependency. The study dealt with approximately 50 classes from the system. To construct the diagrams we reverse engineered HippoDraw. The reverse engineering process only extracted generalizations accurately. Next, we drew the three types of layouts manually and also added associations and dependencies after inspection of the code. All of these diagrams were drawn manually using Microsoft Visio.
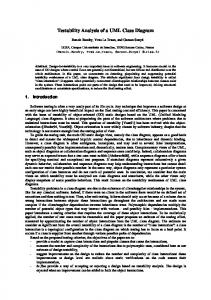
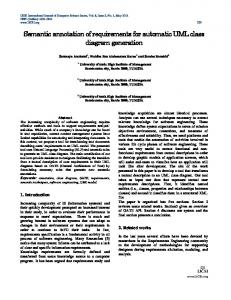
2.1. Class Diagram Layouts Used We split the participants into three groups each with equal number of experts, intermediates and basics so that we could have a fair comparison within each group. Each group was given one of the three layouts described below. All subjects were asked the same questions, however the layout of the class diagram shown with respect to each question was different across the three groups. Figure 1 and Figure 2 show one such example for classes related to the PlotterBase class. We used colors and text annotations to distinguish class stereotypes. Boundary classes were blue (white in the diagram), entities were green (dark gray), and control classes were red (light gray). The text annotations are shown above the class name. The first type of layout is termed as the baseline or industrial layout. This is a typical layout produced by a commercial tool such as Visio (not shown here due to space limitations). Layout style 1 shown in Figure 1 was drawn with multiple clustering in mind. Control classes along with their related entity and boundary classes that formed a cohesive cluster are grouped closer together. Layout style 2 was drawn so that all entity classes are in one cluster (closer together), all boundary classes are in another cluster and finally all control classes are the third cluster. This is called the three cluster layout (see Figure 2). The nature of this layout caused it to be wider than the other two layouts. It is important to note that sometimes it was not possible (or very difficult) to position each type of class in three separate clusters and
2 of 6
Andriyevska, Dragan, Simoes, Maletic
VISSOFT05 Submission
make visible only those methods that were needed. In all, we had five class diagrams each presented in one of the three types of layouts styles.
avoid large amounts of edge crossings. That is, we tried to maintain aesthetic criteria defined in the literature. For example, edge crossings were kept to a minimum and generalizations were drawn to point towards one direction as much as possible.
2.2. Comprehension/Quantitative Design We now describe the questions in the user study related to comprehension of the system. This part of the study was timed. There were nineteen questions each of which had a time limit attached. The time limits were set based on some preliminary experiments. Each question had a different time limit depending on its complexity. The participants were not allowed to go back to a previous question. We collected both the speed and accuracy of each participant’s response. This part of the study was subdivided into two sets of questions. In the first set of questions, the participants were asked to match the role of a particular class from a list of choices. Information about the role of the class was presented in the initial ten minute introduction. The second set of questions was related to maintenance. A scenario was presented along with a list of possible solutions. The participant was supposed to choose one of the listed solutions as their answer. We consider these to be refactoring related questions. Some of them dealt with adding a method, whereas others dealt with adding a feature. Both these types of questions were multiplechoice.
2.3. Preference/Qualitative Design Figure 1. Layout 1 - Multiple Clusters for PlotterBase Detailed View. Boundary in white, entity in dark gray, and control in light gray.
We also asked questions related to aesthetics of class diagram layouts. We asked questions regarding the participant’s familiarity with HippoDraw. We also presented all three layouts for class diagrams and asked them which one they liked best in terms of comprehension and aesthetics. We did this for two sets of diagrams. Another question was related to the use of the colors and text annotations. Each question had a comment box attached. The participants were free to add comments and elaborate on the choice they made and also give any suggestions that they thought would help. We also asked a question regarding the use of curved connectors for dependencies and associations. This part of the study did not have a time limit. However, we did record the amount of time a user spent answering each question.
Figure 2. Layout 2 (3 clusters) for PlotterBase Detailed View
2.4. Pilot Study Implementation Details We setup the pilot study online so that participants could access it from any location. We used the open source software system NSurvey (www.nsurvey.org) to conduct our web based user study. Since we wanted to time each question in the quantitative/comprehension
We decided to hide the method names of classes and only showed the attributes and their types. This was a decision we needed to make since the number of methods were sometime very large. An alternative would be to
3 of 6
Andriyevska, Dragan, Simoes, Maletic
VISSOFT05 Submission
the timeout associated with the question. Note however, that all the participants knew that the study was timed in advance but they did not know how much time each question was allotted in advance. The time for each question was shown on the same page that the question was on. Figure 3 and Figure 4 show the distribution of answers to eighteen questions at the expert and intermediate levels respectively. The distribution for the basic level is almost the same as that for the intermediate level and is not given for this reason. The multiple clusters layout is also referred to as Layout 1 and the three clusters layout is referred to as Layout 2. We compare the number of right answers across the three layouts for each level: expert, intermediate and basic. We see that the number of right answers is higher in the group with the multiple clusters layout than in any other layout. Additionally, we can see that the number of right answers is still always more than the number of wrong answers. Also, the number of blank answers is much less for the group with the multiple clusters layout. An answer is considered blank if it was left unanswered. This could be due to the fact that in Layout 2, the diagrams tended to fit more on the screen than in Layout 1 or Baseline. It is hard to reason about blank answers since they could fall into a right or wrong category. This trend for the number of blank answers is also seen at the basic level, although the chart is not shown here.
Percentage of right, wrong and blank answers
part of the study, we added a feature to the NSurvey system so that each question would have a time limit. This also involved making sure that the time is recorded for each question. Distribution of answers to 18 questions at the expert level 100%
75%
50%
25%
0% Industrial Layout
Layout using multiple Layout using 3 clusters clustering based on each containing B, C or E B/C/E stereotypes
right
wrong
blank
Distribution of answers to 18 questions at the intermediate level 100%
75%
50%
Distribution of subjects on the matter of colors and text annotations for stereotypes
25%
Number of subjects
Percentage of right, wrong and blank answers
Figure 3. Distribution of answers at the expert level across all 3 layouts
0% Industrial Layout
Layout using multiple Layout using 3 clusters clustering based on each containing B, C or B/C/E stereotypes E
right
wrong
blank
Figure 4. Distribution of answers at the intermediate level across all 3 layouts
9 8 7 6 5 4 3 2 1 0
Helped
3. Results and Analysis
Caused Problems Expert
Did not help Intermediate
Basic
Figure 5. Color and text annotation preference across participant levels
This section presents the results of the quantitative and qualitative parts of the pilot study. Each section discusses a category of results along with charts for clear understanding.
3.2. Preference for Color and Text Annotations We now present the participant’s preferences for color and text annotations. This question was part of the preference section of the experiment. Figure 5 shows the distribution of participant preferences. The goal of this question was to gauge whether colors and text annotations we used were important to point out architectural importance in terms of control, boundary, and entity classes. No experts found the colors or text annotations to cause any problems or interferences. Most
3.1. Distribution of all Answers The answers considered here are from the comprehension part of the experiment. We did not consider the first question because 50% of the participants failed to answer this question and left it blank. This was due to the fact that they timed out. We noticed this trend only for the first question. We believe that this was due to the participants lack of awareness of
4 of 6
Andriyevska, Dragan, Simoes, Maletic
VISSOFT05 Submission
of the experts said that the colors helped them in narrowing down the search space to one stereotype. The participants were also asked whether specific highlighting of the clusters in the multiple cluster layout was useful. All of the participants preferred to have multiple clusters grouped together in light shading.
3.4. Distribution for Refactoring Questions We asked a number of questions related to refactoring. The questions were maintenance related such as the addition of a method or feature to HippoDraw. Figure 8 presents the distribution of right, wrong, and blank answers for the seven refactoring questions. We observe that there are no blank answers recorded for the layout with three clusters. The number of right answers for the layout with three clusters combined with the layout with multiple clusters was higher than the baseline layout. We believe that this is a significant result and supports our hypothesis that clustering classes with respect to their architectural importance on stereotypes helps a user in understanding a system better than just an aesthetically pleasing UML class diagram as well as a typical industrial layout class diagram.
Comparing 3 class diagram layouts for comprehension Number of subjects
8 7 6 5 4 3 2 1 0 Industrial Layout
Layout using multiple clustering based on B/C/E stereotypes Expert
Layout using 3 clusters each containing B, C or E Intermediate
Basic
Number of subjects
8
Total number of questions
Figure 6. Comparison of three class diagram layouts for the purpose of system comprehension Comparing 3 class diagram layouts for preference
7 6 5 4 3
25
Distribution of answers for refactoring questions at the intermediate and expert levels
20 15 10 5 0 Industrial layout
2 1 0
Industrial Layout
Layout using multiple clustering based on B/C/E stereotypes Expert
Layout using multiple clustering based on B/C/E stereotypes
Layout using 3 clusters each containing B, C or E Intermediate
right
Layout using 3 clusters each containing B, C or E
wrong
blank
Figure 8. Results for seven refactoring questions at intermediate and expert levels
Basic
Figure 7. Comparison of three class diagram layouts for the purpose of aesthetic preference
Preference for curved connectors in aesthetics
3.3. Comparing Three Class Diagram Layouts
6 Number of subjects
The question to compare the three layout schemes was part of the preference section of the experiment. Figure 6 and Figure 7 show this comparison for comprehension and preference respectively. The goal of this question was to find participant preferences for a particular layout considering only comprehension or only preference. Considering only comprehension dealt with pure understanding of the system design. Considering only preference dealt purely with aesthetic criteria such as edge crossings or number of bends. This comparison was based on the exact layouts given in Figure 1 and Figure 2. We observe that there were more participants who preferred the three cluster layout (Figure 2), however more experts preferred the multiple cluster layout (Figure 1). There was only one expert who liked the industrial (baseline) layout for comprehension and preference.
5 4 3 2 1 0 Liked
Disliked
Don't care
Response
Expert
Intermediate
Basic
Figure 9. Number of participants who preferred curved connectors for dependencies and associations in aesthetics
4. Discussion & Conclusions We observe that clustered layouts were more helpful in comprehension and in particular the layout with
5 of 6
Andriyevska, Dragan, Simoes, Maletic
VISSOFT05 Submission
important to have an architecturally meaningful UML class diagram rather than an aesthetically pleasing one.
multiple clusters was most helpful to experts. We can conclude that clustered layouts (Layout 1 and 2) were more helpful in answering questions and in understanding the system. Both layout 1 and layout 2 were useful; however it was difficult to compare both these layouts because they did not fit the same way on the screen. Layout 2 was wider than Layout 1. The nature of layout 2 may have affected the results. The main result is that both clustered layouts were better than the baseline layout. Our observations show no preference for curved lines but participant comments indicated that curved lines quickly brought attention to the dependency relationship. All participants preferred cohesive regions enclosed within light shading. We tried to organize the experiment so that participants in the controlled and uncontrolled groups were exposed to the same environment conditions. For example, time restrictions were enforced so that participants could not resort to other means of getting information such as searching the web. The environment that the participants took the study also might have affected their performance. Some participants in the controlled lab experiment reported that if they were given the same study to do at their place of preference, (such as their office where they are most comfortable with the mouse and monitors) they may have performed better. The questions were multiple-choice however they were presented as a drop down list where a participant first had to click to see the list of choices. This caused problems for some users during the study. Having the answers as a list of radio buttons where all are visible at the same time would solve this problem. Many participants requested that they be made aware of the amount of time left before they timed out on a particular question. This was not implemented as part of the study. This is certainly an important thing to have. If a user was aware of the time in the form of a 10 second countdown for example, they would probably choose the best possible answer they thought of at that time. Another thing pointed out by one expert was about the use of only attributes in the class diagram. The expert stated that it would be much more helpful to have certain methods shown with respect to the question asked instead of having attributes, since methods represent the contract between associated classes and not member variables. Member variables are usually just implementation details. This needs to be considered in our future user studies. A few participants noted that they used the knowledge gained from previous questions to answer questions later on. The ultimate goal is to develop guidelines towards a new layout scheme for UML class diagrams with respect to architectural importance. We feel that it is more
5. References [1] Booch, G., Jacobson, I., and Rumbaugh, J., The Unified Software Development Process, Addison-Wesley, 1999. [2] Eichelberger, H., "Aesthetics of Class Diagrams", in Proceedings of 1st International Workshop on Visualizing Software for Understanding and Analysis (VISSOFT), Washington, DC, USA, 2002, pp. 23 - 31. [3] Eichelberger, H., "Nice Class Diagrams Admit Good Design?" in Proceedings of SOFTVIS 2003, 2003, pp. 159-167. [4] Eiglsperger, M., Kaufmann, M., and Siebenhaller, M., "A Topology-Shape-Metrics Approach for the Automatic Layout of UML Class Diagram", in Proceedings of SoftVis, San Diego, CA, USA, 2003, pp. 189-198. [5] Gutwenger, C., Jünger, M., Klein, K., Kupke, J., Leipert, S., and Mutzel, P., "Caesar Automatic Layout of UML Class Diagrams", in Proc. of Graph Drawing, 2001, pp. 461-462. [6] Gutwenger, C., Jünger, M., Klein, K., Kupke, J., Leipert, S., and Mutzel, P., "A New Approach for Visualizing UML Class Diagrams", in Proceedings of SoftVis, 2003, pp. 179-188. [7] HippoDraw, Date Accessed: 03/10, www.slac.stanford.edu/grp/ek/hippodraw/index.html, 2004. [8] Musial, B. and Jacobs, T., "Application of focus + context to UML ", in Proceedings of the Australian symposium on Information visualisation - Volume 24 Adelaide, Australia Australian Computer Society, Inc., 2003 pp. 75-80 [9] Purchase, C. H., Allder, J.-A., and Carrington, D., "Graph Layout Aesthetics in UML Diagrams: User Preferences", Journal of Graph Algorithms and Applications, vol. 6, no. 3, 2002, pp. 255-279. [10] Purchase, C. H., Colpoys, L., McGill, M., Carrington, D., and Britton, C., "UML Class Diagram Syntax: An Empirical Study of Comprehension", in Proceedings of Australian Symposium on Information Visualisation, Syndney, 2001. [11] Purchase, C. H., McGill, M., Colpoys, L., and Carrington, D., "Graph Drawing Aesthetics and the Comprehension of UML Class Diagrams: An Empirical Study", in Proceedings of Australian Symposium on Information Visualisation, Sydney, Australia, December 2001. [12] Sun, D. and Wong, K., "On Evaluating the Layout of UML Class Diagrams for Program Comprehension", in Proceedings of 13th IEEE International Workshop on Program Comprehension, St. Louis, Missouri, USA, 2005, pp. 317-328. [13] Ware, C., Purchase, H., Colpoys, L., and McGill, M., "Cognitive measurements of graph aesthetics", Information Visualization, vol. 1, no. 2, 2002, pp. 103-110.
6 of 6