Linda Colpoys. *. , Matthew McGill. *. , David Carrington ..... Reading, Mass, Addison Wesley Longman Inc. GREEN, T. and PETRE, M. (1996): Usability analysis ...
UML class diagram syntax: an empirical study of comprehension Helen C. Purchase*, Linda Colpoys*, Matthew McGill*, David Carrington* and Carol Britton† *
School of Information Technology and Electrical Engineering University of Queensland St Lucia, Brisbane 4072, Queensland † Faculty of Engineering and Information Sciences University of Hertfordshire Hatfield, England {hcp, davec}@itee.uq.edu.au
Abstract Despite UML being considered a software engineering standard, the UML syntactic notations used in texts, papers, documentation and CASE tools are often different. The decision as to which of the semantically equivalent notational variations to use appears to be according to the personal preference of the author or publisher, rather than based on any consideration of the ease with which the notation can be understood by human readers. This paper reports on an experiment that takes a human comprehension perspective on UML class diagram notational variants. Five notations were considered: for each, two semantically equivalent, yet syntactically different, variations were chosen from published texts. Our experiment required subjects to indicate whether a supplied specification matched each of a set of experimental diagrams. The results reveal that the best performing notation may depend on the task for which it is used, and that our personal, intuitive predictions intuitions (which were based in the complexity of the notation) were partly confirmed. ! Keywords: UML class diagrams, notation, human performance.
1
Introduction
In recent years, the Unified Modelling Language (UML) has emerged as the defacto standard for the representation of software engineering diagrams (Rumbaugh et al. 1999). While adopted as a standard by the membership of the OMG (Object Management Group) in 1997 (Rumbaugh et al. 1999), a glance through different texts that use UML, or an investigation of current CASE tools, reveals a number of notational variations (Page-Jones 2000, Fowler et al. 2000, Evitts 2000, Rational Rose 2001). As a standard, UML is still evolving, and within each version of the standard are many semantically equivalent notational variations from which authors or publishers may choose, according to their personal preference. There seems to be no basis for the choice of one notational variation over another. It may be that one notational variation is easier to comprehend than another. The research reported in this paper attempts to determine whether there are any comprehension differences between five different
Copyright © 2001, Australian Computer Society, Inc. This paper appeared at the Australian Symposium on Information Visualisation, Sydney, December 2001. Conferences in Research and Practice in Information Technology, Vol. 9. Peter Eades and Tim Pattison, Eds. Reproduction for academic, notfor profit purposes permitted provided this text is included.
notational variations for UML class diagrams, through an empirical study of subjects' performance on a specification matching task. The notational variants may be equally as good as each other, in which case, it does not matter which one is used. But, if there are comprehension differences, the results of this study could assist in the definition of appropriate notational standards (from a human understanding point of view), and in determining the most suitable notation to use in UML texts, CASE tools, and practical software engineering tasks. Some theoretical analytical work has been performed on software engineering notations and visual programming languages, but no empirical studies on human comprehension of these notations have been found. While software engineering notations (including UML) have been analysed and compared using the Cognitive Dimensions framework (Green and Petre 1996, Blackwell and Green 2000) this framework is theoretical, and these analyses, while providing interesting structured perspectives on the notational features, are not based on experimental data (Kutar et al. 2000, Cox 2000, Gurr and Stevens 1999, Gurr and Tourlas 2000). The experiment reported here complements such analytical work.
1.1
Experimental aim and definitions
Our previous study (Purchase, Allder and Carrington 2000) considered user preferences for some UML notations and layout features. The experiment reported here concentrates on user performance, rather than preference. The aim of this experiment was to determine which variant of each of five notations used in UML class diagrams is the more suitable with respect to human performance. By asking subjects to perform comprehension tasks on a number of semantically equivalent UML class diagrams that vary with respect to the notations used, we aimed to identify the notational variants that resulted in the best performance.
Notational Difference
Variation (a)
Variation (b)
(Page-Jones 2000)
(Purchase, Allder & Carrington. 2000)
(Page-Jones 2000)
(Rumbaugh et al. 1999)
Inheritance direction (N1)
Inheritance arcs (N2)
Association
Dog Dog Ownership Ownership
representation (N3) Dog Ownership Dog Ownership Person Person Dog
Dog Person Person
(Evitts 2000)
Dog Dog
(Evitts 2000)
Association names (N4)
Person
Person
Dog Ownership Dog Ownership
Dog Ownership
Dog
Dog
(Evitts 2000) Cardinalities (N5)
Person
Person
Dog Ownership
Dog
Dog
(Gurr and Stevens 1999, Rational Rose)
1
1
1 1..*
*
(Rumbaugh et al. 1999)
*
(Page-Jones, 2000)
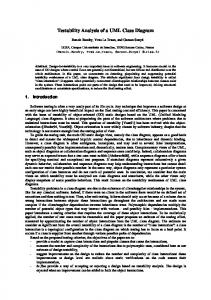
Figure 1: The five notational variations.
1.2
inherited by other classes (the "subclasses"), without needing to be explicitly represented in the subclasses themselves.
UML class diagrams Subject
Student
enrolled in
-code : String
-name : String 1..*
Honours Project
works on
-title : String 1
1..*
Honours Student
Pass Student
-reasearch area : String
-project : String
Figure 2 is an example of a small UML class diagram, showing the relationships between the classes in a simple university domain, including inheritance relationships between the student, pass student, and honours student classes.
1
1.3 Figure 2: An example class diagram. UML class diagrams are used to describe the static view of an application (Rumbaugh et al. 1999): the main constituents are classes and their relationships. A class is a description of a concept, and may have attributes and operations associated with it. Classes are represented as rectangles. A relationship between two classes is drawn as a line. Inheritance relationships indicate that attributes and operations of one class (the "superclass") are
Notational variations
Five independent notational variations for UML class diagrams were considered (see Figure 1): each notation (N1, N2, N3, N4, N5) has two variations (a) and (b), with identical semantics. All notational variations had been found in published documents on UML, or existing CASE tools, except N1(b), which was used in a prior experiment which considered user preference on notational variations (Purchase et al. 2000).
Project
1
1
organises
1..*
Schedule -meetings : String
-title : String 1..* 1..*
works on Staff subcontracts
manages
-name : String 1..*
1 Client -name : String 1..*
consults 1 1..*
Consultant
Programmer
-specialty : String
-languages : String
Administrator -title : String
1 produces
1..* Senior Programmer
Junior Programmer
Report -title : String
Figure 3: The application domain for the experiment. Our informal predictions, based purely on our personal intuition and experience, were that, in each case, the (a) notation would produce better performance.
2
Experimental task:
The comprehension task was that of matching a given textual specification against a set of diagrams, indicating whether each diagram correctly matches the specification or not. The set of diagrams included both correct and incorrect diagrams.
2.1 2.1.1
Experimental materials: The application domain
The class diagram used was based on a simple domain, which models a small Information Technology company that employs consultants, programmers and administrative staff to undertake projects for clients. The example includes 10 objects, 6 associations and 5 inheritance relations (see Figure 3). A textual specification of this domain was produced in simple English. The subjects were asked to match the experimental diagrams against this specification.
2.1.2
were to perform, by presenting a small specification with four different diagrams, and for each diagram indicating whether it matched the given specification or not. Care was taken to ensure that neither the tutorial nor the worked example would bias the subjects towards one notational variation over another.
2.2
The experimental diagrams
The UML diagram representing the experimental domain was drawn four times, in four differing layouts. Each layout was constructed with a view to minimising the potential for any confounding layout factors. Thus, each layout had a similar number of edge bends and sloping lines, no edge crosses, comparable orthogonality (the property of fixing nodes and edges to the intersections and lines of an invisible unit grid), and was of a similar size. Different layouts were required so that the subjects would not merely use visual pattern matching in performing the comprehension tasks: if all the diagrams had identical layout, the differences between them would be visually obvious and detectable without the subject needing to understand the information embodied in the diagram. Using these four layouts of the diagram, the following experimental diagrams were produced:
UML tutorial and worked example
A tutorial sheet explained the meaning of UML class diagrams, and, using a simple example, described the semantics of all the notational variations. Subjects were not expected to have any prior knowledge of UML, and this tutorial provided all the UML background information they required for the experimental task. A worked example demonstrated the task that the subjects
2.2.1
Correct diagrams (24)
• 1 diagram using all the (a) notations, in four different layouts (N0t) • 1 diagram using the (b) notation for N1, (a) notation otherwise, in four different layouts (N1t)
• 1 diagram using the (b) notation for N2, (a) notation otherwise, in four different layouts (N2t)
2.3
• 1 diagram using the (b) notation for N3, (a) notation otherwise, in four different layouts (N3t)
2.3.1
• 1 diagram using the (b) notation for N4, (a) notation otherwise, in four different layouts (N4t) • 1 diagram using the (b) notation for N5, (a) notation otherwise, in four different layouts (N5t) The naming convention of these diagrams is that the number (0-5) indicates which notation is being varied (where 0 represents that none of the notations is varied, that is, the (a) notation is used throughout), and the letter (t) indicates that these are true (correct) diagrams.
2.2.2
Incorrect diagrams (20)
• For N1: For two of the layouts of N0t, errors were introduced which affected the representation of inheritance (N0d1). For the same two layouts of N1t, the same errors were introduced (N1d). The error introduced was that a superclass was exchanged for a subclass. • For N2: For two of the layouts of N0t, errors were introduced which affected the representation of inheritance (N0d2). For the same two layouts of N2t, the same errors were introduced (N2d). The error introduced was that one of the associations in the diagram was changed to be an inheritance relationship. • For N3: For two of the layouts of N0t, errors were introduced which affected the representation of associations (N0d3). For the same two layouts of N3t, the same errors were introduced (N3d). The error introduced was that two of the association names were exchanged. • For N4: For two of the layouts of N0t, errors were introduced which affected the representation of associations (N0d4). For the same two layouts of N4t, the same errors were introduced (N4d). The error introduced was that two of the association names were exchanged. • For N5: For two of the layouts of N0t errors were introduced which affected the representation of cardinality (N0d5). For the same two layouts of N5t, the same errors were introduced (N5d). The error introduced was that all cardinalities on all associations were reversed. The naming convention of these diagrams is that the letter (d) indicates that these are “dummy” (incorrect) diagrams. Diagrams beginning with N0 are those that use the (a) variation throughout, with the final number (1-5) indicating to which notation the diagram alteration relates. The other diagrams (N1-N5) indicate which notation has been varied to use (b) instead of (a).
Experimental procedure Preparation
The students were given preparatory materials to read as an introduction to the experiment. These documents consisted of a consent form, an instruction sheet, a tutorial on UML class diagrams and notation, and a worked example of the experimental task. As part of this document set, the subjects were also given the textual specification of the UML case study to be used in the experiment: this was the specification that they would need to match the experimental diagrams against. The subjects were asked to study this specification closely, and memorise it if possible, The subjects were given 15 minutes to sign the consent form, read through and understand the materials, ask questions, take notes, or draw diagrams as necessary.
2.3.2
Online task
The subjects then used an online system to perform the experimental task. A copy of the text specification was placed in front of the computer for easy reference, and UML diagrams were presented in random order for each subject. The subjects gave a yes/no response to each presented diagram, indicating whether they thought the diagram matched the specification or not: two keys on the keyboard were used for this input. 16 practice diagrams (randomly selected from the 44 experimental diagrams) were presented first. The data from these diagrams was not collected, and the subjects were not aware that these diagrams were not part of the experiment. These diagrams gave the subjects an opportunity to practice the task before experimental data was collected. The 44 experimental diagrams were then presented in a different random order for each subject, in blocks of eight, with a rest break between each block (the length of which was controlled by the subject). The final block was four diagrams in length. Each diagram was displayed until the subject answered Y or N, or 40 seconds had passed. A beep indicated to the subject when the next diagram was displayed after a timeout (which was recorded as an error). The practice diagrams helped the subjects get used to the length of the allocated time period. The timeout period and the time needed for the subjects to prepare for the experiment were determined as appropriate through extensive pilot tests. A within-subjects analysis was used to reduce any variability that may have been attributed to differences between subjects: thus, each subject's performance on one notation was compared with his or her own performance on the alternative notation. The practice diagrams and the randomisation of the order of presentation of the experimental diagrams for each subject helped counter the learning effect (whereby the subjects' performance on the task may improve over time, as they become more competent in the task).
2.3.3
3.1.2
Data collection
The response time and accuracy of the subjects' responses to the 44 experimental diagrams were recorded by the online system.
The experiment was performed using 34 novice subjects and 5 expert subjects. The novice subjects were second and third year Computer Science and Information Systems students at the University of Queensland. The novice subjects were paid $15 for their time, and, as an incentive for them to take the experiment seriously, the best performer was given a CD voucher. The expert subjects were employees of the Distributed Systems Technology Centre, Brisbane, who volunteered their time.
3
Results
Both the speed and accuracy of each subject's responses were measured, enabling the analysis of two different measures of understanding. Analysis was performed on both the subjects' performance in identifying the correct diagrams and their performance in identifying the incorrect diagrams.
3.1
(a) (b)
10 5 0 1
2
3
4
5
Notation Notational Accuracy 100 80 60
(a) (b)
40 20 0 1
2
3
4
5
Notation
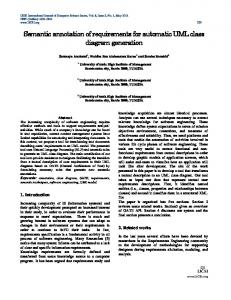
Figure 5: The response time and accuracy results novice users on incorrect diagrams.
o for matching the specification to correct diagrams: (a) is better than (b) (p < 0.05)
Average Times 25
Time (sec)
15
ÿ Notation 1: accuracy
Identifying the correct diagrams:
o for identifying an error in the diagrams: (b) is better than (a) (p < 0.05)
20 15
(a) (b)
10
ÿ Notation 1: time
5
o for identifying an error in the diagrams: (b) is better than (a) (p < 0.05)
0 1
2
3
4
5
ÿ Notation 2: accuracy
Notation
o for identifying an error in the diagrams: (b) is better than (a) (p < 0.05)
Notational Accuracy 100
Accuracy (%)
20
Using a two-tailed t-test, the statistically significant results are:
Novice Experiment:
3.1.1
25
Time (sec)
Subjects
Average Times
Accuracy (%)
2.4
Identifying the incorrect diagrams:
ÿ Notation 3: accuracy
80 60
(a) (b)
40 20
o for identifying an error in the diagrams: (b) is better than (a) (p < 0.05) ÿ Notation 4: time
0 1
2
3
4
5
Notation
o for identifying an error in the diagrams: (a) is better than (b) (p = 0.058, approaching significance) ÿ Notation 5: accuracy
Figure 4: The response time and accuracy results novice users on correct diagrams.
o for matching the specification to correct diagrams: (a) is better than (b) (p < 0.05) ÿ Notation 5: time o for matching the specification to correct diagrams: (b) is better than (a) (p < 0.05)
3.2
Expert Experiment:
Five expert UML users performed the experiment; while both response time and accuracy were recorded, the small sample size meant that statistical analysis is impossible. However, we asked the five expert UML users to state, and explain, their preferences for the different notational variations.
3.2.1
Notation 1
Pointing the inheritance arrows upwards (variation (a)) was preferred by all the respondents, with the main reason being that it appears more natural to have the superclass (the more general object) above the subclass (the less general object) than to have the inheritance pointing downwards (variation (b)). The respondents revealed their assumptions underlying this view: that most people would read from top-to-bottom, and that it is important to identify the superclasses before the subclasses.
3.2.2
Notation 2
Four out of five respondents preferred the notation of joined inheritance lines (variation (a)) over the use of separate lines for each subclass (variation (b)).1 The two main reasons for this choice was firstly that the joined inheritance notation demonstrates that the subclasses are on the same level of specialisation, and secondly, that in larger diagrams with more inheritance relationships, there is a potential for the diagram to "sprawl" and to look less "neat." The participant who preferred the (b) variation did so because "the diagonals require me to concentrate more when deciphering meaning."
3.2.3
Notation 3
All respondents preferred the (a) variation, where the name of each association is placed beside the line in the diagram, rather than in a separate association class linked to the line. The justifications of this choice related to the reduction of "clutter" ("(b) is too busy"), as well as the importance of making a clear visual distinction between objects and associations. One respondent pointed out that association classes are really only useful when there is additional information that needs to be recorded about the association: this was not the case in our small case study.
3.2.4
Notation 4
All respondents agreed that placing the label beside the line (variation (a)) is preferable to placing it over the line (variation (b)), for reasons of neatness and clarity ("(a) is more readable"). One respondent qualified his response by saying that if there were many more associations in the
1
This result concurs with a result obtained as part of a previous study on user preferences of UML notation and layout (Purchase, Allder and Carrington 2000), when 76% of 70 subjects preferred notation (a) over notation (b): a two-tailed t-test significance of p