virtual sensor replacing the faulty sensor measurement with the best estimate. ... utilization of neural networks for sensor calibration monitoring will increase ...
Sensor Validation and Fault Detection Using Neural Networks Xiao Xu, J. Wesley Hines, Robert E. Uhrig Maintenance and Reliability Center The University of Tennessee Knoxville, TN 37996-2300 Phone: (423) 974-6561
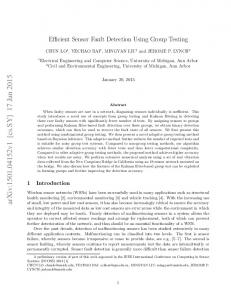
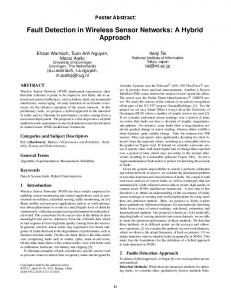
ABSTRACT In the power generation industry, periodic sensor calibrations are required to assure sensors are operating correctly. Out-of-calibration sensors can lead to mis-control of electric power output, possibly causing a loss in revenue or damage to equipment. Continuous sensor calibration monitoring is desirable to assure correct power generation and reduce maintenance costs associated with performing unnecessary manual sensor calibrations. An artificial neural network-based sensor calibration monitoring system can provide continuous sensor status information and virtual estimates for faulty sensors. This paper describes the design of an autoassociative neural network (AANN) based sensor validation and fault detection system for a power generation system. INTRODUCTION It is difficult to detect small drifts in sensor instrumentation in complex control systems such as nuclear power plants, fossil fired power plants, and chemical or petroleum processing facilities. These sensor drifts can cause incorrect control actions and decrease system efficiency. Currently, sensors are manually calibrated on a periodic basis assure proper operation. This method requires all sensors to be calibrated, regardless of their condition, leading to possible equipment damage and incorrect calibration due to adjustments made under non-service conditions. With economic factors becoming more important, condition-based maintenance strategies are desired. These strategies require that instruments be manually recalibrated only when their performance is degraded beyond a specific tolerance. Continuous verification of the instrument’s calibration will reduce unnecessary sensor calibrations and provide higher fidelity sensor measurements. Elimination of unnecessary maintenance results in reduced equipment damage and increased plant efficiency. A well-trained neural network is capable of continuously providing the best unfaulted estimate of the measurement, and when the sensor becomes faulty, it acts as a virtual sensor replacing the faulty sensor measurement with the best estimate. Therefore, the utilization of neural networks for sensor calibration monitoring will increase plant reliability, aid in scheduling maintenance, and reduce unnecessary maintenance. FOSSIL POWER SYSTEM Figure 1 is a block diagram of a fossil power generation system. Hundreds of sensors, which measure flows, temperatures, pressures and levels, must operate properly to ensure efficient and safe operation. Any anomalies in the sensors need to be detected. A neural network based sensor validation and fault detection system can fulfill this need. In this paper, a group of 21 signals from a fossil power plant is monitored.
Figure 1. Fossil power generation system
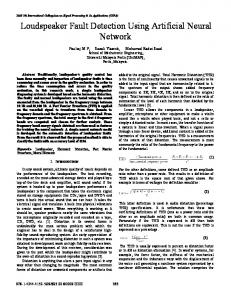
SIGNAL ESTIMATION AND FAULT DETECTION The use of AANNs for plant wide monitoring has been widely reported in the nuclear industry [B. R. Upadhyaya and E. Eryurek, 1992, R. E. Uhrig, et al, 1996, Nabeshima, et al, 1995]. Similar work using ANNs applied to chemical process systems have also been reported [Dong and McAvoy, 1994, Kramer, 1992]. In this study, an autoassociative neural network with these 21 signals as input is constructed for sensor validation and fault detection purposes. Sensor Monitoring In an autoassociative neural network, the outputs are trained to emulate the inputs over an appropriate dynamic range. Many plant variables that have some degree of coherence with each other constitute the inputs. During training, the interrelationships among the variables are embedded in the neural network connection weights. A robust training procedure is used to force the network to rely on redundant information from correlated sensors to estimate that specific sensor’s value. As a result, any specific network output shows virtually no change when the corresponding input has been distorted by noise, faulty data, or missing data. This characteristic allows the AANN to detect sensor drifts or failures by comparing sensor measurements (network inputs) with the corresponding network estimates of the sensor values (network outputs). Because of the correlated information input to the network, ill-conditioning problems will arise. This problem can cause poor network performance and non-unique solutions. Under such circumstances, the estimation of the signals from the network may be unreliable. To deal with these ill-conditioning problems, a network regularization method is applied during network training. The regularized training routine makes the problem better conditioned and tends to stabilize network performance. Figure 2 shows a sensor monitoring module for a group of two sensors whose measurements are correlated to some degree. When a sensor's signal to the autoassociative network is faulty due to a drift failure, the network still gives a valid estimate of the sensor value due to its use of information from other correlated sensors. The difference or residual ( rn ) between the sensor estimate ( xˆn ) and the actual measurement ( x n ) normally has a zero mean and a variance related to the amount of noise in the sensor's signal. When a sensor is faulty, the mean or variance of its associated residual
deviates from normal values and the deviations or drifts can be detected by a fault detection module which is detailed in the next section.
x1 x2
xˆ1 AANN Model
xˆ2 -
Σ
Σ
r1 + r2
Fault Detection
Fault H ypothesis
+
Figure 2. Sensor monitoring module
Fault Detection The fault detection module implements a statistical decision algorithm: the sequential probability ratio test (SPRT) which was initially developed by Wald [1945], later used by Upadhyaya [1987, 1989], and more recently by Gross and Singer [Gross 1991, and several others]. This module processes the residuals rn and outputs the condition of the sensor. An output value of zero indicates the sensor is normal, while a value of one indicates the sensor is faulty. Rather than computing a new mean and variance at each sampling time, the SPRT continuously monitors the sensor's performance by processing the residuals at each sampling time to compute a likelihood of failure. This SPRT-based method is optimal in the sense that a minimum number of samples are required to detect a fault existing in the sensor or instrument chain. Faulty Sensor Correction The fault detection module continues monitoring a sensor output even after it has been determined to be faulty. While the sensor is faulty, the best estimate of the sensor value given by the neural network can be used for automatic or manual control, for display to plant operators, or for other critical tasks. Therefore, the plant could continue operating without interruption even with drifting or failed sensors. This estimate also replaces the faulty sensor measurement for input to the network so that the monitoring of other sensors is not degraded. The sensor output is substituted back into the network when the fault has been corrected. This method always gives the operator or control system access to the best estimate of the signal whether it is the unfaulted measured value or the estimated value. This module operates as a virtual sensor that provides the best estimate of the measurement, avoiding possible wrong decisions made by using faulty sensor measurements. System Adaptation The neural network learns the interrelationships among the sensor measurements during training. Although the training set should include samples from all plant operating regions, sometimes the operating state may change to one that was not included in the training set. This can be caused by component wear, cyclical changes, or changes in the plant configuration, among others. These changes would be characterized by several residuals deviating significantly from their normal mean of zero. When this happens, the output of the AANN is not reliable and the network must be retrained to operate under the new conditions. If only one residual deviates from zero, a sensor fault is hypothesized. Although a multi-layer network with at least one non-linear hidden layer is able to model any linear or non-linear processes [Cybenko 1989, Hornick 1989, Funahashi 1989], a three hidden layer neural network (sometimes referred to as a five layer network) has several advantages as an autoassociative neural network for sensor monitoring [Kramer 1992]. The hidden layers act as feature extractors and the linear output layer combines these features to provide a desired mapping.
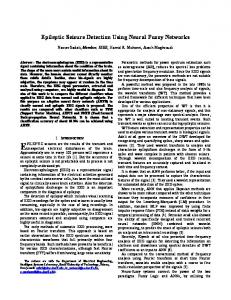
If the features do not change when a plant or process operating condition changes, only the output layer weights need to be adjusted to perform the desired mapping. This assumption holds for fairly small changes in operating conditions. Retraining the entire network may be necessary for major changes in plant operating conditions when adjusting the output weights does not result in satisfactory performance. Because of the linear output layer, adjustments of the output layer weights can be achieved by using a least-squares regression procedure. Several methods of solving for the linear output weights exist including pseudo-inverse methods and the LU or QR decompositions. In this study, it was found that a better method uses a truncated singular value decomposition (TSVD) technique that uses the most relevant information to compute the weight and discards unimportant information due to noise to avoid network overfitting. This help alleviate regression instabilities caused by collinearity. RESULTS This section presents the results of this sensor validation system performance when sensors are corrupted with artificially induced drifts in individual signals. The signal monitoring and fault detection modules work together to determine the sensor status, while the faulty sensor correction module provides correct inputs to the network, and the system adaptation module adapts the network to new operating conditions. Drift Detection A drift error is defined as a slow rate of change in a signal's output value not correlated with changes in the physical parameter. To test the performance of the validation system, both positive and negative drift faults are artificially induced in each of the signals. These exhaustive tests are necessary to determine if the network can detect sensor drifts. In order to perform this testing, data that was not used for training is used to test the network. Results for a 2% per day ramp drift introduced in two of the signals are presented in Figures 3a and 3b. The top plots show the measured signal (mea) and the system estimate (est), while the bottom plots show the residual between the measured and estimated sensor value.
measurement/estimate
Average Error Level = 4.372596 % 1400 1200 1000 800 600 400
mea est 0
1000
2000
0
1000
2000
3000
4000
5000
6000
7000
8000
3000 4000 5000 6000 data sampled in every minute
7000
8000
100
residual
50 0 -50 -100 -150
Figure 3a. Signal estimate with 2% per day drift on Measured Steam Flow (Klb/hr)
measurement/estimate
A verage Error Level = 4.215076 % 2000 1900 1800 1700 1600
mea est 0
1000
2000
0
1000
2000
3000
4000
5000
6000
7000
8000
3000 4000 5000 6000 data sampled in every minute
7000
8000
50
residual
0 -50 -100 -150 -200
Figure 3b. Signal estimate with 2% per day drift on Selected Drum Pressure (PSIG)
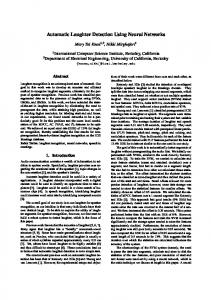
These figures show that although a the signal is drifting, the network's estimates of the signals are not influenced by the drifts and remain at the fault free level. The residuals between the measured and estimated signals are significantly different from zero; and therefore, the sensor drift would be detected by the statistical decision logic. The results indicate that this sensor validation and fault detection system is able to detect drifts ranging from 0.26% to 4.16% of the mean operation level depending on the specific sensor. The average detectable drift level for all 21 signals is 1.4%. Model Changes and Adaptation Neural networks are not guaranteed to function as expected when operating outside the training region. Although they have good generalization abilities inside the training space, they must be retrained when expected to operate in new regions. In this study, an example is presented to demonstrate the network's operation under process operating condition changes. To simulate the process condition change, a network is trained with a set of data from one operating condition and tested with a set of data from a different operating condition. Figure 4 shows the training and test data for the selected drum pressure signal. It indicates that the training data (first 500 samples) does not cover the entire dynamic range of the test data (last 500 samples) which includes an operating region at a lower power level. Specifically, the pressure at time stamp 537 has the lowest value of 1866 psig which is outside of the training range that has a lowest value of 1885 psig. The network trained in the first region is not expected to generalize well on the portion of the second region that is outside of the network training region. 1950 1940 1930
measurement
1920 1910 1900 1890 1880 1870 1860
training data test data 0
200
400
600 800 sampling time (min)
1000
1200
Figure 4. Network training and test data of Selected Drum Pressure (PSIG)
The network generalization results for two signals, plotted in Figures 5a and 5b, indicate that the network fits the training data well but generalizes poorly on the data that is outside of the training range. This implies that the network needs to be retrained with data from the new operation condition. measurement/estimate
Average Error Level = 1.632771 % 1300 1200 1100 1000 mea est
900 800
0
200
400
600
800
1000
1200
0
200
400 600 800 data sampled in every minute
1000
1200
residual
100
0
-100
-200
Figure 5a. Non-retuned network generalization of Measured Steam Flow (Klb/hr)
measurement/estimate
Average Error Level = 0.235685 % 1960 mea est
1940 1920 1900 1880 1860
0
200
400
600
800
1000
1200
0
200
400 600 800 data sampled in every minute
1000
1200
20
residual
10 0 -10 -20 -30
Figure 5b. Non-retuned network generalization of Selected Drum Pressure (PSIG)
When the operating condition changes slightly, complete network retraining is unnecessary, a linear regression technique - Truncated Singular Value Decomposition (TSVD) is used to alter only the output layer. We call this network retuning. The TSVD algorithm is computationally fast and meets on-line adaptation requirements. Complete network retraining can not be used on-line because it is lengthy and because the optimization method could get trapped in a local minima. The data from the new operating condition, as well as the data from the previous operating conditions, are used to retune the network. By doing so, the network learns the inherent
correlations for all of the dynamic operation regions. The results plotted in Figures 6a and 6b were obtained by using the TSVD algorithm to retune the network to include second operating region. The network's estimation performance in the region between samples 500-600 has improved drastically. These results indicate the sensor validation system's good adaptation capability through network retuning.
Average Error Level = 1.027053 % measurement/estimate
1300 1200 1100 1000 900 800
mea est 0
200
400
600
800
1000
1200
residual
100
0
-100
-200
0
200
400 600 data sampled in every minute
800
1000
Figure 6a. Network adaptation in Measured Steam Flow (Klb/hr)
measurement/estimate
Average Error Level = 0.202745 % 1960 1940 1920 1900 1880 1860
mea est 0
200
400
600
800
1000
1200
20
residual
10 0 -10 -20 -30
0
200
400 600 data sampled in every minute
800
1000
Figure 6b. Network adaptation in Selected Drum Pressure (PSIG)
The correlations inherent in the neural network inputs leads to an ill-conditioning problem (Hadamard 1923) that can cause network performance degradation through increased noise levels or an instability of the sensor estimates (Hansen, P.C. 1989). Network regularization techniques such as the truncated singular value decomposition (TSVD) method can be utilized to correct these problems (Hines 1999). These techniques force the model to depend on all of the input information
equally and reject perturbations due to signal noise. These techniques also result in sensor estimates that have less noise than their corresponding measured signals. CONCLUSIONS The neural network based sensor validation and fault detection system is able to monitor sensors for drift and abrupt failure. The signal estimates are compared to measured signals and the residuals are used to detect sensor faults. The results of this research show that this system can detect sensor drifts at an average level of 1.4% of the sensor's mean operational level. When operating conditions change, the network must be retrained or retuned to adapt to the new conditions. The employment of the TSVD technique allows the network to adapt itself to the changing operational conditions without retraining the entire network. This feature allows continuous on-line monitoring to be realized. ACKNOWLEDGEMENT This research was sponsored by through The Maintenance and Reliability Center at The University of Tennessee by the Tennessee Valley Authority (TVA) and Millenium Inorganic Chemical. REFERENCES Cybenko, G. (1989), "Approximation by Superpositions of a Sigmoidal Function", Mathematics of Control, Signals, and Systems, 2, pp. 303-314. Dong, D. and T. McAvoy (1994), “Sensor Data Analysis Using Autoassociative Neural Networks,” Proceedings of the World Congress on Neural Networks, San Diego, CA, Vol. 1, pp. 161-166. Funahashi, K. (1989), "On the Approximate Realization of Continuous Mappings by Neural Networks", Neural Networks, 2, pp. 183-192. Gross, K. S. and K. E. Humenik, (1991), "Sequential Probability Ratio Test for Nuclear Plant Component Surveillance", Nuclear Technology, Vol. 93, Feb. 1991, pp.131-137. Hadamard, J. (1923), Lectures on Cauchy's Problem in Linear Partial Differential Equations, Yale University Press, New Haven. Hansen, P.C. (1989), "Regularization, GSVD and Truncated GSVD", BIT 29, pp. 491-504. Hines, J. W., and R. E. Uhrig, (1998), "Use of Autoassociative Neural Networks for Signal Validation", Journal of Intelligent and Robotic Systems, Kluwer Academic Press, February, 1998, pp.143-154. Hines, J. Wesley, Andrei V. Gribok, Ibrahim Attieh, and Robert E. Uhrig (1999), "The Use of
Regularization in Inferential Measurements", Presented at the Enlarged Halden Programme Group (EHPG) Meeting, Loen, Norway, May 24-29. Hornick, K., Stinchcombe, M., and H. White (1989), Multilayer Feedforward Networks are Universal Approximators, Neural Networks, 2, pp. 359-366. Kramer, M. A., (1992), “Autoassociative Neural Networks,” Computers in Chemical Engineering, 16:(4), pp. 313-328. Kramer, M. A., (1991), “Nonlinear Principal Component Analysis Using Autoassociative Neural Networks,” AICHE Journal, Vol. 37, No. 2, pp. 233-243.
Masters, T., (1993), “Practical Neural Network Recipes in C++”, Academic Press, San Diego, CA. Nabeshima, K., K. Susuki, and T. Turkan (1995), “Real-Time Nuclear Power Plant Monitoring with Hybrid Artificial Intelligence Systems,” 9th Power Plant Dynamics, Control 7 Testing Symposium, Vol. 2, pp. 55.01, Univ. of Tennessee-Knoxville, May 24-26. Uhrig, R. E., J.W. Hines, C. Black, D. J. Wrest, and X. Xu (1996), “"Instrument Surveillance and Calibration Verification System", Report Prepared by the University of Tennessee for Sandia National Laboratories, Contract No. AQ-6982. Upadhyaya, B. R., F. P. Wolvaardt, and O. Glockler (1987), “An Integrated Approach for Sensor Failure Detection in Dynamic Systems,” Research Report prepared for the Measurement & Control Engineering Center, Report No. NE-MCEC-BRU-87-01. Upadhyaya, B. R. and K. E. Holbert (1989), "Development and Testing of an Integrated Signal Validation System for Nuclear Power Plants", Final Report prepared for the Department of Energy under contract number DE-AC02-86NE37959. Upadhyaya, B. R. and E. Eryurek (1992), “Application of Neural Networks for Sensor Validation and Plant Monitoring,” NUCLEAR TECHNOLOGY, Vol. 97, pp. 170-176. A. Wald (1945), “Sequential Tests of Statistical Hypothesis,” Ann. Math. Statist., Vol. 16, pp.117-186.