Performance Evaluation of Underwater Wireless Sensor Networks with OPNET Jesús Llor, Manuel P. Malumbres, Pablo Garrido Dept. of Physics and Computer Engineering Universidad Miguel Hernández Avenida de la Universidad S/N, Edificio Alcudia 03202, Elche (Alicante) Spain +34 96 665 83 93
[email protected],
[email protected],
[email protected] The most outstanding simulator tools used in terrestrial networks are Network Simulator 2 (ns2) [14] and OPNET [9]. In those simulators you can find protocol models that are currently used by mobile wireless networks as 802.11, UMTS/3G, Zigbee, etc. Underwater Wireless Sensor Networks (UWSN) are just arising in the world of simulators, so a lot of simulation tools are currently available. Most of them partially cover some aspects of the network architecture, being difficult to find a complete and reliable UWSN simulation tool.
ABSTRACT One of the main difficulties when modeling Underwater Wireless Sensor Network (UWSN) has to do with the environment characteristics and the acoustic signal typically used. As stated in other works, the accuracy of the acoustic propagation model and the network scenario conditions are critical to obtain reliable results. In this work we proposed a simulator framework for UWSN modeling. For that purpose we have considered the information provided by global databases (temperature, salinity, etc.) located within the network. Namely, the bathymetry and floor sediment, node depth, wave effect, and other factors may affect to the underwater signal propagation behavior. The propagation model is calculated using Bellhop ray tracing tool in order to get the closest representation to the real behavior of the acoustic signal propagation. All these tools are integrated in OPNET Modeler. Finally, we have run several experiments in different locations testing network performance with a simple MAC protocol.
Many of these simulators are based on terrestrial wireless network models reusing many elements from them, other simulators are dedicated to model underwater acoustic propagation and are available in different programming languages like python, fortran90, c/c++, etc. In this work we will gather several simulation proposals, analyzing their benefits and drawbacks in order to build a new complete and reliable simulation framework, that allows the design and performance evaluation of new underwater network protocols under a friendly user interface.
Categories and Subject Descriptors
In particular, we are especially motivated to define detailed models about the underwater environment (temperature, bathymetry, surface activity, etc.) and the acoustic signal behavior because the simulation results of particular network architecture should be as close as possible to the results that would be obtained in a real scenario under similar conditions. This is a great challenge, since the acoustic signal modeling in underwater scenarios is very complex and depends on many external factors like temperature, floor sediment composition, wave activity, environmental noise, etc. So, when evaluating MAC, routing or higher level protocols in a UWSN, the fact of using different underwater signal propagation models may seriously conditioning the final simulation results.
C.2.1 [Network Architecture and Design]; I.6.3 [Simulation and Modeling]: Simulation applications; I.6.5 [Simulation and Modeling]: Model Development.
General Terms Algorithms, Measurement, Performance, Design.
Keywords Underwater acoustics, Acoustic channel model, Wireless sensor networks, Network simulation, OPNET, MATLAB.
1. INTRODUCTION Terrestrial Wireless Sensor Networks (TWSN) have been developed in the last two decades. As a result of this research the physical layer has been modeled and a wide range of MAC protocols, routing protocols and applications have been worked out. But in order to make this possible, standardization and simulation tools are needed by the researchers and commercial companies to test and validate the algorithms before implementing them in real hardware prototypes.
The rest of paper is organized as follows: Section 2 gives an overview of related work introducing several simulator tools. Section 3 stands an overview of the simulator performance describing in detail the steps that have been followed to make an integrated simulation tool. Section 4 shows some simulation tests to validate the proposed tool. Section 5 presents analysis of some of the simulation results, and finally, in Section 6, conclusions and future works are commented.
Permission to make digital or hard copies of all or part of this work for Permission make digital hard copies of allfee or provided part of thisthat work for personal orto classroom use or is granted without copies personal or classroom use is granted without fee provided that copies arethat are not made or distributed for profit or commercial advantage and not made or distributed for profit or commercial advantage and that copies bear this notice and the full citation on the first page. To copy copies bear this notice and the full citation on the first page. To copy otherwise, to republish, to post on servers or to redistribute to lists, otherwise, or republish, to post on servers or to redistribute to lists, requires priorspecific specificpermission permission and/or a fee. requires prior and/or a fee. SIMUTOOLS March 21-25, Simutools’11,2011, March 21–25, 2011,Barcelona, Barcelona,Spain Spain. Copyright 2011 ICST1-58113-000-0/00/0010…$10.00. 978-1-936968-00-8 Copyright © 2011 ACM DOI 10.4108/icst.simutools.2011.238581
19
22. RELAT TED WORK K A Among the sim mulation tools suuitable for UW WSN, we have chosen tthree of the moost outstanding ones, with diffeerent approach levels aand source codee available. A AUVNetSim [44] is an example of a new sim mulator proposall, here tthe author usess python languaage to build an underwater wiireless nnetwork scenarrio. Highlights in i this simulatoor are the availaability oof the DACAP [10] MAC prootocol and the F Focus Beam Roouting ((FBR) [5] algoorithm that inccludes transmisssion power coontrol. H However, the physical layerr is too simplle, and so diffferent eenvironment coonditions cannott be properly moodeled. A Another simulaator proposed bby Xie and Giibson [16] defiines a ccomplex underrwater acousticc propagation m model based oon the M Monterrey Miaami Parabolic Equation (M MMPE), which it is iimplemented inn OPNET Moddeler and testedd with popular MAC pprotocols like Aloha and C CSMA. This siimulator standds out bbecause it desccribes the physsical layer at high h level of details, bbeing possible to define a scenario considering more eenvironmental parameters likee the effect of the waves andd node ddepth. The maain drawback oof this model iis that before doing nnetwork simulaations, several ppropagation moodel parameterss need tto be computedd, being this pprocess high tim me-consuming. Also, tthe model onlyy works on staatic scenarios w with static condditions aacross the simuulation period.
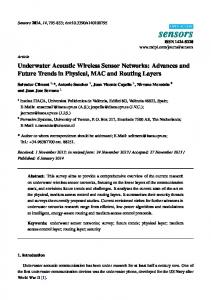
F Figure 1. Simullator Summaryy In Figure 1, we show the threee steps requiredd to complete the proocess: (a) obtainning data from global databasees, (b) creating the envvironment files, and (c) execuuting the Bellhoop ray tracing ttool to gget the results ffor the propagattion model.
T The World Oceean Simulator S System (WOSS S) [2][3] seems to be oone of latest annd most compleete simulator toools at the momeent. It iis implementedd in the ns2 sim mulator. It uses world databasees that m measure the Soound Speed Prrofile (SSP), bathymetry and floor ssediment compposition such ass the General Bathymetric B Chhart of tthe Oceans (G GEBCO) and N National Oceannic and Atmosppheric A Administration (NOAA). Com mbining this daata with the sceenario iinformation likke the latitude, llongitude and ddepth position oof the nnodes, it createss environmentaal files that describe the propertties of tthe scenario. In this work, authors havee validated Beellhop ppropagation moodel with real experimental datta obtained in w waters ssurrounding Pianosa Island (IItaly), showing that Bellhop model m rresults closely resemble the ones o measured in a real underrwater sscenario.
As a result of tthis process, thhe signal delayy and attenuattion bettween every paiir of nodes is knnown, allowing to OPNET to start witth the network simulation. Thiis process is desscribed in detail in thee next sections.
3.11 World D Databases Thhree main woorld databases will be usedd to model the envvironment filess and define inn detail the chaaracteristics of the sceenario where thee network is loccated.
Bathymetry [1]: Is proviided by the GEBCO. A file containing thhe world bathyymetry data in a global 30 aarcsecond grid released in January 2009 and updated in mation will be uused either for the November 20009. This inform bottom scenaario relief as weell as for the soound speed profile generation.
Seafloor Seddiment [8]: T The National G Geophysical D Data Center (NGD DC) from thee NOAA provvides a "Deck441" database thaat contains surrficial sedimentt descriptions for over 36,000 seafloor s samplees worldwide. M Mainly we have ten types of flooors in the oceaan: gravel, sandd, silt, clay, oooze, mud, rocks, organic, nodulees and hard-bottom. If no onee is available no--data value will be return.
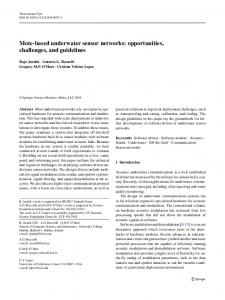
Sound Speedd Profile (SSP P) [15]: Providded by the Woorld Ocean Atlas (WOA) of NO OAA. Contains iinformation of the evolution of worldwide sounnd speed along the year. It cann be specified andd averaged oveer the year, thee season or, evven more detailed, by month. IIn Figure 2, wee can see averaage values of soound speed deppending on thee latitude and the season of thhe year. It can be appreciatedd that the greattest differences arre found in shalllow waters.
33. SIMULATOR PRO OPOSAL B Based on our pprevious work on OPNET [99] we will deveelop a ppropagation moodel suitable foor acoustic netw works which caapture tthe best of the currently availaable proposals. The main goall is to ccreate a simulattor framework able to work with w scenarios loocated aanywhere in tthe world. So,, the obtained results will bbe in aaccordance to the local enviironmental connditions and w will be ccloser to the onnes measured in the real world. O Our purpose iis to pick thee world inform mation from gglobal ddatabases and combine it wiith the OPNET T scenario desiign to pproduce a set of environmeental files. With this inform mation, O OPNET Modeller connects to MATLAB [7] through its inteerface ccalling to the B Bellhop ray traccing tool [11] ((propagation m model), ggiving as a reesult several fiiles including iinformation suuch as aamplitude, travel times, ray cooordinates and tthe acoustic preessure m map. With these files OPNET is able to perfoorm the simulatiion of tthe acoustic siggnal propagationn and determinne the set of pottential ddestination noddes that will be able to receivee the signal sentt by a ssingle source noode.
20
0
5
T Temperature (ºC) 10 15 220
25
30
0 200 LO OW LAT
400
M MID LAT SUMMER R 600 Depth (meters)
M MID LAT WINTER 800 HIGH LAT 1000 1200 1400 1600 1800
Figu ure 3. Environm ment file definiition 2000
Fiigure 2. Averagge Temperaturre Values A All these databaases are formattted in Network Common Data Form ((netCDF); we access a to them from MATLAB B through the m mexnc llibrary and the Snctools [13]. In addition, M MATLAB is invvoked ffrom OPNET by b using the MA ATLAB interface for executing “C” ccode. A full expplanation of thee configuration ccan be found in [12].
33.2 Enviroonmental Files
Figure 4. Baathymetry and d Altimetry file definition
O Once the data are available from OPNET, they are com mbined ttogether with thhe information oof the nodes (laatitude, longitudde and ddepth) and globbal parameters of the scenarioo such as frequuency, w wave informatiion (height and length), the moonth of the yeaar, etc. T The results are three environm ment files requireed by Bellhop [11]:
5 50
Environmeent file (*.env):: The general sttructure of this file is shown in F Figure 3. The vaalues of the Souund Speed Blocck and the Bottom m Block are gathhered from the ddatabases. The Array block is ddata from OPN NET node globbal position, annd the Surface linne, Output Bloock and Beam bblock are simuulation global paraameters.
10 00 Depth (m)
0
Bathymetrry file (*.bty): Consists of a two columns table including rrange (km) andd depth (m). Thiis file is createdd from the databases bases takingg into account tthe global positiion of the networrk nodes.
15 50
20 00
25 50
30 00
35 50
Altimetry file (*.ati): Com mpounds of a tw wo columns: naamely m) and depth ((m). This file is created withh two range (km global paraameters “Wave Height” and “W Wave Length”.
0
500
10 000
1500
200 00 2500 Range e (m)
3000 0
3500
4000
Figure 5. Plootting Bathymeetry and Altimeetry file data
21
B Based on data ffrom bathymetrry and altimetryy files we can define d tthe surface or w wave shape andd the bottom reelief, as shown in the uupper part of Fiigure 5, a 2D vvertical slice of underwater sceenario, w where the netw work is placed.. So, in this way w we can deffine a ssimulation scennario placed in any part of the world with reaal data aabout the local underwater envvironment charaacteristics.
meters for all the nettwork will be a square of 44000 x 4000 m loccation with diffeerent depths.
4.11 Valenciaa – Spain Thhe first place is located in coordinates 399°48'13.14"N and a 0°44'34.53"O. The node depth varries from 5 to 200 meters, the waave heiight is fixed too 0.5 meters annd the wave lenngth is 80 meteers. Thhis is an examplle of shallow waters w with a low w altimetry shaape. Thhe sediment flooor of the bottom m in this scenaario is gravel. W We cann see the node deployment in Google Earth iin Figure 6(a) and a thee results for thee Bellhop ray execution e are shhown in Figurees 7 andd 8.
33.3 Bellhop p Ray Traccing Tool A Again, we usse the MATL LAB interface from OPNE ET to ccommunicate aand execute the Bellhop ray traacing tool takinng the ffiles created inn the previous step as input. Depending oon the ddesired output ooption, differentt result files willl be created:
Option A: a *.arr file is created with thhe information oof the mes of the rayys that arrive aat the amplitude and travel tim receiver poosition.
Option R: a *.ray file is conformed too the coordinattes of t So, we aare able to buildd ray trajectoriess with every ray traced. all the disttortions and refl flections caused by their propaggation along the sscenario. They will be very different dependiing on the proxim mity to the surfaace and the heigght and length of the waves, as well as the prooximity and shaape of the bottoom. In c be found iin the addition, tthe types of sediment that can bottom maay affect the rayy propagation.
Thhis example couuld represent a ttypical networkk scenario closee to thee coast. The boottom relief in tthe scenario is deeper as it goes farrther from the ccoast. Results show how the rrays reflect a grreat num mber of times inn the bottom annd the surface.
4.22 Hawaii – USA Thhe second scenaario is placed inn coordinates 20°39'13.10"N 2 a and 1566°44'39.84"O. T The node depth varies from 10 to 300 meters and a thee wave height iss fixed to 8 meeters with a lenggth of 150 meteers. Thhis is an examplee of non-shallow w water with a large ocean waaves speecified in the alltimetry file. Thhe sediment flooor in this regionn is oozze. The node ddeployment in G Google Earth iss shown in Figgure 6(bb) and the resuults of Bellhopp ray executionn are depictedd in Figgures 9 and 10.
Option C: a *.shd file is ggenerated with the acoustic preessure e point of a grid that coveer the entire sceenario. found in every Acoustic pressure mayy be calculateed in a cohherent, incoherentt or semi-cohereent way.
Thhis scenario reppresents those nnetwork deployyments within the surrroundings of a group of islandds.
44. SIMULATION SC CENARIOS S
4.33 Random m Location (Atlantic ( O Ocean)
IIn order to testing the simuulator, the sam me node deployyment nnetwork has beeen placed in several world locations (show wn at F Figure 6). The depths of netw work nodes willl vary dependinng on tthe scenario wee simulate, beinng different if thhe network is loocated iin shallow or deeep waters.
Finnally, our last scenario is loccated at a randdom place in the midddle of Atlantiic Ocean, to teest a deep wateer case. The G GPS cooordinates are 44°52'4.80"N andd 34°57'0.00"O O. The node deepth varries between 500 and 1000 meteers.
N Next, we show the results for three different locations. In eaach of tthem, the envirronmental conditions differ forr the bathymetrry, the ssound speed proofile, the sedim ment floor, and thhe altimetry whhich is bbased on wave parameters.
Thhe surface activiity is defined wiith waves of 10 meters height and a 1000 meters lengthh. The sedimennt floor in this region r is mud and a orgganic. We can see the node deployment inn Google Earthh in Figgure 6(c) and thhe result for the Bellhop ray exxecution in Figuures 11 and 12.
T The main aim when choosinng these locatioons was to testt very ddifferent scenarrios with differrent environmeent conditions (wave ( aactivity, depthss, etc.). So, we ccan evaluate thee performance of the ssame network aat different loccations measurinng the impact oof the sscenario parameeters in the sim mulation results. The extension of the
In this scenario, thhe source and ddestination nodees are far from the botttom and the w waves, so both ddo not have a great effect in the waay the rays behaave. This scenarrio tries to show w a network in the midddle of an oceaan, far away from the coast aand in deep watters areeas.
A Africa
South Americaa ((a) Valencia
(c) Random location in the middle oof Atlantic Oceaan
(b) Hawaii
Figgure 6. The sam me network top pology deployeed
22
BELL LHOP- ANGLE = 60 0.0º FREQ = 10000 0 Freq = 10000 Hz Sd = 10 m
HOP - FREQ = 10000 0 BELLH 0
0
5
5
10
10
15
15
20
Depth (m)
Depth (m)
30
20 25
20 50 25
30
30
35 40
40
60
35 0
500
1000
1500
2000 Range (m)
2500
3000
3500
0
4000
Fiigure 7. Bellhop p Ray Map forr Valencia
500
100 00
1500
2000 2500 Range (m) (
3000
350 00
70
4000
F Figure 8. Bellhop Acoustic Prressure Map foor Valencia
Figure 10. B Bellhop Acoustiic Pressure Maap for Hawaii
F Figure 9. Bellhoop Ray Map foor Hawaii
BELLLHOP- ANGLE = 60.0º 6 FREQ = 100000 Freq = 10000 Hzz Sd = 50 m
BELLHOP- ANGLE = 60.0º FR REQ = 10000 0
0
2 20
200
3 30
400
4 40
600
5 50
800
6 60
100 200
400
Depth (m )
Depth (m)
300
500 600 700 800 900 1000
0
500
1000 0
1500 Range (m)
2000
2500
3000
Figurre 11. Bellhop R Ray Map for A Atlantic Ocean (Rand dom Location)
1000
0
5000
1000
1500 Range (m)
2000
2 2500
7 70
Figure 12. Bellhop Acoustiic Pressure Maap for Atlantic Ocean (Rand dom Location)
23
10000 VALENCIA HAWAII
f Number of Collisions
8000
ATLANTIC 6000
4000
2000
0 0
1000
2000
3000
40000
5000
60000
Traffiic Load packets)
Figu ure 14.Collision ns in different scenarios
F Figure 13. Netw work deploymeent 90
55. SIMULATION TE ESTS T The same simpple network depployment (figurre 13) is placed in tthe different sccenarios chosenn for the previoous simulation test, ffive sensor noddes generates thhe network trafffic load, two relay r nnodes only forrward packets and there is one o sink node that rreceives the information i froom the sensoors. The distannces bbetween nodes vary from 13000 to 1500 meterss
VALENCIA
Normalized Throuputh (%)
80
T The purpose of the simulatioon tests is to ruun a simple MAC M pprotocol such as ALOHA inn all the differrent scenarios with w ddifferent condiitions in order to analyze thhe behavior off the ssimulation tooll. This will lead us to the cconclusion of hhow iimportant is to have a realistiic simulator to test new protoocols aand validate theem under multiiple conditions in which it cann be iinvolved.
HAWAII
70 ATLANTIC
60 50 40 30
T The simulationn duration is 3 hhours which lasst between 4 annd 6 m minutes in an Inntel ® Core™ 2 Duo T8100 2..10 GHz with 3 GB oof RAM memoory. The main pperformance meetrics we will shhow aare network colllisions and gateeway throughpuut. The temperaature vvalues are an annnual average for fo each zone. T The most significant pparameters usedd for the simulaations appear in Table 1:
0
V Valencia
Haw waii
Atlanttic
Wave Height (meters)
0.5
2
6
Wave Length (meters)
25
1000
1500
Node Depth (meters)
15
50
50
Scenario Deptth (depth)
26
3000
50000
Oooze
Mud / Organnic
Seafloor Sediment
Gravel
Frequency (Khz)
10
Pkt Interarrivaal Time (s)
5 too1000
2000
3000
4000
5000
60000
oad ( packets) Traffic Lo
Figurre 15.Collisionss in different sccenarios A All the simulaation results w were obtained by averaging 15 simulation runs per traffic looad, resulting iin a total of 3300 simulations per sscenario.
Table 1. Simullation Parametters Parametters
1000
A As expected, evven though usinng the same nettwork deploym ment thhe simulation reesults will differr from one scennario to anotherr, as ccan be seen from m figures 14 annd 15. Apart froom using differrent loocations, the protocol has beenn tested under ddifferent conditioons (ee.g. different wave activity for each scenario).. Inn the first case (Valencia) witth a low wave shape scenario,, in eeach transmissioon the nodes moore neighbors aare reached, whhich m means that less collisions occuurs than in the other locationss as m more packets arre lost due to thhe wave effect among other faacts liike the temperaature differencee, the bottom rreflection, etc. W We aalso evaluate thee normalized thhroughput in thee gateway (packkets reeceived in gatew way node dividded by all packeets generated in the fi five sensors).
24
As a result of using Aloha protocol, the normalized throughput falls as the generation of packets increases. It is appreciable that the scenario with less collision is also the one with less throughput, this happens because the acoustic signal of sensor nodes reach to less neighbors and despite generating the same number of packets there fewer packets travelling in the medium and thus less overall throughput. For instance, during a single simulation the average number of reachable neighbors for Relay 6 in Valencia scenario is around four, in Hawaii between four and three and in Atlantic around two. Nevertheless the important point from these graphs is not the behavior of the MAC protocol but the difference of using the same MAC protocol with the same network parameters in different environment conditions and though having different results. 90
We have presented a powerful simulator tool to model underwater wireless sensor network scenarios all around the world. It is composed by well-known tools like OPNET network simulator, MATLAB and the Bellhop ray tracing tool. In addition, ocean databases were used to proper modeling the environmental scenario characteristics of a specific world location. The results of Bellhop propagation model has been tested and validated in real scenarios and the code is freely available as well as the protocols and databases used in this proposal. Simply using the simulator to place the network it will automatically generate the whole scenario, extracting from the databases the necessary information to build the environment conditions as well as the wave pattern. The interface can be used by non-developer users, being ease of use and fully configurable; this is an advantage over other proposals where in order to run a simulation there is a need to introduce the simulator and its implementation to the users.
August January
80 Normalized Throuputh (%)
6. CONCLUSIONS
August Waves
Although the simulator is enough accurate with the acoustic signal behavior, it is necessary to achieve a trade-off between accuracy and simulation complexity in order to find out the desired balance. This is one of the mayor challenges for future work and next simulator improvements. Reducing the simulation times will let us perform large scenario simulations in reasonable times and, increasing the simulator scalability.
January Waves
70 60 50
As previously remarked, the importance of testing new protocols proposals not only in ideal conditions but also when the physical parameters have a great impact on the performance is an essential point to validate our proposals in scenarios very close to real ones.
40 30 0
1000
2000
3000
4000
5000
Traffic Load ( packets)
7. ACKNOWLEDGMENTS
Figure 16.Normalized Throughput in Valencia (Season & Waves)
This work was supported by the Ministry of Science and Education of Spain under grant DPI2007-66796-C03-03.
Now to emphasize the environment effects we choose one single scenario and run different simulations with changing conditions. We have done simulations for every month of the year and with multiple wave shapes (12 months and 5 ocean wave shapes and 15 traffic loads). In the graph shown in figure 16 we show only two months (January and August) and each one with and without wave effect to highlight both characteristics and their influence. The shape of the ocean waves in the scenarios that include this effect are 2 meters height and 80 meters length.
8. REFERENCES [1] General bathymetric chart of the oceans. [Online]. Available= http://www.gebco.net [2] Guerra, F. 2009. A performance comparison of MAC protocols for underwater networks using a realistic channel simulator, OCEANS 2009, MTS/IEEE Biloxi - Marine Technology for Our Future: Global and Local Challenges, vol., no., pp.1-8, 26-29 Oct. 2009. DOI= http://ieeexplore.ieee.org/stamp/stamp.jsp?tp=&arnumber= 5422249&isnumber=5422059
From figure 16 we can draw that there is a small throughput difference between the simulations of January and August without the wave effect. There is also a slightly higher variation in the results when comparing the normal August scenario against the same month with waves, but the waves in winter season have a considerable impact on overall network throughput, reducing it up to 50%. So, we can conclude that in this particular case of shallow water scenario where the temperature variation is greater than in deeper scenarios (see Figure 2), the effect of the season is appreciable and its combination with the ocean waves can change completely the network performance.
[3] Guerra, F. 2009. World ocean simulation system (WOSS): a simulation tool for underwater networks with realistic propagation modeling. In Proceedings of the Fourth ACM International Workshop on UnderWater Networks (WUWNet ). ACM, New York, NY, USA. DOI=http://doi.acm.org/10.1145/1654130.1654134 [4] Jornet, J.M. 2008. AUVNetSim: A Simulator for Underwater Acoustic Networks. [Online]. Available=http://sourceforge.net/projects/auvnetsim/.
25
[5] Jornet, J.M., Stojanovic, 2008. M. Focused beam routing protocol for underwater acoustic networks. In Proceedings of the third ACM international workshop on Underwater Networks (WuWNeT '08). ACM, New York, NY, USA, 75-82. DOI=http://doi.acm.org/10.1145/1410107.1410121 [6] Llor, J. 2009. Analyzing the behavior of acoustic link models in underwater wireless sensor networks. In Proceedings of the 4th ACM workshop on Performance monitoring and measurement of heterogeneous wireless and wired networks (PM2HW2N '09). ACM, New York, NY, USA, 9-16. DOI= http://doi.acm.org/10.1145/1641913.1641915
[11] Porter, M. Bellhop code. [Online]. Available: http://oalib.hlsresearch.com/Rays/index.html
[7] MATLAB R2009a [Online]. Available= http://www.mathworks.com/
[14] The Network Simulator [Online]. Available= http://www.isi.edu/nsnam/ns/
[8] National geophysical data center, seafloor surficial sediment descriptions. [Online]. Available= http://www.ngdc.noaa.gov/mgg/geology/deck_41.html
[15] World ocean atlas. [Online]. Available= http://www.nodc.noaa.gov/OC5/WOA05/pr_woa05.html
[12] Seppälä, J.M., 2009. Simulating devices with adaptive antenna arrays using OPNET integrated with MATLAB. In Proceedings of the 4th ACM workshop on Performance monitoring and measurement of heterogeneous wireless and wired networks (PM2HW2N '09). ACM, New York, NY, USA, 159-166. DOI= http://doi.acm.org/10.1145/1641913.1641936 [13] Snctools for MATLAB [Online]. Available= http://mexcdf.sourceforge.net/.
[16] Xie, G., Gibson, J., 2006. Incorporating Realistic Acoustic Propagation Models in Simulation of Underwater Acoustic Networks: A Statistical Approach, OCEANS 2006, vol., no., pp.1-9, 18-21 Sept. 2006. DOI= http://ieeexplore.ieee.org/stamp/stamp.jsp?tp=&arnumber= 4099182&isnumber=4098825
[9] OPNET Modeler v15.0 Reference Manual OPNET Technologies Inc. OPNET Modeler [Online]. Available=http://www.opnet.com/ [10] Peleato, B., Stojanovic, 2007. Distance aware collision avoidance protocol for ad hoc underwater acoustic sensor networks, IEEE Commun. Lett., vol. 11, no. 12, pp. 10251027.
26