Optimisation of pipe networks is not used extensively in the design of urban water supply systems by water supply authorities or consultants. .... Proc., Computer.
Pipe Network Optimisation Using Genetic Algorithms
by Angus Simpson, Laurence Murphy and Graeme Dandy Department of Civil and Environmental Engineering GPO Box 498 University of Adelaide South Australia 5001
Paper to be presented at the ASCE Water Resources Planning and Management Conference Seattle, Washington May 1993
Citation: Simpson, A.R., Murphy, L.J. and Dandy, G.C. (1993). "Pipe Network Optimisation Using Genetic Algorithms." Proc., ASCE. Water Resources Planning and Management Division Specialty Conf., Seattle, Washington, May.
,.
Pipe Network Optimisation using Genetic Algorithms Angus R Simpsoni, Assoc. Mem. ASCE, Laurie J Murphy2, Graeme C Dandy3 Introduction Optimisation of pipe networks is not used extensively in the design of urban water supply systems by water supply authorities or consultants. Often there are many choices to be made in designs including the size and material of new pipes, whether existing pipes should be duplicated or cleaned, and the sizing of pumps. Once the number of decision variables exceeds about 8 or 10, the number of possible alternative pipe network configurations may easily be in the order of billions. Currently, designers have sophisticated hydraulic simulation tools available for design. A number of trial networks are tested to find if all projected demands under peak loading or frre conditions can be met while maintaining specified minimum pressure constraints at all nodes in the network. The experienced designer uses rules of thumb such as head loss per unit length to eliminate many unrealistic combinations. However, given the many possible combinations, especially for pipe network expansions involving many pipes, it is unlikely that even the most experienced designer will be able to determine the minimum cost network. A new optimisation technique of genetic algorithms has recently been successfully applied to pipe network optimisation. In this paper a parametric analysis is carried out of the genetic algorithm in order to assess the form of the fitness function. Genetic Algorithms for Pipe Optimisation The application of the genetic algorithm technique has been developed at the University of Adelaide over the last 3 years (Murphy and Simpson 1992, Simpson et al. 1992, Dandy et al, 1993). A population of pipe network solutions is considered. Each pipe to be sized is represented by a binary sub-string. A linkage is made between each binary sub-string combination and a particular available pipe size with a corresponding cost. Sub-strings are joined together to form a full-length string representing the entire network. There are many variations possible for application of the genetic algorithm technique. In this paper the role of the form of the fitness function is investigated. The genetic algorithm for pipe optimisation involves the following steps: (i) Generation of initial population. The initial population of solutions (of say, size N=I00) is generated using a random number generator. ISenior Lecturer, Dept of Civil and Environmental Engineering, University of Adelaide, GPO Box 498, Adelaide, South Australia 5001. 2Research Officer, 3 Senior Lecturer (both at University of Adelaide).
1
Simpson
Computation of network cost. Each sub-string of the 100 strings is decoded . into the corresponding pipe size. The total material and construction cost of the network for each of the solutions in the population is then computed. (iii) Hydraulic analysis of network. Each network in the population is analysed for heads and discharges under the specified demand pattem(s). The actual heads are compared with the minimum allowable pressure head and any pressure deficits are noted. (iv) Computation of penalty cost. A penalty cost is assigned to the network by considering the node with the worst pressure deficit. The pressure deficit is multiplied by a penalty factor (e.g. $50,OOO/metre of head). (v) Computation or total cost. The total cost of each network in the population is the sum of the network cost (li) plus the penalty cost (iv). (vi) Computation of the fitnesses. For each network in the population, the fitness is taken to be a function of its total cost in part (v). For example, (ii)
Fitness =(
1 Total cost
)n
(1)
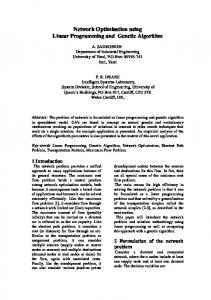
(vii) Generation of a new population using the reproduction operator. New members of the next generation are obtained such that the probability of selection of a string to be included in the next generation is directly proportional to its fitness. (viii) The crossover operator. Each pair of strings in the new population are considered in tum. H a random number in the range 0.0 to 1.0 exceeds the crossover probability Pc the crossover operator is not applied. Alternatively, a random crossover point is selected along the m-bit string (e.g. position 5). The digits from 6 to m of the 1st string are moved to the digit positions 6 to m of the 2nd string, while the corresponding digits of the 2nd string are moved to replace the end of the 1st string. (ix) The mutation operator. If a random number exceeds the mutation probability, Pm the mutation operator is not applied to the string. Alternatively, the mutation operator is applied by randomly selecting a digit position along the string and then changing the digit to the opposite value. (x) Production of successive generations. The new generation has now been produced using steps (vii) to (ix). The process is repeated to produce successive generations (e.g. 80 to 100 generations). The least cost strings (e.g. the best 20) are stored and updated as cheaper cost alternatives are generated. Case Study The sensitivity of the effectiveness of the genetic algorithm technique is investigated in optimising a network first proposed by Gessler (1985) and shown in Fig. 1. Table 1 gives the available pipe sizes, costs and costs of cleaning existing pipes. Eight choices are provided corresponding to a 3-bit binary string. The network is to be designed for 3 loading cases as shown in Fig. 1. The minimum allowable pressures at each node Hmjn are also given in Fig. 1.
(mm)
(mm)
152 203 25 305
356 407 458 509 2
Simpson
I
---existing system existing pipe to be duplicated, cleaned or left newpipes node
J
I
o
Reservoir
Demand Pattem 1 Node (Vs) Hmin (m) 2 12.62 28.18 3 12.62 17.61 4 0 17.61 6 18.93 35.22 7 18.93 35.22 8 18.93 35.22 9 12.62 35.22 10 18.93 35.22 11 18.93 35.22 12 12.62 35.22 e attem2 2 12.62 14.09 3 12.62 14.09 4 0 14.09 6 18.93 14.09 7 82.03 10.57 8 18.93 14.09 9 12.62 14.09 10 18.93 14.09 11 18.93 14.09 12 12.62 14.09 Demand Pattem 1 2 12.62 14.09 3 12.62 14.09 4 0 14.09 6 18.93 14.09 7 18.93 14.09 8 18.93 14.09 9 12.62 14.09 10 18.93 14.09 11 18.93 14.09 12 50.48 10.57
a
I
:-:-:-:-:-:-:-:-:-:-:-:-:-:-:- 1, EL365.76
I
Tank
t-:-:-:-:-:-:-:-:-:-:-j 5, EL371.86
(1],356,75 (pipe number], diameter(nvn), Hazen-Williams rouglY1ess C Nom. 1. All pipe lengths are 1609m, except p/pe{1}=4828m
and pipe(4}=6437m.
2. C=120 for new pipes and deaned pipes. 2, EL320.04 node number, node elevation(m) ~--------------------------------~
~20.04
o~
3, EL326.14 4, E~23 [2],254.80 ~ [3},254.80 I
~I
;::;
1[6] 7, E~5.66 (7).203,100 [8]
48, EL292.61
§
g
N
1[11]
tS _
I
;'1;
~
~
~
(
_I
I
co 'It
6, EL298.70
1
[12],203,100 ....
9, EL289.56
10, EL289.56
-0-
[13]
[14]
11, EL292.61
-0
12, EL289.56
Figure 1 Layout of Gessler problem Two equivalent optima have been previously identified by a complete enumeration (Simpson et aL 1992). These solutions are shown in Table 2_
T a bl e 2• Th e two opllma f I soI u fIons 0 fth e~ro bl em Pipe SelectIons (mm diameter Total No. Cost pipe pIpe pIpe pipe pIpe pIpe pIpe [1] [4] [5] [6] [11] ($m) [13] [8] 1 1.7503 leave 356dup leave 305 203 203 152 254 152 2 1.7503 leave 356 dup leave 305 203
pipe [14] 254 203
Results This study considered 5 different fitness functions for the genetic algorithm. The exponent n was allowed to take a constant value for the GA run ·in the range n = 1 to n = 5. The 5 fitness function fonnulations were tested over 8 different combinations of the GA parameters as shown in Table 3. The GA runs were allowed a maximum of 10,000 function evaluations and the runs utilised approximately 6 minutes cpu time on a Sun sparc computer. The results of the GA runs are summarised in Table 4. 3
Simpson
n I
2 3 4 5
Ta bl e 4• S ummaryofth e GA resuIts Lowest cost solution in $ million and Evaluanon number achieved E B D F A C a H 1.868 1.839 1.842 1.HOO 1.800 1.848 1.848 1.861 2400 10000 5580 6210 7140 9380 9100 3900 1.750 1.773 1.750 1.829 1.750 1.750 1.750 1.812 4080 4160 6210 2970 3080 5700 4200 8540 1.750 1.843 1.750 1.839 1.800 1.839 1.750 1.750 4240 2870 4500 1170 2700 3640 8960 4800 1.819 1.812 1.750 1.750 1.750 1.830 1.750 1.750 3200 1620 1400 1620 2730 490 7680 660 1.750 I.H39 1.750 1.839 1.750 1.819 1.750 1.750 480 3920 910 560 2880 1440 1980 800
Avg 1.838 6714 1.771 4868 1.790 4110 1.777 2425 1.781 1621
The GA using a value of n = 1 did not achieve the optimal solution (= $1.750 million) for any of the runs within the allowed 10,000 evaluations (compared to a search space of >16 million). A value of n = 2 is superior achieving the optimal solution in 5 of the 8 GA runs. Values of n = 4 and n = 5 are equally successful. The averages in the last column of Table 4 suggests the quality of the solution for a value of n = 2 is marginally superior to that for the larger values of n at the expense of a slower convergence rate. Conclusions Genetic algorithms are an extremely powerful technique which are capable of finding the minimum cost network in relatively few hydraulic simulations compared to the size of the search space. In addition the genetic algorithm technique provides a number of near-optimal solutions which may be considered by the designer. This new technique is simple to implement and represents an opportunity for water supply authorities to potentially achieve large savings in the capital cost of provision of water supply infrastructure. References Dandy, a.c., Simpson, A.R., Murphy, L.l. (1993). "A Review of Pipe Network Optimjsation Techniques" Watercomp '93, Melbourne, Australia, March. Gessler, J. (1985). "Pipe Network Optimization by Enumeration". Proc., Computer Applications/or Water Resources, ASCE, Buffalo. N.Y., 572-581 Murphy, L.J. and Simpson, A.R. (1992). Pipe Optimisation Using Genetic Algorithms. Research Report No. R93. Department of Civil Engineering, University of Adelaide. Australia, June, 53 pp. Simpson, A.R., Dandy. G.C., Murphy, L.J., (1992). "Genetic Algorithms Compared to Other Techniques for Pipe Optimiz.ation", submitted to ASCE, Journal o/Water Resources Planning and Management, July. 4
Simpson