ISPRS Annals of the Photogrammetry, Remote Sensing and Spatial Information Sciences, Volume II-3/W5, 2015 ISPRS Geospatial Week 2015, 28 Sep – 03 Oct 2015, La Grande Motte, France
POLE-SHAPED OBJECT DETECTION USING MOBILE LIDAR DATA IN RURAL ROAD ENVIRONMENTS Manohar Yadav a, *, Arshad Husain a, A.K. Singh b, Bharat Lohani c a
GIS Cell, Motilal Nehru National Institute of Technology, Allahabad, India – (ssmyadav, arshad.husain18)@gmail.com b Dept. of Civil Engineering, Motilal Nehru National Institute of Technology, Allahabad, India -
[email protected] c Dept. of Civil Engineering, Indian Institute of Technology, Kanpur, India -
[email protected] Commission III, WG III/2
KEY WORDS: Mobile LiDAR, Road, PSOs, Utility Poles, Trees, Eigen Value
ABSTRACT: Pole-shaped objects (PSOs) located along a road play key role in road safety and planning. Automation is required for calculating the numbers of trees need to be removed and utility poles need to be relocated during rural road widening. Road-side poles are among the most frequently struck road-side objects during road-side accidents. An automatic method is therefore proposed for detecting PSOs using LiDAR point cloud captured along the roadway using Mobile LiDAR system. The proposed method is tested on the point cloud data of rural road environment in India. Dataset of study area having text file size of 1.22 GB is processed in 13 minutes resulting in completeness of 88.63% and correctness of 95.12% in identifying PSOs within 10m of the road boundary. In data of across road coverage of 5m of the road boundary, the completeness of 93.10% and correctness of 100% are achieved. Poles attached with other objects, tilted poles and the poles occluded by tree branches and shrubs are detected by the proposed method.
1. INTRODUCTION Mobile LiDAR system (MLS) is becoming a popular choice among the government and private agencies, working in the field of roadway planning, designing and its management. MLS is used to capture accurate, precise and dense georeferenced 3D colored point cloud data along the corridor at highway speed. Extent of across the road coverage from the road boundary using MLS depends on the way different sensors are configured and mounted on top of the vehicle. Data acquired by MLS is big in size, generally a couple of Giga Bytes (GB) per kilometer. Generally, width of formation or roadway width of 7.5m suggested by Indian Road Congress is used in the rural roadway planning and its management (Mathew and Rao, 2006) . This coverage includes planar and linear non-ground objects, most commonly road-side buildings, low and high vegetation, utility poles, other pole-shaped objects and boundary walls. A roadside is defined as the area beyond the edge line of the carriageway (Nitsche et al., 2010). The pole-shaped objects (PSOs) mainly utility poles and road side planted trees are located nearby road boundary in the rural road environment. They are responsible for most of the roadside accidents and categorized as two major fatal roadside hazards. Roadside Hazards located within 5m from road-boundary causing 89.5% of road-side car occupant fatalities in South Australia 1985-1996 in Speed Zones less than 80 km/hour (Kloeden, et al., 1999). Utility pole crashes have consistently been a significant agent in single vehicle fatality crashes on urban roads in NSW (Roos and Job, 2009). Compared to other roadside obstacles, trees or other rigid vegetations seem to be most hazardous and utility poles are the second most hazardous roadside obstacles regarding fatal accidents (Nitsche et al., 2010). Mak and Mason (1980) have pointed out that pole accidents in rural areas have higher impact severity than urban pole accidents as a result of higher impact speeds. A total of 10.7% of rural pole accidents resulted in severe to fatal injuries versus only 5.4% for urban pole accidents. *
So identification of these PSOs plays an important role in road safety analysis. Road side trees need to be removed and utility poles need to be relocated during road widening from singlelane to multi-lane. So, their identification is useful to optimize the road planning having less destruction overhead. Researchers have been analyzing the importance of extracting PSOs from 3D point cloud data since the advent of mobile LiDAR systems in the last decade. To reduce data size, which is significantly large for MLS data, a few researchers have used the technique of voxelization. Cabo et al. (2013) have proposed a three step method for pole-like street furniture objects detection. They have used the concept of voxelization to reduce the data size and processing time both. Two-dimensional analysis and tridimensional reconstruction are done to detect pole like objects. It is assumed that a pole section has to be an isolated element (i.e., no other elements should be found at its close surroundings). So, pole like objects partially occluded by other objects or poles located very close to other objects are not detected. Wu et al. (2013) have implemented a voxel based method for street tree detection. Basic concepts of voxel creation and connectivity analysis of the voxels for tree detection are discussed. In case of multiple-stemmed trees, if their furcal sections are lower than the initial searching height then the multiple stems of an individual tree would be detected as several separated trees. Many researchers have used the concept of Principle Component Analysis (PCA) for detection of linear objects. ElHalawany and Lichti (2011) have developed an algorithm for road pole detection, in which they have used the concept of k-d tree for nearest neighbor search. PCA is used for pole detection. Their algorithm's accuracy is dependent on the point density. Yokoyama et al. (2011) have used the k-nearest neighbor graph and PCA in their proposed algorithm for detecting pole-like objects from point cloud. They have assumed that input dataset do not have the ground points. Their method is not able to detect connected poles separately.
Corresponding author
This contribution has been peer-reviewed. The double-blind peer-review was conducted on the basis of the full paper. Editors: S. Oude Elberink, A. Velizhev, R. Lindenbergh, S. Kaasalainen, and F. Pirotti doi:10.5194/isprsannals-II-3-W5-11-2015
11
ISPRS Annals of the Photogrammetry, Remote Sensing and Spatial Information Sciences, Volume II-3/W5, 2015 ISPRS Geospatial Week 2015, 28 Sep – 03 Oct 2015, La Grande Motte, France
Pole detection algorithm has been designed by Kukku et al. (2009) using profile scans. They have not clearly mentioned about the use of point cloud data captured from different drive directions in their approach. A pole is divided into several horizontal stacks and analysed independently (Brenner, 2009). The poles are detected, if a certain number of stacks satisfy the characteristics of pole. The method fails to detect poles occluded by tree branches and shrubs. Lehtomäki at al. (2010) have proposed a pole detection algorithm that works in four phases, i.e., scan line segmentation, clustering, merging of clusters and classification of clusters. The algorithm has difficulty recognizing tree trunks and utility poles surrounded by branches and wall structures. The algorithm proposed by Pu et al. (2011) is percentile based pole recognition algorithm. Rough classification of ground, on-ground and off-ground is not accurate and many on-ground points are not classified as onground points. It leads to undetected pole-like objects. Also, pole detection depends on scanning pattern, point density and type of point’s distribution. So if only few points are captured from poles, then they could not be grouped into a segment and the poles could not be found. Li and Elberink (2013) have proposed an algorithm for road furniture (pole-like objects) detection. Rough classification is performed to remove the points that do not belong to the area of interest. Rule-based tree detection is done by defining rules based on different kind of attributes. Percentile-based pole detection is used to detect the pole-like objects and knowledge-based classification is used to classify the pole-like objects into traffic sign, traffic light or roadside furniture like lamp post. PCI (Pulse count Information) is also needed along with point cloud in the case of tree detection. Some actual pole-like objects in the MLS point cloud which hanging in the air, 1m above the ground are not detected. Poles which middle section is partially occluded and having fewer points are also not detected. Yu et al. (2014) have developed novel pairwise 3-D shape context for partial object matching and retrieval for extracting 3-D light poles and trees from mobile laser scanning (MLS) point clouds in a typical urban street scene. The construction of the pairwise 3-D shape context is slower than that of the single-point-based 3-D shape context. The existing literature fail to address the detection of highly occluded poles, poles closely attached with other objects and scanned poles in the non-uniformly distributed MLS point cloud having less point density. Speed of big size MLS data processing is also a major limitation in the existing methods.
along Z-dimension in stage II. Finally pole-shaped vertical objects are detected in stage III based on the different conditions imposed on the computed parameters associated with PCA. 2.1 Gridding MLS data points captured along the corridor and stored in XYZ format are used as input. These data are projected onto a plane: Z=C, where C is any arbitrary constant that lie within the range of Z values. Rectangular minimum bounding box is generated for closing the 2D projected data points. Bounding box is defined by its four vertices. Further, data points within bounding box are divided into 2D regular square grids. Square grid size (m×m) is defined by the user on the basis of ground point’s flatness within the grids. X-axis and Y-axis are considered for 2D square grid formation along with coordinates of four vertices of bounding box. 2.2 Vertical Segmentation MLS data points within each grid are further divided into different segments (Figure 1). Segmentation is performed based on the grouping of data points lying in the specific range of Z values. Initially MLS data points of each grid are rearranged by considering the data points in increasing order of their Z values. Rearranged data are divided into n segments (Figure 2(a)) based on the difference in the minimum Z ( Z min ) and derived maximum Z ( Z max ). The n segments are equally spaced by height h along the Z-direction. Z min and Z max are variables having different values for each square grid. They are related by Equation 1. So, only threshold values for n and h are decided by user based on the type of PSOs present in data and their height from ground. Zmax Zmin n h
(1)
The effect of outliers is avoided by considering the average of 100 data points from top of rearranged data file as minimum Z. It is verified through several preliminary experiments. The first segment includes mostly the LiDAR points that belong to the ground surface and bottom of the other non-ground objects (Wu et al., 2013). So, MLS data points within the first segment are left unprocessed.
Existing methods have many limitations, which demand development of new method to removes these limitations. Proposed method is computationally time efficient and removes the limitations of existing methods, i.e., identification of partially occluded poles, tilted poles, poles closely attached with other objects and scanned poles in the MLS point clouds having quite less number of non-uniformly distributed points. Proposed method detects PSOs mainly utility poles and trees of height between 5-7m. Identification of these objects, lying within 5m and 15m across road coverage from road boundary is only considered. This consideration is based on the critical role of these objects in the road safety analysis and road planning (widening of road from single-lane to multi-lane). Test site from rural locality is selected for testing the method which is quite complex unlike the sites used in existing studies. 2. METHODOLOGY Proposed method is divided into three stages; (I) Gridding (II) Vertical segmentation (III) Region growing. Stage I divides input point cloud data into square grid of predefined size. Each grid is further divided into equally spaced vertical segments
Figure 1. Vertical segmentation of MLS data points 2.3 Region growing MLS data points within the segments except first segment are selected for further processing. 2D coordinate of the corner of a
This contribution has been peer-reviewed. The double-blind peer-review was conducted on the basis of the full paper. Editors: S. Oude Elberink, A. Velizhev, R. Lindenbergh, S. Kaasalainen, and F. Pirotti doi:10.5194/isprsannals-II-3-W5-11-2015
12
ISPRS Annals of the Photogrammetry, Remote Sensing and Spatial Information Sciences, Volume II-3/W5, 2015 ISPRS Geospatial Week 2015, 28 Sep – 03 Oct 2015, La Grande Motte, France
selected square grid, say abcd (in Figure 2(b)), i.e., minimum X and minimum Y, are selected as the seed point. Neighboring MLS data points around the seed point as center and within the user defined circle of radius, R are identified using two dimensional k-d tree. Cylindrical cluster of radius R is generated in the aforesaid segment of height h (Figure 2(a)). Three Eigen values are calculated in cylindrical cluster using mathematical framework used in the PCA. Normalized Eigen values 1 , 2 ,3 are further calculated. Eigen vector
E max (Equation 2) is
generated corresponding to maximum normalized Eigen value max .
Emax A X BY C Z
(2)
Where A, B, C are the constant coefficients and X , Y , Z are unit vectors along X, Y, Z axes. Now the angle ( ) between Zaxis and Eigen vector E max is calculated with the help of Equation 3.
cos 1 C
2 2 2 A B C
(3)
(cylindrical cluster) are also part of PSO. Above process repeats within circle of radius R around the vertical line in all n upper segments until the conditions are not satisfied. Finally, if MLS data points within the same circular neighborhood satisfy the aforesaid two conditions in all n segments, they connected together vertically and represented as a PSO. It is a kind of vertical region growing in the form of MLS data points with vertical growth confined within cylindrical circumference (Figure 2(a)). Further, new seed point is generated and act as new center by shifting 2D coordinate of previous seed point along the X-direction by the same user defined radius R. Previous and the new circles are partially overlapped. Partial overlapping is required to remove the circle boundary problems. Let say, if part of scanned PSO is falling close to boundary of the circle then it might not satisfy the conditions discussed previously for PSOs identification and filtered out. Partial overlapping is used to include the complete scanned PSO, at least in one circle out of four adjacent circles. If part of same scanned PSO is processed in two adjacent circles as PSO then redundant MLS data points are removed and unique points are kept. MLS data points within the new circle are further used and whole process of this stage is repeated. MLS data points within the first selected grid, say abcd are covered by horizontal circle growing along X and Y directions (Figure 2(b)). Next, one by one all the square grids generated in stage 1 are selected and methods described in stage 2 & 3 are applied to detect PSOs. 3. EXPERIMENTAL STUDY 3.1 Study Area and Mapping Data The proposed method is tested on the mobile LiDAR data captured by StreetMapper 360 (StreetMapper 360, 2014). Study area is located along the 370m long corridor of down town area near the Bengaluru city (South-West of India). It is narrow single track rural road without curb. Average width on the road is 6m.
Figure 2. (a) Side view of MLS data points showing cylindrical region growing along Z-axis (b) Top view of data points showing circular region growing along X-axis and Y-axis All MLS data points within the cylindrical cluster may belong to a part of PSOs, if two conditions are satisfied: (I) Maximum normalized Eigen value ( max ) is greater than user defined threshold; (II) The angle ( ) between Z-axis and Eigen vector E max is less than a user defined angle threshold. If these two conditions are satisfied, it is assumed that cylindrical cluster is part of PSOs. In order to validate this assumption, the MLS data points within the circle of radius R around vertical line passing through seed point are selected from upper segments. Vertical line is oriented along Z-direction. So again, in the third segment neighbors within circle of radius R around the defined vertical line are identified. Next, the parameters required for neighbors identification as part of PSO are again computed. If two conditions, as above, are satisfied then these neighbors
Figure 3. View of MLS data points of study area. PSOs of height 5-7m are visually identified and marked as: P for utility poles and T for trees. Marked PSOs are used as reference data Road environment of the study area is quite complex, because different objects are randomly located without any proper pattern. There is unevenness in distance of two utility poles and their base level from the road surface. Road-side trees are randomly planted. Mostly the utility poles are present in the close proximity of road boundary. Nearly 227 million MLS data points (text file size: 1.22GB) are captured (Figure 3) and average 2D point density of 230 points/m2 is achieved. Maximum height variation of the ground LiDAR points is 12m.
This contribution has been peer-reviewed. The double-blind peer-review was conducted on the basis of the full paper. Editors: S. Oude Elberink, A. Velizhev, R. Lindenbergh, S. Kaasalainen, and F. Pirotti doi:10.5194/isprsannals-II-3-W5-11-2015
13
ISPRS Annals of the Photogrammetry, Remote Sensing and Spatial Information Sciences, Volume II-3/W5, 2015 ISPRS Geospatial Week 2015, 28 Sep – 03 Oct 2015, La Grande Motte, France
max
Threshold value 12m×12m 4 or 5 1.4m 0.3m >0.78 >780
Performance Analysis
The proposed method uses only XYZ coordinates of MLS data points. So, unlike the algorithms proposed by Kukku et al. (2009) and Lehtomäki et al. (2010), the proposed method is independent on the scanning geometry and neighborhood structure in the MLS data file. Detected PSOs (utility poles and trees) are validated using the reference data. Performance of proposed method is shown in Table 2 and Figure 4. Completeness of 88.63% and correctness of 95.12% (Table 2) are achieved within 10m of the road boundary. Within 5m of the road boundary, the completeness of 93.10% and correctness of 100% (Table 2) are achieved.
12 12
5
23/25
04/04
12 12
10
24/26
15/18
Square grid size
Table 1. Threshold values of parameters used in the proposed method
3.4.1
Figure 4. (a) View of extracted PSOs. They are identified by: symbol T used for tree, P for pole by considering reference data. Symbol B is used for extracted building columns; (b) & (c) Zoomed in view of PSOs from two locations of MLS data points of study area Maximum height variation of ground points will increase by increasing the grid size. This again imposes problem in tuning the threshold values for remaining parameters used in the method. Uniform height of 1.4m is taken for each segment.
27/29 [93.10] 39/44 [88.63]
Non-pole-shaped objects (N-PSOs) (number and correctness*** [%])
Parameter (symbol) m×m n h R
3.4 Discussions
Total detection (ratio and completeness** [%])
Proposed method is tested on the MLS data points of study area using the parameters threshold values listed in the Table 1. Square grid size of 12m×12m is selected through several preliminary experiments. If, grid size is selected less than the selected threshold value, then non-pole-shaped objects (NPSOs), i.e., building columns are falsely classified as PSOs.
0.78 and angle ( ) between Z-axis and Eigen vector corresponding to max is greater than 780. These two conditions are only satisfied by the vertical linear objects, i.e., PSO nearly parallel to the Z-axis. Points from part of the vertical planes as most of the building walls falling within cylindrical cluster do not satisfy these strict criteria and filtered out. Result of the PSOs detection in the study area is shown in Figure 4.
Trees: P/Q* (trunk height: 5-7m)
3.3 Results
MLS data points cluster within the circle are categorized as part of pole if maximum normalized Eigen value ( max ) is more than
Utility poles: P/Q* (height: 5-7m)
Reference data are collected by visual inspection of input MLS data points of study area (Figure 3). Collection is based on the location and description of the PSOs along the corridor. PSOs of height 5-7m are only considered located within 10m of the road boundary. Utility poles and trees have main contribution in the PSOs. Trees having similar geometry as utility pole are only considered. These objects are easily detectable and marked in the dense MLS data points of study area by visual inspection (Figure 3). Marked objects, utility poles-P and trees-T are used as reference data for validation of algorithm output. Up to 120 tilted from Z-direction and highly occluded PSOs having less number of MLS data points are also chosen as reference objects. Study area has 29 and 44 PSOs located within 5m and 10m of the road boundary.
Lowest segment of 1.4m height generally includes bottom portion of PSOs. They may be surrounded by shrubs, so this segment is not used in the processing and the effect of shrubs is nullified in the final result. Height of utility poles is 5-7m in the data, so only first 4 or 5 segments are considered. 2D circular region growing is performed within the grid by using radius of 30cm. This radius is chosen equal to the maximum diameter of utility poles, i.e., 30cm in the study area.
Distance coverage of the road boundary (m)
3.2 Reference Data
00 [100] 02 [95.12]
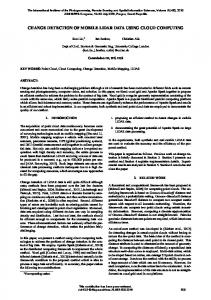
Table 2: Number and type of PSO detected in the study area * P/Q Total detection/Reference value ** Completeness (%): [PSOs detected]/ [Reference value of PSO] *** Correctness (%): [PSOs detected]/ ([PSOs detected] + [N-PSOs detected]) Pole closely attached with other object, i.e., in Figure 5(a) pole is attached with boundary wall is detected by the proposed method as is not detected by the proposed methods of Cabo et al. (2013) and Lehtomäki at al. (2010). Unlike the methods proposed by El-Halawany and Lichti (2011), Li and Elberink
This contribution has been peer-reviewed. The double-blind peer-review was conducted on the basis of the full paper. Editors: S. Oude Elberink, A. Velizhev, R. Lindenbergh, S. Kaasalainen, and F. Pirotti doi:10.5194/isprsannals-II-3-W5-11-2015
14
ISPRS Annals of the Photogrammetry, Remote Sensing and Spatial Information Sciences, Volume II-3/W5, 2015 ISPRS Geospatial Week 2015, 28 Sep – 03 Oct 2015, La Grande Motte, France
(2013) and Pu et al. (2011), the proposed method is independent on the point density, scanning pattern and number of points in the scanned PSOs. So scanned PSOs (Figure 5(c)) having fewer points at any level from bottom to top are detected by the proposed method. Tilted pole as shown in Figure 5(b) are also detected. Further, unlike the methods proposed by the Brenner (2009) and Li and Elberink (2013), the proposed method detects poles having their base surrounded by shrubs and hanging poles above the ground. Shrubs mostly lie within the first segment of the proposed method and this segment does not participate in the PSOs detection process, so effect of shrubs is negligible in the proposed method. PSOs heavily occluded at their upper part are not detected. Building columns having nearly the same geometry as PSO are falsely detected as PSO.
3.4.2
Computational Efficiency
The proposed method is quite fast, because all the input MLS data points are not used in the processing. First segment (Figure 1), which contains nearly all the ground points and bottom section of non-ground object are left unprocessed. Further, the remaining segment MLS data points are processed by considering points within circular neighborhood as whole. If points within circular neighborhood satisfy the criteria as discussed in section: 2.3, then vertical region growing is performed otherwise circle grows in horizontal direction. The execution time of proposed method is nearly 13 minutes on the dataset of text file size 1.22 GB. Proposed method is implemented using Matlab2013a installed in standard PC (OS: Windows7 64bit, CPU: Intel Core
[email protected], RAM: 4GB). 4. CONCLUSIONS AND FUTURE WORKS In this study, an automatic method is proposed for extraction of PSOs from MLS data. Initially, input MLS data are divided into square grid, followed by vertical segmentation of each grid. PCA based analysis is performed within cylindrical clusters to identify PSOs in each segment. Finally these are connected together. Proposed method is tested on the selected study area. The completeness of 88.63% and correctness of 95.12% are achieved within 10m of the road boundary. Within 5m of the road boundary completeness of 93.10% and correctness of 100% are achieved. Utility poles heavily occluded at their upper part are not detected and a few building columns similar to PSOs are classified as PSO. Proposed method fails to extract pole attachments at upper part. Using the results obtained in the study area and thorough analysis of the existing methods, it can be concluded that the proposed method is more general and removes the limitations of existing methods by: (I) detecting PSOs attached with other objects (II) detecting tilted and occluded poles (III) being computationally efficient (IV) requiring no training data (V) no initial assumptions about the relative location of the poles and (VI) being independent of the scanning geometry information and only need MLS data points in XYZ format. Future works are: (I) to improve the correctness by eliminating the building columns detected as PSOs, (II) extraction of PSOs along with their attachments at upper part, (III) automatic classification of PSOs into different classes based on the recognition of attachments types at upper part of PSOs. ACKNOWLEDGEMENTS The authors would like to thanks Geokno India Pvt. Ltd. for providing the StreetMapper 360, a LiDAR mobile mapping system and field assistance for capturing the point cloud data used in this study. REFERENCES Brenner, C., 2009. Extraction of Features from Mobile Laser Scanning Data for Future Driver Assistance Systems. Advances in GIScience, In: Geoinformation and Cartography, Springer, pp. 25-42.
Figure 5. View of detected (a) Utility pole attached with boundary wall (b) Tilted utility pole (c) Occluded utility pole by tree branches
Cabo, C., Ordoñez, C. García-Cortés, S., J., Martínez, 2014. An algorithm for automatic detection of pole-like street furniture objects from Mobile Laser Scanner point clouds. ISPRS Journal of Photogrammetry and Remote Sensing 87, pp. 47-56.
This contribution has been peer-reviewed. The double-blind peer-review was conducted on the basis of the full paper. Editors: S. Oude Elberink, A. Velizhev, R. Lindenbergh, S. Kaasalainen, and F. Pirotti doi:10.5194/isprsannals-II-3-W5-11-2015
15
ISPRS Annals of the Photogrammetry, Remote Sensing and Spatial Information Sciences, Volume II-3/W5, 2015 ISPRS Geospatial Week 2015, 28 Sep – 03 Oct 2015, La Grande Motte, France
El-Halawany, S. I., Lichti, D. D., 2011. Detection of Road Poles from Mobile Terrestrial Laser Scanner Point Cloud. In: International Workshop on Multi-Platform/Multi-Sensor Remote Sensing and Mapping (M2RSM), Xiamen, China, Art. No. 5697364 0. Kloeden, C. N., McLean, A. J., Baldock, M. R. J., Cockington, A. J. T., 1999. Severe and Fatal Car Crashes Due to Roadside Hazards, a final report to the Motor Crash Commission. NHMRC Road Crash Research Unit, The University of Adelaide, Australia.
Scanning Data of Urban Environments. International Journal of CAD/CAM, Vol. 13, No. 2, pp. 31-40. Yu, Y., Li, J., Yu, J., Guan, H., Wang, C., 2014. Pairwise Three-Dimensional Shape Context for Partial Object Matching and Retrieval on Mobile Laser Scanning Data. IEEE Geoscience and Remote Sensing Letters, Vol. 11, No. 5, pp. 1019-1023.
Kukko, A., Jaakkola, A., Lehtomki, M., Kaartinen, H., Chen, Y., 2009. Mobile mapping system and computing methods for modeling of road environment. In: Proceeding of the Urban Remote Sensing Joint Event, pp. 331–338. Lehtomäki, M., Jaakkola, A., Hyyppa, J., Kukko, A., Kaartinen, H., 2010. Detection of vertical pole-like objects in a road environment using vehicle-based laser scanning data. Remote Sensing 2 (3), pp. 641–664. Li, D., Elberink, S. O., 2013. Optimizing Detection of Road Furniture (Pole-Like Objects) in Mobile Laser Scanner Data, In: ISPRS Annals of the Photogrammetry, Remote Sensing and Spatial Information Sciences, Volume II-5/W2, ISPRS Workshop Laser Scanning, Antalya, Turkey. pp. 163-168. Mak, K. K., Mason, R. L., 1980. Accident Analysis-Breakaway and Non-Breakaway Poles Including Sign and Light Standards Along Highways. Volume1:Executive Summary, U.S. Department of Transportation, National Highway Traffic Safety Administration, Federal highway Administration, Washington, D.C., USA. Mathew, T. V., Rao, K. V. K., 2006. CROSS SECTIONAL ELEMENTS. CHAPTER 12, Introduction to Transportation Engineering, NPTEL, India. Nitsche, P., Saleh, P., Helfert, M., 2010. State of the art report on existing treatments for the design of forgiving roadsides. Project title: Improving Roadside Design to Forgive Human Errors, Project Nr. 823176, ERA-NET ROAD, Road research in Europe. Pu, S., Rutzinger, M., Vosselman, G., Elberink, S. O., 2011. Recognizing Basic Structures from Mobile Laser Scanning Data for Road Inventory Studies. ISPRS Journal of Photogrammetry and Remote Sensing, 66(6), pp. 28-39. Roos, M., D., Job, S., 2009. Reducing Trauma as a Result of Crashes Involving Utility Poles. Version I, NSW centre for road safety, Roads and Traffic Authority NSW, Australia. StreetMapper 360. http://www.igi.eu/streetmapper.html. (28 Dec. 2014). Wu, B., Yu, B., Yue, W., Shu, S., Tan, W., Hu, C., Huang, Y., Wu, J., Liu, H., 2013. A voxel-based method for automated identification and morphological parameters estimation of individual street trees from Mobile Laser Scanning data. Remote Sensing 5 (2), pp. 584–611. Yokoyama, H., Date, H., Kanai, S., Takeda, H., 2013. Detection and Classification of Pole-like Objects from Mobile Laser
This contribution has been peer-reviewed. The double-blind peer-review was conducted on the basis of the full paper. Editors: S. Oude Elberink, A. Velizhev, R. Lindenbergh, S. Kaasalainen, and F. Pirotti doi:10.5194/isprsannals-II-3-W5-11-2015
16