2017 IEEE 30th International Symposium on Computer-Based Medical Systems
Predicting Comorbidities using Resampling and Dynamic Bayesian Networks with Latent Variables Leila Yousefi1, Lucia Saachi2, Riccardo Bellazzi2, Luca Chiovato3 Allan Tucker1 1
Dept Computer Science, Brunel University, London. United Kingdom 2University of Pavia, Italy; 3 Endocrinology Unit of Instituti Clinici Salvatore Maugeri
[email protected] the 7th Framework Program, Theme ICT--2011.5.2 Virtual Physiological Human (600914). Clinical data from the FSM hospital consisted of demographic information (gender, birth date, time from diagnosis) physical examinations (BMI, blood pressure), and laboratory data, including HbA1c measurements and lipid profile. This covers approximately 1000 patients. We focus on two comorbidities: Disorders of lipid metabolism and non-alcoholic chronic liver disease. These were selected as they occur most commonly within the data. We infer DBNs from the bootstrapped data using the REVEAL [4] algorithm. What is more, we include a latent variable that is connected to all data points and parameterized using the Expectation Maximisation algorithm [5]. It is envisaged that this latent process will capture some of the complex dynamics of the comorbidities and how they interact with the clinical variables. Resampling of the data involves a bootstrap process whereby the original training data is extended by adding bootstrapped pairs of timepoints, t-1 and t. These are selected with replacement where it is ensured that an increased number of positive cases for the chosen complication at time t are selected. The DBNs are trained on this bootstrapped data and tested on their ability to predict the complication at the following time-point, before the latent variables were explored.
Abstract— Comorbidities such as hypertension and lipid metabolism are often associated in diseases such as diabetes, and the early prediction of these is of great value when trying to manage progression. This is the start of a project to model multiple comorbidities in diabetes using dynamic Bayesian networks with latent variables in order to stratify patient cohorts. In this paper, we demonstrate some initial results on a dataset where the class imbalance problem poses an issue due to the rare occurrence of different individual comorbidities on a visit-by-visit basis. This is dealt with using a bootstrap technique that has been specifically designed for longitudinal data where the occurrence of the positive class occurs far less than the negative. Keywords—Diabetes, Latent Variable, Class Imbalance
I.
INTRODUCTION
Type 2 Diabetes Mellitus (T2DM) is the most common form of diabetes, accounting for at least 90% of all cases of diabetes. The World Health Organization (WHO) estimates that by 2030 there will be about 550 million people suffering from this disease [1]. Comorbidities associated with diseases such as diabetes can be complex and difficult to predict, especially when they may be closely coupled, and where interventions can impact their behaviour. A common problem with classifying comorbidities in longitudinal data is that there may be many more visits where the complication does not manifest itself compared to those where it does (due to careful management). This class imbalance problem for rarely occurring cases has been addressed typically by using resampling approaches such as oversampling and undersampling. Bootstrap approaches can also be used to identify the significant statistics from classifiers learnt from such data. In [2] the bootstrap was extended to longitudinal data by sampling consecutive time points, thus enabling the temporal nature of the data to be inferred. In this paper we explore the use of latent variable models for prediction and the early detection of these comorbidities from clinical followups of diabetic patients at the IRCCS Fondazione Maugeri (FSM) hospital of Pavia, Italy. We use Dynamic Bayesian Networks (DBNs), probabilistic graphical models that can model longitudinal data taking into account noise, missing data and uncertainty in the data collection process. We use a variant on the resampling approach in [3] whereby we bootstrap pairs of timepoints but bias the training data selection to ensure more states where the complication is present than in the original data. II.
III. 0.8 0.6
UB hold out BBS
0.4 0.2 0 0
0.2
0.4
0.6
0.8
1
1 0.8 0.6 UB hold out BBS
0.4 0.2
METHODS
0
Here we use data that has been previously collected for clinical and management purposes from 2009 to 2013. The data is part of the MOSAIC project funded by the European Commission under 2372-9198/17 $31.00 © 2017 IEEE 1063-7125/17 DOI 10.1109/CBMS.2017.32
RESULTS
1
0
0.2
0.4
0.6
0.8
1
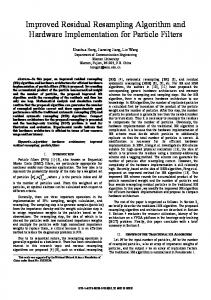
Fig. 1. Classification Area Under Curve (AUC) Comparison for Liver Disease (top) and for Lipid Metabolism (bottom).
205
Figure 1 shows the prediction of the two comorbidities at the subsequent visit. These were based on DBN models that used the original imbalanced data (UB) and DBNs that were trained on the bootstrapped time-series data (BBS). As can be seen, the resulting ROCs varied dramatically for detecting false positives – whilst both methods are very similar for smaller number of true and false positives (bottom left of the ROCs), the DBN results trained on the original data are much closer to random (on the diagonal) for larger numbers of false positives, whereas this issue does not occur in the bootstrapped data. The area on the ROC curve (AUC), the sensitivity and specificity all reflect this issue (in Table 1).
3.5
State Low(1) High(3)
3 2.5 BMI
2
Lipid 1.5
HT Liver
1
Latent
0.5
TABLE 1. ROC Statistics for the sensitivity analysis carried out on DBNs inferred on the original imbalanced data (UB) and on the balanced boostrapped data (BBS)
0 1
11
21
31
41
51
Visit
Liver Disease
3.5
UB AUC:
0.5227 +- 0.04
0.6518 +- 0.05
3
BBS AUC:
0.5809 +- 0.04
0.7141 +- 0.04
2.5
UB Sensitivity:
0.775
0.996
BBS Sensitivity:
0.855
0.891
UB Specificity:
0.394
0
BBS Specificity:
0.178
State Low (1) High (3)
Lipid Metabolism
Lipid 1.5
HT Liver
1
Latent
0.373 0.5
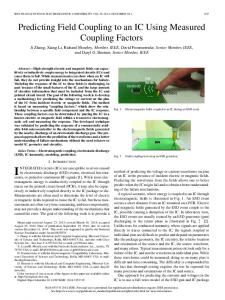
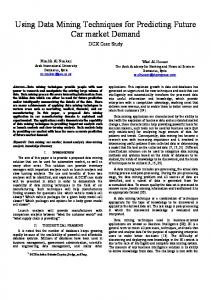
Exploring the behaviour of the latent variable (Figure 2) illustrates a form of refactoring of the data has occurred. The latent variable appears in many cases to have captured a combination of clinical factors and comorbidities where an increase in the probability of latent state 1 (Latent) coincides with the increased likelihood of comorbidities (particularly Lipid Metabolism and Liver Disease comorbidities), and to a lesser degree it is associated with a change in BMI. Figure 2 shows how in two sample patients the probability of latent state 1 is correlated with these factors but with a time shift one visit earlier, highlighting how it can enhance prediction. IV.
BMI
2
0 1 4 7 10 13 16 19 22 25 28 31 34 37 Visit
Fig. 2. Latent variable examples for the two patients based upon the DBN inferred from the bootstrapped data to overcome class imbalance.
REFERENCES [1]
CONCLUSIONS
[2]
In this short paper we have explored the combination of resampling to remove the bias of imbalanced data in time-series with latent variable dynamic Bayesian networks to predict the onset of comorbidities associated with diabetes. We have shown some preliminary results that indicate the resampling procedure can assist in the prediction, and the latent variables can factorise the data into an underlying hidden state that appears to improve the prediction accuracy. Future work will involve exploring the extension of these models with more latent variables to capture a greater variety of factors [6] that characterize key changes in the clinical and complication data. Finally, we intend to use these latent states to help us to identify different cohorts of patients who have different dynamics and therefore stratify them so that more can be understood about the different manifestations of the disease and its progress.
[3]
[4]
[5]
[6]
206
Mathers CD, Loncar D. Projections of global mortality and burden of disease from 2002 to 2030. PLoS Med. 2006;3(11):2011-2030. doi:10.1371/journal.pmed.0030442. van der Heijden, M. Velikova, Lucas, P. Learning Bayesian networks for clinical time series analysis, Journal of Biomedical Informatics 48 (2014) 94-105 Trifonova, N. , Kenny, A. , Maxwell, D. , Duplisea, D. , et al. (2015) 'Spatio-temporal Bayesian network models with latent variables for revealing trophic dynamics and functional networks in fisheries ecology'. Ecological Informatics. doi: 10.1016/j.ecoinf.2015.10.003 Murphy KP, Mian S: Modeling Gene Expression Data Using Dynamic Bayesian Networks. Tech rep, MIT Artificial Intelligence Laboratory. 1999 Bilmes J. A gentle tutorial on the EM algorithm and its application to parameter estimation for Gaussian mixture and hidden Markov models. International Computer Science Institute (ICSI). Technical report TR-97021; 1997. Ghahramani, Z. Jordan, M. Factorial hidden Markov models. Machine Learning, 29:245–273, 1997