Eurographics Workshop on Urban Data Modelling and Visualisation (2016) F. Biljecki and V. Tourre (Editors)
Procedural Generation of Traffic Signs F. C. Taal1 and R. Bidarra1 1 Computer
Graphics and Visualization Group, Delft University of Technology, The Netherlands
[email protected],
[email protected]
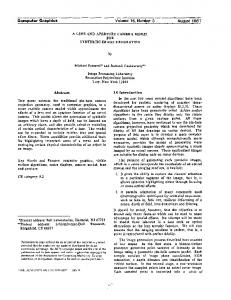
Figure 1: Urban road network with procedurally generated traffic signs
Abstract Procedurally-generated virtual urban worlds typically miss plausible signaling objects on the road network, unless they were manually inserted. We present a solution to the problem of procedurally populating a given urban road network with plausible traffic signs. Our tagged graph approach analyzes the road network using a rule-based reasoning mechanism that represents relevant traffic rules, in order to identify potential sign locations. Eventually, a context-based reduction step helps choose the most suitable candidates, taking into account a variety of real-world rules, and determines their actual place and orientation. We discuss the performance and validation of our approach, and conclude that its generality and flexibility make it a very convenient extension to many procedural urban environment applications. Categories and Subject Descriptors (according to ACM CCS): [Computing methodologies]: Computer graphics—Shape modeling [Computing methodologies]: Artificial intelligence—Knowledge representation and reasoning
1. Introduction The demand for complex 3D virtual environments is steadily increasing. Despite many advancements in procedural modeling methods, the full integration of disparate content (e.g. terrain, buildings and roads) in a complete urban environment, remains error-prone, time-consuming and far from efficient [STBB14]. Among the elements typically missing in most procedurallyc 2016 The Author(s)
c 2016 The Eurographics Association. Eurographics Proceedings
generated virtual urban worlds, are signaling objects on and around the road network. Signaling objects (including traffic signs, markings, traffic lights, etc.) have the purpose to control, direct and inform road users and their behavior. Traffic sign information can be instrumental to improve e.g. the realism and effectiveness of driving simulators, the reliability of driver assistance systems and, in general, road safety. Traffic signs can also play an important role in
F.C. Taal & R. Bidarra / Procedural Generation of Traffic Signs
the domain of traffic model analysis, e.g. to investigate their influence on drivers behavior and safety. Traffic sign placement depends on multiple aspects, including (i) road usage (e.g. drivers, cyclists, pedestrians, public transportation), (ii) road topology (e.g. intersections, complexity), (iii) environmental characteristics (e.g. terrain features, neighboring buildings, points of interest), and (iv) traffic rules (e.g. one/two-way traffic, priority, access permissions, speed limits).
signs, to enable integrating traffic events into their road network [CLC15]. Unfortunately, this predefined information is not available in most road network databases (e.g. OSM and GIS). To the best of our knowledge, the method presented in this paper is the first generic approach to automate the generation of traffic signs on a given road network. 3. General Approach
Almost every concrete road traffic situation is unique, typically resulting in a very wide variety of traffic sign combinations along the roads. This richness of features, makes it a non-trivial and challenging task to automatically determine and place such signs on a an arbitrary road network. In this paper we address the problem of procedurally generating plausible traffic signs given an urban road network, either fictive or inspired in actual road network databases, such as OpenStreetMap (OSM) [Con16] or other Geographic Information Systems (GIS), which typically lack any traffic sign information. We present a tagged graph-based approach that determines which traffic signs should be placed where on a given road network using, among other information, road and network features, including its topology and its geometry. Our approach analyzes the whole road network, in order to determine potential locations for traffic signs and, ultimately, choose where and how to place which signs. For this, a rule-based reasoning system, representing relevant traffic rules, was developed and integrated with an efficient graph traversal and tagging mechanism. 2. Related Work Many procedural modeling methods have been proposed to create terrain, vegetation, buildings and roads for urban environments [STBB14]. Specifically for roads, a variety of techniques have been proposed, all concentrating on the design of the road, including example-based methods [NGDA15], tensor fields [CEW∗ 08], graph-based methods [SEBC15], declarative methods [STdB11], optimization methods [GPMG10] and rule-based methods [TSBK09] to create large complex road networks. Other methods use GIS input data to create realistic road networks for traffic simulation [WSL12, CPP15]. However, the inclusion of road environment elements such as road signs has not been approached by such methods, and little research results can be found, particularly on the generation of traffic signs. Several methods have been described for the detection, recognition and classification of traffic signs [FCF03, BCM∗ 07, TZVG14] or traffic lights [FU11], based on photographic (e.g. Google Street view) or video (e.g. self-driving vehicle camera) input data. These example-based methods thus focus on the perspective of the road user. To some extent, such methods are able to extract correct information about traffic signs already placed in a real-world environment. However, by definition, these methods are unable to take on a fictive environment, and insert in it fitting and plausible signs at appropriate places. A road design method explicitly aimed at driving simulators, proposed a semantic model with predefined locations for traffic
Our approach aims at automatically generating plausible traffic signs into a given road network. It consists of three phases: road network preprocessing, tagged graph analysis, and actual content creation; see Figure 2 for its general pipeline. In the first phase, the road network input data has to be converted into a suitable tagged graph structure, in which each edge represents a road segment, and each node represents the connections and intersections among those segments, at a given location. In addition, any relevant road characteristics (like road category, one- or two-way, etc.) are processed and captured in tags of the graph edges and nodes. This graph structure faithfully preserves both the topology, the geometry and the features of the input road network. In the second phase, the tagged graph has to be analyzed in order to determine where potential signs can be placed. In this analysis, a central role is played by the notion of candidate, which indicates that a given graph node could potentially carry a particular traffic sign. A candidate is represented by a sign tag attached to that graph node. This phase involves three steps: identification of candidates, reduction of candidates, and determination of the actual location and orientation for the remaining candidates. Identification of candidates: for the vast majority of candidates, their identification is performed by traversing the tagged graph, analyzing the tags on each node and edge and, whenever appropriate, attaching to it the corresponding sign tag. For example, upon arrival of a road at a one-way T-splitting, one might put a sign tag on that edge stating ‘obligatory turn left’. As we will see, different categories of traffic signs typically require a specific kind of graph analysis. Reduction of candidates: the identification of candidates above will inevitably produce some redundancy among the sign tags. For example, on a long street, it is not necessary to remind its speed limit at each intersection. In this reduction step, redundant sign tags are identified and removed. This removal has to be performed taking the context into account, in order to carefully decide which sign tags to leave where, and why, without loosing any relevant information. Making this informed choice will only be possible after all redundant information has been put in place, in the previous step. Sign placement: for the sign tags that remain, the definitive location and orientation of the traffic sign can be determined. Depending on the context and on the sign tag semantics, the location can be at the intersection (e.g. roundabout sign), at the beginning of the road (e.g. speed limit sign) or before the intersection (e.g. obligatory turn direction). Similarly, the traffic sign c 2016 The Author(s)
c 2016 The Eurographics Association. Eurographics Proceedings
F.C. Taal & R. Bidarra / Procedural Generation of Traffic Signs
Figure 2: General pipeline of our approach
orientation will be determined relative to the nearest intersection as towards or outwards. The last phase deals with the creation of the actual traffic sign content for the virtual world. Here, one has to take into account not only the shape, texture, size and height of each traffic sign, but also to deal with merging of signs on the same post, possibly back to back. At the end of this phase, a road network with plausible traffic signs has been generated. 4. Methods In this section we describe each of the phases of the general approach introduced above, including some algorithms of the methods developed. In our prototype system implementation, we used OSM data as input road network, for which we developed a dedicated preprocessor, described in the next subsection. The remaining modules, however, are fully generic and OSM-independent.
• nodes: a graph node represents a point on the earth’s surface, and it contains, at least, an ID and the point coordinates. • edges: an edge represents a connection between two nodes. For convenience, we will distinguish a few types of edges, each one with its own attributes (see Table 1). • ways: a way consists of a sequence of consecutive edges of the same type which have a common and specific meaning. Ways are, thus, convenient aggregations of graph entities, representing either line entities, such as a road and a bike lane, or area entities, such as a park or a museum, in which case the edge sequence is closed. A way can have multiple tags describing relevant features. • tags: a tag is a pair in the form that is attached to a graph entity (node, edge or way), e.g. or . Tags are extensively used to describe a particular attribute of an entity, or its meaning. 4.2. Candidate identification
4.1. Preprocessing The purpose of the preprocessing phase is to convert road network input data into our tagged graph structure. In our prototype, we have implemented a preprocessor for OSM input data, which uses XML format. OSM represents many physical elements of the real world (e.g. roads, buildings, areas) using basic data entities (e.g. nodes, ways, relations) with attached tags, to describe the respective geographic attributes. We process this input data in order to populate the tagged graph with the following elements:
Edge type Streetedge
Path Waterway Railway Area
Attributes speed, direction, width, street type, rank type of path type of waterway type of railway, number of tracks type of area
Examples motorway, primary, living street, service cycle way, bridle way, footpath river, canal, stream tram, rail, lightrail, subway industrial, parking lot, house, building, park
Table 1: Different types of edges, and their specific attributes c 2016 The Author(s)
c 2016 The Eurographics Association. Eurographics Proceedings
Despite the large variety of traffics signs, many of them can be grouped according to common properties, e.g. due to being dependent on the same road feature. For the purposes of candidate identification, we subdivided sign tags into eleven categories; see Table 2. In addition to their category, sign tags also contain a signID derived from [Gov16], and an edge reference, indicating the graph edge to which the traffic sign is related.
Category Speed User Access Road type Restrictions Priority Geometry Direction Crossing Parking Point of interest Other
Examples maximum speed, traffic calming no access for tractors, bicycles cycle path, footpath, motorway overtaking, maximum height, width priority of the road, give way, stop narrow road, sharp bend, incline one/two-way, drive direction crossing roundabout, level crossing, zebra no parking, parking places direction to hospital, recreation, cemetery road condition, warning for animals
Table 2: Categories of sign tags, with some examples of the corresponding traffic signs
F.C. Taal & R. Bidarra / Procedural Generation of Traffic Signs
For most categories (Speed, User access, Road type, Restrictions, Priority, Geometry, Crossing and Parking), the identification of candidates takes into account the tags on the nodes and edges as the graph is traversed, hereby considering the differences in road characteristics. A high level overview of the Candidate Identification process is shown in Algorithm 1. For the detection of a sharp curve in a way, the total angle between successive streetedges is computed. For traffic signs in the category ‘Point of interest’, a separate flooding algorithm is used to find for them appropriate locations along main intersections within a certain range of the point of interest. To determine disallowed driving directions around an intersection, the directions of the the node’s streetedges (ingoing, outgoing or two-way) are analyzed together with the angles among them, after which the corresponding sign tags can be generated; see Algorithm 2. Algorithm 1 Candidate Identification Input: Tagged graph Output: Tagged graph with sign tags for each node in the tagged graph do Existing node tags determine sign tags for all edges adjacent to node do Existing edge tags determine sign tags Comparison of edge attributes (speed, rank and edge type) determines sign tags if #streetedges in edges > 2 then Perform Intersection Identification (Algorithm 2) to determine sign tags around this node end if end for end for for each way consisting of ‘streetedges’ do Check for sharp curves and possibly add sign tag end for for each way indicating a point of interest do Determine sign tag locations with flooding algorithm end for
4.3. Candidate Reduction At the end of the process of candidate identification, it is likely that some sign tags are redundant or somehow included in others. In the Candidate Reduction step, we detect such cases using a variety of reduction rules, based on common sense as well as on current traffic regulation [Gov15]. This allows us to handle many complex traffic situations, as they occur in the real world. They can be grouped into the following three main reduction cases (see Algorithm 3): Topological cases: involve traffic situations which span over multiple separate intersections with nodes and one-way streetedges, and are not explicitly represented as one complex entity in the tagged graph. As a consequence, many of those individual intersection nodes will receive redundant sign tags, from the previous step. These cases include roundabouts, cycle ways near a roundabout, large intersections and intersection with tram or cycle way.
Algorithm 2 Intersection Identification Input: node (with its ‘streetedges’) Output: node with sign tags if edges adjacent to node have tag ‘roundabout’ then Add ’roundabout’ and ’give way’ sign tags to node else Separate ‘streetedges’ according to direction: ingoing I, outgoing O, two-way T if #streetedges is 3 then Determine type of intersection based on angles among ‘streetedges’: T-split, Y-split, other split Determine direction sign tags according to type and direction else if #streetedges > 3 then Determine direction sign tags according to amount of O+T ‘streetedges’ and angles among them end if end if
Node cases: identify a redundant sign tag on a node among all its other nodes. An example of this is inclusion of a sign tag by another, e.g. a ‘livingstreet’ includes a maximum speed of 15 km/h, and redundant ’speed’ sign tags due to common speed limits in the built-up area. Single road cases: identify repeated sign tags on a sequence of streetedges with the same street name, defined as single road. 4.4. Sign Placement The definitive traffic sign location and orientation for the remaining sign tags depend on the sign type. Signs giving a warning or pre-indication have to be placed at the berm, way in advance of an intersection; the orientation is then outwards (out) of the intersection. Other signs give information about the intersection or road ahead and should be placed at the side of the road almost on the intersection; in such cases, the orientation can be either outwards (out) or towards (in) the intersection. For most sign tags, they are first classified (as either before-out, on-out, on-in). The exact position of the traffic sign is then computed based on 1) the driving direction(s) of the way from the node, 2) the width of the way, 3) two corresponding offsets (longitudinal and transversal), and 4) the position of the node. Special cases, such as the location of a point of interest sign or the location for the driving direction sign on a roundabout, have to be handled separately. 4.5. Content Creation In the last phase, sign tags are converted into actual traffic signs, at the given location, by determining their shape, texture, size and height. Possible shapes are round, triangle, rectangle, square, diamond or octagon. Sign sizes are chosen for each shape, dependent on the maximum speed of the way they are in, according to the current traffic regulations [Gov15]. When there are multiple sign tags roughly on the same location, they can be merged onto the same post. In that case, depending on c 2016 The Author(s)
c 2016 The Eurographics Association. Eurographics Proceedings
F.C. Taal & R. Bidarra / Procedural Generation of Traffic Signs
Algorithm 3 Candidate Reduction Input: Tagged graph with sign tags Output: Tagged graph with reduced amount of sign tags for each Topological case do if Roundabout then Remove all sign tags except give way and roundabout indication else if Separate cycle way near roundabout then Remove sign tag for cycle way warning Add zebra sign tag with sub sign of crossing bikes Remove road type sign tags for cycle way between the 2 streetedges else if Large intersection then Remove all sign tags related to the short edges of the intersection Add right passage direction sign tags else if Intersection with tram then Remove all sign tags related to the short edges of the intersection else if Intersection with separate cycle way then Remove warning sign tags for cycle way end if end for for each Node case do Remove all 50 limit speed sign tags if node has also 30 limit sign tags {built-up area} Remove speed sign tags if node contains road type sign tag for living street, motorway or trunk, or node contains priority sign tag {Inclusion} end for for each Single road case do Remove duplicates and repeated sign tags end for
their amount, type and orientation, they may have to be stacked, split and/or attached back to back. Whenever stacking takes place, the sign post height is adjusted accordingly, as shown in the example of Figure 1. A more complete and comprehensive impression of the algorithms, results and content of our prototype system, including an illustrative video with a walk-through, can be found elsewhere [Taa16]. 5. Results To evaluate the performance of our approach, we selected from OSM five map regions of different sizes, and measured both the size of the tagged graph structure generated, and the execution times taken by the algorithms in the different phases of the approach: Preprocessing, Candidate Identification, Candidate Reduction and Sign Placement (Table 3). We omit Content Creation, as it is very much dependent on the quality desired for the output geometric models. Total execution times for our method range from far less than a second (TU Delft campus) up to 29 seconds, for a whole city (12km × 7km). These execution times grow roughly linearly with the area of the map and the corresponding amount of nodes and edges. c 2016 The Author(s)
c 2016 The Eurographics Association. Eurographics Proceedings
One of the most computationally expensive steps of the algorithm is the Preprocessing, partly (35%) due to the creation of an auxiliary quadtree structure, but mainly (60%) due to the classification of the input edges (in our case, OSM ways) into the different types of graph edges (see Table 1). The Reduction step becomes more expensive the more roundabouts and large crossings are involved in the road network, due to the inherent complexity of both their detection and handling procedures in the tagged graph. In order to validate our approach, we took map samples for a variety of traffic situations (Figure 3), and compared the output of our procedural generator to the actual traffic signs at those locations, in the real word (Table 4). Understandably, it is not viable to make this comparison for a whole neighborhood or city. However, more comprehensive validation results are available [Taa16]. We analyzed the disparities found and concluded that they can be attributed to 5 main causes: 1. sign was not generated due to missing information in the OSM input data (e.g. ’no parking’ zone unaccounted for); 2. sign was not generated due to inconsistent practice of road authority in the real world (e.g. placing both a speed limit sign of 70 and a priority sign, while the latter includes the former); 3. sign was abusively generated, due to incorrect information in the OSM input data (e.g. road is represented as 2 separate one-way roads, instead of a two-way road); 4. sign was abusively generated, due to inconsistent practice of road authority, or due to accidents, vandalism, etc. (e.g. placing in one case a ’give way’ sign when leaving a roundabout, and in another case, not); 5. sign was abusively generated, due to a deficiency in the sign tag reduction algorithm. The traffic signs that were incorrectly generated due to missing or incorrect information in the OSM input data put in evidence the disadvantage of using an open source database in which human errors are unavoidable. Likewise, the disparities regarding the inconsistency of road authority practice, are a consequence of human intervention. Road management authorities may use multiple interpretations of existing sign placement rules, when deciding which criteria to apply at each traffic situation. Therefore, different decisions may be made by different people for analogous situations, which could result in inconsistent sign placement practice. Furthermore, these interpretations are difficult to cast into concrete clear rules. The lack of concrete rules, not only representing interpretations of road authority, but also clarifying whether a sign should be placed or not, caused the disparities of missing rules in the reduction algorithm. Clarifying these sign placement rules will improve the correctness of the approach.
Figure 3: Different traffic situations (from left to right): Simple roundabout (A), Big crossing (B), Crossing with tram (C)
F.C. Taal & R. Bidarra / Procedural Generation of Traffic Signs
Size (m)
Region
TU Delft Pijnacker Delft South Delft Rotterdam
1489 × 889 2984 × 1779 5967 × 3537 6430 × 6113 11967 × 7105
# nodes
# edges
8403 38624 187992 339103 627868
9694 50706 242311 435754 806696
# traffic signs Pregenerated processing 587 907 7189 12339 26916
162 748 3712 6930 11807
Execution time (in ms) Candidate Candidate Sign IdentifiReducPlacecation tion ment 72 7 36 317 36 52 895 612 335 1579 2047 565 3105 12853 1256
Total
277 1153 5554 11121 29021
Table 3: Dimensions of input regions and their tagged graph sizes, amount of generated traffic signs and execution times
case
real
A B C
33 13 11
total 38 14 12
# (in)correct signs generated correct Err1 Err2 Err3 Err4 26 6 1 1 6 10 2 1 0 1 8 3 0 0 3
Acknowledgments Err5 5 3 1
We thank Pedro Silva and his colleagues for making Sceelix [Sce16] available for this project and promptly helping us out in all possible ways.
Table 4: Comparison of real world versus generated traffic signs for the traffic situations of Figure 3
References
6. Conclusion
[CEW∗ 08] C HEN G., E SCH G., W ONKA P., M ÜLLER P., Z HANG E.: Interactive procedural street modeling. ACM transactions on graphics (TOG) 27, 3 (2008), 103. 2
We presented a novel approach to automatically generate plausible traffic signs for a given road network. We use a tagged graph to represent the road network data, including a variety of road characteristics, and to analyze the topological structure and the semantics of its junctions and intersections. These features are found to be determinant in deciding on the appropriateness and concrete location for each traffic sign. The process of first identifying on the graph all possible candidates for a traffic sign, and then reducing their amount due to a context-based analysis of sign inclusion and redundancy, combines both local and global criteria into an integrated procedural solution. We also describe some details of our implementation, for which we used road network input data from the OpenStreetMap database, and discuss with several examples the performance and the validity of this approach. Using such real-world data as input has the advantage of allowing a comparison of our output signs with those at the actual location. However, it also brings to light inconsistencies in the road network data due to (e.g. crowd-sourcing) human errors. In addition, we also realized that actual road management authorities use multiple interpretations of existing sign placement rules, when choosing which criteria prevails at each situation (e.g. conflicting infrastructures, visibility and traffic complexity). It is hard to cast these interpretations into concrete clear cut rules in an algorithm. In our tests, only a small amount of signs that were abusively generated is due to deficiencies in our sign tag reduction algorithm. In the future, it would be interesting to handle more points of interest in a broader, context-sensitive way, as well as to include specific direction signs for bicycle and pedestrian routes. Despite being an important contribution to a realistic urban traffic environment, we expressly chose not to handle traffic lights, road markings nor zebra crossings, as they have a very explicit impact on the content to be created, including textures and geometric models, which did not have our main focus.
[BCM∗ 07] B ROGGI A., C ERRI P., M EDICI P., P ORTA P. P., G HISIO G.: Real time road signs recognition. In Intelligent Vehicles Symposium, 2007 IEEE (2007), IEEE, pp. 981–986. 2
[CLC15] C AMPOS C., L EITÃO J., C OELHO A.: Integrated modeling of road environments for driving simulation. In 10th International Conference on Computer Graphics Theory and Applications, Berlin (2015). 2 [Con16] C ONTRIBUTORS O.: Open source database openstreetmap. www.openstreetmap.org, 2016. Accessed: 1 November 2016. 2 [CPP15] C URA R., P ERRET J., PAPARODITIS N.: Streetgen: In-base procedural-based road generation. ISPRS Annals of Photogrammetry, Remote Sensing and Spatial Information Sciences 1 (2015), 409–416. 2 [FCF03] FANG C.-Y., C HEN S.-W., F UH C.-S.: Road-sign detection and tracking. Vehicular Technology, IEEE Transactions on 52, 5 (2003), 1329–1341. 2 [FU11] FAIRFIELD N., U RMSON C.: Traffic light mapping and detection. In Robotics and Automation (ICRA), 2011 IEEE International Conference on (2011), IEEE, pp. 5421–5426. 2 [Gov15] G OVERMENT T.: Administrative provisions for road traffic order (babw). wetten.overheid.nl/BWBR0009104/ 2015-04-01, 2015. Accessed: 1 November 2016. 4 [Gov16] G OVERMENT T.: Overview of traffic signs in the Netherlands. verkeersbordenoverzicht.nl/, 2016. Accessed: 1 November 2016. 3 [GPMG10] G ALIN E., P EYTAVIE A., M ARCHAL N., G UÉRIN E.: Procedural generation of roads. Computer Graphics Forum: Proceedings of Eurographics 2010 29, 2 (May 2010), 429–438. 2 [NGDA15] N ISHIDA G., G ARCIA -D ORADO I., A LIAGA D.: Exampledriven procedural urban roads. In Computer Graphics Forum (2015), Wiley Online Library. 2 [Sce16] S CEELIX:. www.sceelix.com, 2016. Accessed: 1 November 2016. 6 [SEBC15] S ILVA P. B., E ISEMANN E., B IDARRA R., C OELHO A.: Procedural content graphs for urban modeling. International Journal of Computer Games Technology 2015 (2015), 10. 2 [STBB14] S MELIK R. M., T UTENEL T., B IDARRA R., B ENES B.: A survey on procedural modelling for virtual worlds. Computer Graphics Forum 33, 6 (2014), 31–50. 1, 2 c 2016 The Author(s)
c 2016 The Eurographics Association. Eurographics Proceedings
F.C. Taal & R. Bidarra / Procedural Generation of Traffic Signs [STdB11] S MELIK R. M., T UTENEL T., DE K RAKER K. J., B IDARRA R.: A declarative approach to procedural modeling of virtual worlds. Computers & Graphics 35, 2 (April 2011), 352–363. 2 [Taa16] TAAL F.: Procedural Generation of Traffic Signs. Master’s thesis, Delft University of Technology, September 2016. graphics. tudelft.nl/fieke-taal. Accessed: 1 November 2016. 5 [TSBK09] T UTENEL T., S MELIK R. M., B IDARRA R., K RAKER K. J. D .: Using semantics to improve the design of game worlds. In Proceedings of AIIDE 2009 - 5th Conference on Artificial Intelligence and Interactive Digital Entertainment (Stanford, CA, oct 2009). 2 [TZVG14] T IMOFTE R., Z IMMERMANN K., VAN G OOL L.: Multi-view traffic sign detection, recognition, and 3D localisation. Machine Vision and Applications 25, 3 (2014), 633–647. 2 [WSL12] W ILKIE D., S EWALL J., L IN M. C.: Transforming GIS data into functional road models for large-scale traffic simulation. IEEE Transactions on Visualization and Computer Graphics 18, 6 (2012), 890–901. 2
c 2016 The Author(s)
c 2016 The Eurographics Association. Eurographics Proceedings