PROCESS ENGINEERING JOURNAL 1 (2017) 10–18
Process Engineering Journal http://process-eng-j.webs.com/
Computational and experimental sonochemistry Slimane Merouani a,b *, Oualid Hamdaoui a Laboratory of Environmental Engineering, Department of Process Engineering, Faculty of Engineering, Badji Mokhtar – Annaba University, P.O. Box 12, 23000 Annaba, Algeria b Laboratory of Environmental Process Engineering, Department of Chemical Engineering, Faculty of Process Engineering, University of Constantine 3, 25000 Constantine, Algeria a
ARTICLE INFO
ABSTRACT
Article history:
Sonochemistry is an environmentally friendly area of chemistry where chemical reactions are
Received 5 March 2017
induced by ultrasound waves in the frequency range of 201000 kHz. Sonochemistry is one of the
Received in revised form 10 April
innovative advanced oxidation processes in which hydroxyl radical and other reactive species are
2017
generated through acoustic cavitation phenomenon. The implosion of bubbles creates hot spots
Accepted 10 April 2017
with temperatures as high as 5000 K, pressures up to 1000 atm and cooling rates in excess of 10 10 K/s. These extraordinary conditions are responsible for a variety of chemical and physical effects,
Keywords: Sonochemistry Acoustic cavitation Hydroxyl radicals Organic pollutants
i.e. production of free radicals, emission of light (sonoluminescence) and generation of shock waves. In this paper, a computational study based on acoustic cavitation model for reactive bubbles has been used for stating the conditions inside the collapsing bubbles and then approaching the mechanism of free radical production in aqueous sonochemistry. After this, experimental results on sonochemical oxidation of several kinds of organic pollutants have been presented and discussed on the basis of the computational results.
© 2017 Process Engineering Journal.
1. Introduction Access to fresh, clean and uncontaminated water is recognized as a universal need for all societies. This, combined with the global requirement to protect our environment, continuous to motivate a legislative drive toward more stringent limits on the amount of pollutants present in industrial wastewater discharges. This new legislation is forcing de-pollution measures and in order to meet this challenge, industrial demand has grown for innovative and improved water treatment methodologies for both disinfection and pollution removal. Recent developments in the field of water treatment have led to an improvement in oxidative degradation procedures for recalcitrant organic compounds dissolved in aquatic media, in applying advanced oxidation processes (AOPs). AOPs can be broadly defined as aqueous phase oxidation methods based on the intermediacy of highly reactive species such as hydroxyl radicals (HO● ). Thanks to its high standard oxidation potential of 2.8 V vs. NHE, these radicals are able to oxidize, with rate constants usually
in the order of 106 to 109 mol/L⸱s, and mineralize partially or totally almost all organic compounds [1]. The most commonly applied AOPs range from Fenton’s oxidation and ozone to ultraviolet (UV) light, photocatalysis, UV/H2O2 and a combination of these processes [2]. Sonochemical reactions have been successfully employed for the degradation of various kinds of pollutants including phenols, pharmaceuticals and personal care products, endocrine disrupting chemicals and dyes [3–6]. Sonochemistry is an innovative APOs that is usually applied with ultrasound frequency in the range of 20 kHz1 MHz [5]. Ultrasound propagation in aqueous solution generates highly oxidative environment through the production of hydroxyl radical and others reactive species via the themolysis of water vapor inside the collapsing bubbles and their subsequent reactions [7,8]. One advantageous of sonochemistry compared to the other AOPs is that it is efficient toward the degradation of both volatile and nonvolatile pollutants. The sonochemical activity is strongly sensitive to the experimental conditions such as frequency, acoustic intensity, nature of the dissolved gas, liquid temperature and solution pH [9–14]. Additionally, it may be enhanced or
* Corresponding author. E-mail address:
[email protected] © 2017 Process Eng. J. Process Engineering Journal is licensed under a "Creative Commons Attribution-NonCommercial 4.0 International License (CC BY-NC 4.0)".
PROCESS ENGINEERING JOURNAL 1 (2017) 10–18
inhibited by additives, i.e. salts and organic matter, as all other AOPs. However, sonochemistry was found as a promising technique for the degradation of pollutants in complex matrices where the sonochemical activity was almost enhanced or, at last, not affected by the water matrix components [15–17]. In this paper, after a brief presentation of the theory of sonochemistry, a computational study based on acoustic cavitation model has been given for approaching the mechanism of free radicals production in aqueous sonochemistry. Hereafter, some experimental results on sonochemical degradation of various organic pollutants in water have been presented and discussed.
11
of water sonolysis and it is believed that it is formed from the selfrecombination of HO● and HO2● at the bubble solution interface [24]. An additional phenomenon, sonoluminescence (SL), is also induced during ultrasonic irradiation and has previously been used to probe the conditions within the bubble and to determine the size of active bubbles [25,26]. Suslick and coworkers compared the observed spectra of SL from silicon oil with synthetic spectra modeled after known rotational and vibrational spectra of similarly excited diatomic emissions and found the effective cavitation temperature to be approximately 5000 K [25]. The same research group have also investigated the SL spectra of metal carbonyls and have used this information to determine effective local pressure of approximately 1700 atm [25].
2. Theory of sonochemistry Since 1962, it has been recognized that propagation of an ultrasonic wave in aqueous solution containing a solute can results in an oxidation process, which is called sonochemistry [18]. Besides this process, it was well established that H2O2 and H2 are the main products of pure water sonolysis [19]. The chemical effect of ultrasound does not arise from the direct interaction between acoustic wave and water but it produces upon the so-called acoustic cavitation phenomenon, that is, the formation growth and violent collapse of transient microbubbles filled with gas and water vapor under the action of ultrasonic irradiation of liquids (Fig. 1) [20]. The rapid collapse (several nano- or microseconds) of cavitation bubbles is nearly adiabatic, rendering each individual bubble a microreactor, inside which temperatures of the order of 5000 K and pressures of about 1000 atm have been shown to exist [21]. As a result, water vapor entrapped inside a bubble is dissociated into H● and HO● radicals, and with other species present, various other reactive entities such as HO2● and O may form [22]. Parallel reaction pathways exist where volatile solutes may evaporate into the bubble and be pyrolyzed by the high core temperatures [5]. The radical species produced can recombine, react with other gaseous species present in the gas phase, or diffuse into the bulk liquid surrounding the bubble to serve as oxidants [5]. Reactions involving free radicals can occur within the collapsing bubble, at the liquid interface, and in the surrounding liquid [5]. Accordingly, the sonochemical degradation of an organic compound can occur in gas-phase pyrolysis and oxidation for volatile substrates and by reaction with HO● radicals at the bubble/liquid interface and in the aqueous phase for nonvolatile substrates [23]. H2O2 was observed as a species
Fig. 1 Acoustic cavitation dynamics.
3. Computational sonochemistry Several mathematical models have been delivered for modeling the free radicals production in aqueous sonochemistry. Because sonochemistry originates from acoustic cavitation, all available models started practically from an isolated spherical bubble trapped in acoustic field at known frequency and acoustic amplitude (or intensity). Additionally, all reference models were originated from the Relight-Plesset (RP) [27] that describes the comportment of hydrodynamic cavitation bubble. Several modifications on the RP equation have been made to include chemical reactions, mass and heat transfer, radiation energy, etc. [28–30]. However, our research group has recently established a simple model that provides reference results in sonochemistry, i.e. estimation of the bubble temperature using HO● as a probe, interpretation of the effects of gases, frequency, acoustic power, liquid temperature on the sonochemical reaction, prediction of the active bubble population in acoustic cavitation field at different conditions, illustration of the mechanism of the sonochemical production of hydrogen, etc. [21,22,31–35]. This model combines the bubble dynamics (described by the Keller-Miksis equation, Eq. (1)) with a chemical kinetics model consisting of complex reaction mechanisms (83 reversible reactions for air bubble and 25 for oxygen, hydrogen and argon bubbles [22]) with the assumption of isothermal expansion and adiabatic collapse and neglecting mass and heat transfers across the bubble wall. This model will be adopted here for predicting the conditions of the bubble collapse and modeling the production of free radicals. The basic equations of the model are regrouped in Table 1. Fig. 2(a)-(b) shows the evolution of the bubble radius and the corresponding bubble wall velocity during the oscillation of an air bubble in water upon a driving frequency of 1 MHz and an acoustic intensity, Ia = PA2/Lc, of 2.5 W/cm2. Under the action of the sound wave, the bubble expands from an ambient bubble radius of 1.4 µm, which is the typical value at 1 MHz [31], during the rarefaction phase and reached a maximum of 4.8 µm after 0.6 µs of oscillation. Then, the bubble violently collapses during the compression phase of the sonic wave up to a minimum of 0.46 µm at ~ 0.841 µs and expand again. Such behavior is in concordance with that demonstrated experimentally [36,37]. The bubble wall velocity reacts simultaneously with the bubble radius and abruptly increased up to 175 m/s at the end of the bubble collapse (~ 0.841 µs). As a result, the bubble pressure and temperature increased suddenly showing
12
0
(1)
(2) P( t ) p PA sin( 2πft )
R Pressure in the bubble: p Pv Pg 0 0 Rmax
3
R max R
(3) (4)
3( γ 1 )
Reaction rates: ri
Xk ]
υ' ki
K kr i [ k 1
Xk ]
Ea Reaction constants: k f i A f iT exp Rg T Ea k r i Ar iT b exp Rg T bf i
ri
fi
ri
υ''ki
0.8
1
Bubble wall velocity (m/s)
(B) 100
0 -100 -200 0
0.2
0.4 0.6 Time (µs)
0.8
1
(C)
1000 100 10
1 0.1
0.01 0.2
0.4 0.6 Time (µs)
0.8
1
5000
(D)
4000 3000 2000 1000 0 0
0.2
0.4 0.6 Time (µs)
3γ
R Temperature inside the bubble: T T max (5) R Chemical kinetics dn I Production rate of the kth species: w k k ( υ' ' ki υ' ki )ri (6) Vdt i 1 k =1,…, K (number of species), i =1, …, N (number of reactions) K kfi [ k 1
0.4 0.6 Time (µs)
0.8
1
Fig. 2 Bubble dynamics and bubble temperature and pressure as function of time for one acoustic cycle upon a driving frequency of 1 MHz and an acoustic intensity of 2.5 W/cm2.
1000
1.35 Number of moles
End of the bubble collpase
Bubble radius 100
(7)
1.25
N₂ H₂O
1.15
O₂
(8) (9)
The production of free radical by ultrasound is strongly sensitive to the operating parameters. Fig. 4 showed the effect of acoustic intensity and liquid temperature on the production rate of the oxidants formed in the bubble at 1 MHz. The effect of frequency is depicted in Fig. 5. As can be observed, the production rate of the oxidants increased significantly with increasing acoustic intensity at low levels; however, a plateau tends to occur for higher intensities (> 2.5 W/cm2). Similar shape has been reported by Mark et al. [44] in aqueous solution using terephtalate dosimetry. Correspondingly, excepting O atoms, an optimum liquid temperature for the production of the oxidants is observed at 30 °C, which is in good agreement with that reported for an oxygen bubble [8]. The production rate of the oxidants decreases significantly with
HNO₂
10
1.05 0.95
1 H
0.1
0.85
NO
OH
O
0.75
H₂
NO3 0.01
H₂O₂
HNO
0.65
HO₂
0.55 N₂O
0.001 HNO3 0.0001 0.835
Bubble radius (µm)
2σ R 4μ R R
-4
0.2
200
Number of moles 1017
pB p
-2
1
0
Temperature inside the bubble (K)
2 R 3 R 1 R R d 1 c R R 2 1 3c R ρ 1 c c dt p B P( t ) L
2
2
0
Bubble dynamics
(A)
3
Table 1 Basic equations of the model.
4 Bubble radius Acoustic pressure
4
Acoustic pressure (atm)
5
0
Pressure inside the bubble (atm)
peaks at the end of the bubble collapse with a maximum of 4350 K and 1200 atm, respectively (Fig. 2(b)−(c)). These conditions automatically drive chemical reactions in the bubble as shown in Fig. 3. The chemical reactions take place in quick time (0.008 µs) at around the end of the bubble collapse for temperatures higher than 1000 K. Water vapor, O2 and N2 are consumed and several products are formed. At the conditions of the simulation, the main formed products are HNO2, HO● , H2, O and NO and at lesser extent H● and HO2● . All other species exist in trace. The amount of each species increased with the bubble temperature up a maximum value at around the end of the bubble collapse. As seen, the main radical species formed in the bubble is the hydroxyl radical. This statement is observed over a wide range of simulation conditions as can be consulted in our previous published reports [22,32,38,39]. It should be noted that products of water sonolysis such as HNO2 and H2 have already been quantified experimentally in several reports [40,41] whereas radicals (HO● , H● and HO2● ) are identified using ESR spin-trapping [42] and quantified by several dosimetries [24,43,44].
Bubble radius (µm)
PROCESS ENGINEERING JOURNAL 1 (2017) 10–18
0.837
0.839
0.841
O3
0.45
0.35 0.843
Time (µs)
Fig. 3 Reactions evolution inside the bubble at around the end of the bubble collapse, for the same condition as in Fig. 1. The vertical axis is in logarithmic scale.
13
20 C, 1 atm 10
Production rate x 10+11 (mol/s)
OH
O 1
20 kHz 500 kHz 1000 kHz
-10
10
-12
10
-14
10
-16
HO
O
Maximum temperature (K)
O3
0.0001
Production rate x 10+11 (mol/s)
100
1
1.5
2 2.5 3 Acoustic intensity (W/cm2)
3.5
4
(B) 2.5 W/cm2, 1 atm Total
10 O
OH
1
HO₂
0.8
4000
0.6
3000 0.4
2000
0.2
(A)
1000
0
0 0.5
1
1.5 2 2.5 3 Acoustic intensity (W/cm2)
3.5
4
5000
1
4000
0.8 Tmax Vapor fraction
3000
0.6
2000
0.4
1000
0.2
(B)
0
0
10
20 30 40 Liquid temperature ( C)
50
60
8000
1 0.8
6000
0.6 4000 0.4
Tmax Vapor fraction
2000
(C) 0
0.2 0
0
0.1
3
1
0
Maximum temperature (K)
0.5
O
2
Tmax Vapor fraction
5000
HO₂
0.001
2
6000
0
H₂O₂
HO 2
Fig. 5 Effect of frequency on the production rate of the oxidants created inside an air bubble at 2.5 W/cm2, 20 °C and 1 atm (R0 = 7.5 µm for 20 kHz, 3 µm for 500 kHz and 1.4 µm for 1000 kHz [31,45]).
0.1
0.01
HO
Vapor fraction
Total
10
-8
Vapor fraction
(A)
-6
10
Maximum temperature (K)
100
10
Vapor fraction
increasing frequency in the interval 20 kHz 1 MHz. Nevertheless, the difference between 500 and 1000 kHz is less remarkable than that of 20 kHz and either 500 or 1000 kHz. These findings may be interpreted on the basis of many dynamics factors, i.e. the maximum bubble temperature and pressure attend at the collapse, the amount of the trapped water vapor and the collapse duration. Based on the results of Fig. 6 and Table 2, it can be observed that increasing acoustic intensity leads to increasing both the bubble temperature and the amount of the trapped vapor. This favors higher dissociation of water vapor molecules to free radicals. Moreover, reactions inside the bubble have enough time to evolve as the collapse time increased with increasing the intensity (Table 1) (the proportionality between the reaction time and the collapse duration was established in Ref. [38]). On the other hand, the variation of the bubble temperature and the amount of the trapped water vapor as function of liquid temperature shows an opposite trend.
Production rate (mol/s)
PROCESS ENGINEERING JOURNAL 1 (2017) 10–18
200
400 600 Frequency (kHz)
800
1000
Fig. 6 Effect of acoustic intensity, liquid temperature and frequency on the maximum bubble temperature and the fraction of the trapped vapor at the collapse, for the same conditions as in Figs. 4 and 5.
0.01 H₂O₂
0.001 O3 0.0001 0
10
20
30
40
50
60
Liquid temperature ( C)
Fig. 4 Effect of acoustic intensity and liquid temperature on the production rate of the oxidants created inside an air bubble at 1 MHz. The production rate represents the amount of each species at the end of the bubble collapse multiplied by the frequency.
At lower bulk temperatures (< 20 °C), higher bubble temperatures are generated but a very low quantity of vapor is trapped. The inverse trend was observed at higher bulk temperatures (> 40 °C). In both cases, lower production of radicals could be produced. Taking into account that the liquid temperature did not affect significantly the collapse time (Table 2), it seems that there exists a balance between the bubble temperature and the amount of the vapor for the best yield of radicals inside the bubble. According to
14
PROCESS ENGINEERING JOURNAL 1 (2017) 10–18
our results, 30 °C is the optimum temperature. From Fig. 5, it was observed that the production rate of the oxidants decreased significantly with increasing frequency. The frequency of ultrasound acts as the inverse effect of acoustic intensity. Decreasing the frequency leads to increasing the bubble temperature, the amount of the trapped vapor and the collapse time (Fig. 6(c) and Table 2). Consequently, higher production rate of oxidants is expected at lower frequency (see more detail in Refs. [22,32]).
Table 2 Collapse time as function of acoustic intensity, liquid temperature and frequency, for the same conditions of Figs. 4 and 5. Parameter
Value
Collapse time (µs)
Acoustic intensity (W/cm2) [for 1000 kHz]
0.5 1.0 1.5 2.0 2.5 3.0 3.5 20 30 40 50 60 20 500 1000
0.210 0.211 0.220 0.230 0.238 0.247 0.254 0.234 0.238 0.243 0.249 0.257 8.800 0.531 0.238
Production rate x 10+10 (mol/s)
10
Total O
1
HO₂
(A) OH
Liquid temperature (°C) [for 1000 kHz]
0.1 H₂O₂
0.01
Frequency (kHz) [for 2.5 W/cm2]
O3
0.001
0.0001 0
1
2
3 4 5 6 7 Ambient bubble radius (µm)
Production rate x 10+11 (mol/s)
10
8
9
10
Table 3 Number of bubbles as function of frequency (see Ref. [35] for the experimental conditions and for more results).
Total O HO₂
1
(B) Frequency (kHz) Number of bubbles (1/L⸱s)
OH
0.1 H₂O₂
0.01 O3
0.001
300
585
860
1140
4.6604106
6.4645107
4.9856108
5.0470108
Table 4 Number of bubbles as function of liquid temperature at 300 kHz (see Ref. [14] for the experimental conditions).
0.0001 0
0.5
1 1.5 2 2.5 3 Ambient bubble radius (µm)
3.5
4
Fig. 7 Effect of frequency on the size of active bubbles for the production of the oxidants at 2.5 W/cm2 and 20 °C. (A) 500 kHz and (B) 1000 kHz. Vertical axes are in logarithmic scale. On the other hand, until this time all the calculations have been given for single bubble. However, real sonochemical system is a complex matrice that is controlled, in addition to the single bubble yield, by several phenomena such as the bubble population and the bubble coalescence. Thus, the overall sonochemical yield in multibubble system cannot be interpreted with only single bubble results. The effect of the other phenomena should be considered. While there was not enough data about the bubble coalescence, the bubble population results are now relatively available [31,45–47]. The bubble population means the bubble size and number. Using our model (Table 1) several interesting results have been obtained [31,35]. For example, the correspondence between the size of active bubbles and the production rate of the oxidants inside an oxygen bubble is given in Fig. 7 for two frequencies (500 and 1000 kHz). As seen, the range of active bubbles for the production of the oxidants
Liquid temperature (°C) Number of bubbles (1/L⸱s)
25
35
45
55
2.6029107
2.6867107
8.1999107
8.6184108
is rather narrow and it decreased with increasing frequency (i.e. 0.47.5 µm for 500 kHz and 0.453.2 µm for 1000 kHz) with almost the existence of an optimum size (3 µm for 500 kHz and 1.4 µm for 1000 kHz). The acoustic intensity has also a significant impact on the range of active bubbles, which becomes less wideness, and the optimum radius, which becomes smallest, at lower intensities (see Refs. [31,49]). Likewise, the number of active bubbles was strongly affected by the operational conditions. It was found to be substantially increased with increasing frequency and liquid temperature as shown in Tables 3 and 4. Consequently, the overall sonochemical efficiency in aqueous solution should be quantified based on both the single bubble yield and the bubble population, particularly, the bubble number (see an example of quantification in Ref. [14]). If available, the bubble coalescence effect should also be taken into account.
15
PROCESS ENGINEERING JOURNAL 1 (2017) 10–18
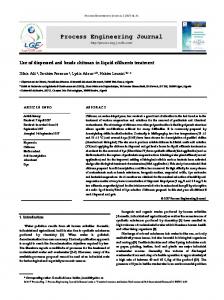
This section deals with presenting the applied aspect of sonochemistry in the field of water treatment. The sonochemical degradation of several kinds of persistent organic contaminants was reported. For the instance, the degradation of 4-chlorophenol (4-CP), two endocrine disrupting compounds (4-cumylphenol (4CyP) and propylbaraben (PPB)) and three dyes (Malachite green (MG), Basic fushcin (BF) and naphthol blue black (NBB)) are presented. The sonochemical reactors employed are cylindrical waterjacketed glass reactors (500 mL maximum capacity) (Fig. 8). The ultrasonic waves were emitted in continuous mode from the bottom of the reactors through piezoelectric discs. The emitting systems were connected to high-frequency generators operating at variable frequency and power. The reactors were calibrated using a standard calorimetric method for determining the effective energy used for cavitation process (sonicated volume: 300 mL, excepting that used for 4-CP (90 mL)). The chemical activity of each reactor was evaluated using chemical dosimetries such as KI oxidation, Fricke reaction, H2O2 production and 4-nitrophenol dosimetry (see Refs. [24,48] for the detail of these methods).
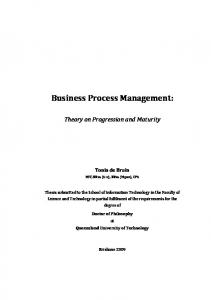
because tert-butanol, a well known HO● radical scavenger, drastically inhibited the degradation of the pollutants (data not shown). The reaction zone may also be probed by fitting the experimental data using an interfacial model based on Langmuirkinetics equation (Eq. (10)). A perfect fitting of the data was found as shown in Fig. 10, for PPB and MG at 25 °C, indicating that the degradation process mostly occurs at the bubble interface by reaction with HO● radicals ejected from the cavities.
r0
kK C0 1 K C0
(10)
In Eq. (10), r0 is the initial degradation rate (mg/L min), k is the pseudo-rate constant (mg/L min), K is the equilibrium constant of adsorption-desorption (L/mg) and C0 (mg/L) is the pollutant initial concentration. 1
0.8
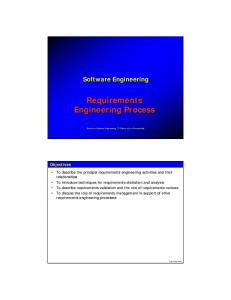
4CyP: 300 kHz, 40 W, 20 mg/L MG: 300 kHz, 30 W, 20 mg/L PPB: 352 kHz, 40 W, 25 mg/L 4CP: 516 kHz, 38 W, 100 mg/L BF: 600 kHz, 40 W, 10 mg/L NBB: 1140 kHz, 79 W, 5 mg/L
0.6 C/C0
4. Experimental sonochemistry
0.4
Thermocouple
0.2
Sampling port
0 0
Coolant outlet Solution Transducer
100
120
140
2 PPB
1.5 1
0
r (mg/L min)
2.5
0.5 0 0
50
100
150
200 250 300 C (mg/L)
350
400
450
0
2
0
Fig. 9. shows the C/C0versus time profiles of the examined solutes during ultrasonic treatment at different experimental conditions of frequency, acoustic power and initial solutes concentration (the conditions are mentioned in the legend of the graphic). As shown, ultrasound completely removes all kind of pollutants. The concentrations decreased experientially with time following a first-order kinetics law. However, plotting initial degradation rate (r0) as function of initial substrate concentration (C0) demonstrated that the degradation kinetics followed a complex mechanism similar to that obtained for photocatalysis (Fig. 10). The degradation of all these pollutants takes place at the bubble solution interface through hydroxyl radical attack. This was attributed, in one part, to the hydrophilic character of the substrates, which exclude their penetration in the bubbles, and, in second part,
60 80 Time (min)
3
r (mg/L min)
Fig. 8 General scheme of the ultrasonic reactors adopted for this study.
40
Fig. 9 Degradation kinetics of 4-chlorophenol (4CP), 4cumylphenol, (4CyP), propylparaben (PPB), malachite green (MG), Basic fushcin (BF) and naphthol blue black (NBB) at different experimental conditions of frequency, acoustic power and initial concentration.
Coolant inlet
To ultrasound generator
20
1.5 1
MG
0.5 0 0
100
200 300 C (mg/L)
400
500
0
Fig. 10 Fitting of initial degradation rate versus PPB and MG initial concentrations using Langmuir-kinetics model (○: experimental data, ─: fitting curve).
16
PROCESS ENGINEERING JOURNAL 1 (2017) 10–18
0.35
0.3
r0 (mg/L min)
0.25 0.2 0.15
0.1 0.05 0
20
40
60
80 100 20
4CyP
40
60
80
30
50
MG
70
90
BF
Fig. 11 Effect of supplied power (W) on the initial degradation rate of 4CyP and MG (C0 = 5 mg/L, 300 kHz) and BF (C0 = 10 mg/L, 600 kHz).
0.35
0.3
r0 (mg/L min)
0.25 0.2 0.15
The degradation rate of the selected contaminants was found to be increased significantly with increasing supplied power (acoustic intensity) and decreasing frequency, which is in accordance with the theoretical results of section 3. For example, Figs. 11 and 12 show the effect of power and frequency on the initial degradation rates of 4CyP, MG, BF and NBB. Increasing acoustic power and decreasing frequency increases the production of free radicals from the acoustic bubble as illustrated in the computational section (Figs. 4 and 5). However, the number of active bubbles increases with increasing power and frequency. Consequently, the overall degradation rate will increase with power rise. Nevertheless, the opposite trends of increasing frequency (rising bubble number and decreasing bubble yield) implies that the overall production of free radicals in this case could be imposed by the single bubble yield, which engenders lower degradation rates at higher frequencies (for more detail, see Ref. [34]). The liquid temperature is another important sonochemical parameter that affects the degradation rate of pollutants during ultrasonic treatment. Fig. 13 shows the effect of liquid temperature on the sonochemical degradation of 4CyP and MG at 300 kHz. As seen, significant enhancement was observed for higher liquid temperatures. As reported in the computational section, the bubble temperature showed an optimum temperature for the production of free radical from a single bubble (Fig. 4(b)). However, the number of active bubbles drastically increased with temperature rise (Table 4). According to the results of Fig. 12, it can be concluded that the overall effect of liquid temperature is controlled by the number of active bubble (see Ref. [14] for more detail).
0.1 0.05
5. Conclusion
0
585 kHz
860 kHz
1140 kHz
300 kHz
NBB
600 kHz
4CyP
Fig. 12 Effect of frequency on the initial degradation rate of NBB and 4CyP (C0 = 5 mg/L).
0.4
0.35
r0 (mg/L min)
0.3
0.25 0.2 0.15
This paper reports a theoretical and experimental study on sonochemistry. The sensitivity of free radicals production inside a single acoustic bubble oscillating in water at various experimental conditions has been modeled using a cavitational model for reactive bubbles. The modeling results showed that HO● is the main radical generated inside a collapsing air bubble and frequency, power and liquid temperature significantly influence the production rate of HO● . Additionally, the bubble population (bubbe size and number) was found to be frequency and power-dependent. The experimental results on the degradation of several pollutants in aqueous phase showed the significant impact of operational conditions on the efficiency of the sonolytic process. Increasing power and decreasing frequency enhanced the degradation rate of the pollutants mainly through increasing the single bubble yield. However, the main factor controlling the effect of liquid temperature on the degradation rate of the contaminants is the number of active bubbles.
0.1
Acknowledgements
0.05 0 20 °C
30 °C
40 °C
4CyP
50 °C
25 °C
35 °C
45 °C
55 °C
MG
Fig. 13 Effect of liquid temperature on the initial degradation rate of 4CyP and MG (C0 = 5 mg/L, 300 kHz).
The financial support by the Ministry of Higher Education and Scientific Research of Algeria (project No. A16N01UN230120130010) is greatly acknowledged.
PROCESS ENGINEERING JOURNAL 1 (2017) 10–18
REFERENCES
[1] [2] [3]
[4]
[5]
[6]
[7]
[8]
[9]
[10]
[11]
[12]
[13]
[14]
[15]
[16]
S. Parsons, Advanced oxidation processes for water and wastewater treatment, IWA Publishing, London, 2004. M.A. Tarr, Chemical degradation methods for wastes and pollutants, Mark Dekker, Inc., New York, 2003. T.J. Mason, J.P. Lorimer, T.J . Mason and J.P. Lorimer, Applied Sonochemistry The Uses of Power Ultrasound in Chemistry and Processing, Wiley-VCH Verlag GmbH & Co. KGaA, Weinheim, 2002. N.N. Mahamuni, Y.G. Adewuyi, Advanced oxidation processes (AOPs) involving ultrasound for wastewater treatment: A review with emphasis on cost estimation, Ultrason. Sonochem. 17 (2010) 990–1003. doi:10.1016/j.ultsonch.2009.09.005. Y.G. Adewuyi, Sonochemistry : environmental science and engineering applications, Ind. Eng. Chem. Res. 40 (2001) 4681– 4715. doi:10.1021/ie010096l. O. Ifelebuegu, J. Onubogu, E. Joyce, T. Mason, Sonochemical degradation of endocrine disrupting chemicals 17 betaestradiol and 17 alpha-ethinylestradiol in water and wastewater, Int. J. Environ. Sci. Technol. 11 (2014) 1–8. doi:10.1007/s13762-013-0365-2. K.S. Suslick, Y. Didenko, M.M. Fang, T. Hyeon, K.J. Kolbeck, W.B. McNamara III, M.M. Mdleleni, M. Wong, Acoustic cavitation and its chemical consequences, Philos. Trans. R. Soc. A. 357 (1999) 335–353. doi:10.1098/rsta.1999.0330. S. Merouani, O. Hamdaoui, Y. Rezgui, M. Guemini, Computer simulation of chemical reactions occurring in collapsing acoustical bubble: Dependence of free radicals production on operational conditions, Res. Chem. Intermed. 41 (2015) 881– 897. doi:10.1007/s11164-013-1240-y. H. Ferkous, O. Hamdaoui, S. Merouani, Sonochemical degradation of naphthol blue black in water: Effect of operating parameters, Ultrason. Sonochem. 26 (2015) 40–47. doi:10.1016/j.ultsonch.2015.03.013. H.S. Son, S.K. Kim, J.K. Im, J. Khim, K.D. Zoh, Effect of bulk temperature and frequency on the sonolytic degradation of 1,4dioxane with Fe0, Ind. Eng. Chem. Res. 50 (2011) 5394–5400. doi:10.1021/ie101849p. M.A. Beckett, I. Hua, Impact of ultrasonic frequency on aqueous sonoluminescence and sonochemistry, J. Phys. Chem. A. 105 (2001) 3796–3802. doi:10.1021/jp003226x. R.A. Torres, C. Pétrier, E. Combet, M. Carrier, C. Pulgarin, Ultrasonic cavitation applied to the treatment of bisphenol A. Effect of sonochemical parameters and analysis of BPA byproducts, Ultrason. Sonochem. 15 (2008) 605–611. doi:10.1016/j.ultsonch.2007.07.003. S. Merouani, O. Hamdaoui, F. Saoudi, M. Chiha, Sonochemical degradation of Rhodamine B in aqueous phase: Effects of additives, Chem. Eng. J. 158 (2010) 550–557. doi:10.1016/j.cej.2010.01.048. S. Merouani, O. Hamdaoui, Z. Boutamine, Y. Rezgui, M. Guemini, Experimental and numerical investigation of the effect of liquid temperature on the sonolytic degradation of some organic dyes in water, Ultrason. Sonochem. 28 (2016) 382–392. doi:10.1016/j.ultsonch.2015.08.015. H. Ferkous, S. Merouani, O. Hamdaoui, Sonolytic degradation of naphtol blue black at 1700 kHz: Effects of salts, complex matrices and persulfate, J. Water Process Eng. 9 (2016) 67–77. doi:10.1016/j.str.2014.12.012. L. Sanchez-Prado, R. Barro, C. Garcia-Jares, M. Llompart, M. Lores, C. Petrakis, N. Kalogerakis, D. Mantzavinos, E. Psillakis, Sonochemical degradation of triclosan in water and wastewater, Ultrason. Sonochem. 15 (2008) 689–694.
[17]
[18]
[19]
[20] [21]
[22]
[23]
[24]
[25]
[26]
[27] [28]
[29]
[30]
[31]
[32]
[33]
[34]
17
doi:10.1016/j.ultsonch.2008.01.007. S. Boutemedjet, O. Hamdaoui, S. Merouani, C. Pétrier, Sonochemical degradation of endocrine disruptor propylparaben in pure water, natural water, and seawater, 57 (2016) 27816–27826. doi:10.1080/19443994.2016.1177600. C. Pétrier, The use of power ultrasound for water treatment, in: JA Gallego-Juarez, K. Graff (Eds.), Power Ultrason. Appl. High-Intensity Ultrasound, Elsevier, Cambridge, 2015: pp. 939–963. C. Fischer, E. Hart, A. Henglein, Ultrasonic irradiation of water in the presence of 18,18O2: isotope exchange and isotopic distribution of hydrogen peroxide, J. Phys. Chem. (1986) 1954– 1956. T.G. Leighton, The Acoustic Bubble, Academic press, London, 1994. doi:10.1121/1.410082. S. Merouani, O. Hamdaoui, Y. Rezgui, M. Guemini, Theoretical estimation of the temperature and pressure within collapsing acoustical bubbles, Ultrason. Sonochem. 21 (2014) 53–59. doi:10.1016/j.ultsonch.2013.05.008. S. Merouani, O. Hamdaoui, Y. Rezgui, M. Guemini, Sensitivity of free radicals production in acoustically driven bubble to the ultrasonic frequency and nature of dissolved gases, Ultrason. Sonochem. 22 (2014) 41–50. doi:10.1016/j.ultsonch.2014.07.011. C. Petrier, Y. Jiang, M.F. Lamy, Ultrasound and environment: Sonochemical destruction of chloroaromatic derivatives, Environ. Sci. Technol. 32 (1998) 1316–1318. doi:10.1021/es970662x. S. Merouani, O. Hamdaoui, F. Saoudi, M. Chiha, Influence of experimental parameters on sonochemistry dosimetries: KI oxidation, Fricke reaction and H2O2 production, J. Hazard. Mater. 178 (2010) 1007–1014. doi:10.1016/j.jhazmat.2010.02.039. K.S. Suslick, D.J. Flannigan, Inside a collapsing bubble: sonoluminescence and the conditions during cavitation, Annu. Rev. Phys. Chem. 59 (2008) 659–683. doi:10.1146/annurev.physchem.59.032607.093739. J. Lee, M. Ashokkumar, S. Kentish, F. Grieser, Determination of the size distribution of sonoluminescence bubbles in a pulsed acoustic field, J. Am. Chem. Soc. 127 (2005) 16810–16811. doi:10.1021/ja0566432. E.A. Neppiras, Acoustic Cavitation, Phys. Rep. 61 (1980) 1–11. doi:10.1007/978-1-4419-7472-3_2. K. Yasui, Alternative model of single bubble sonoluminescence, Phys. Rev. E. 56 (1997) 6750–6760. doi:10.1103/PhysRevA.65.054304. B.D. Storey, A.J. Szeri, A reduced model of cavitation physics for use in sonochemistry, Proc. R. Soc. London A. 457 (2001) 1685–1700. doi:10.1098/rspa.2001.0784 A. P. He, L. Yuan, Modelling single-bubble sonoluminescence with chemical reactions and Coulomb interactions, Syst. Sci. (2005) 1–5. S. Merouani, O. Hamdaoui, Y. Rezgui, M. Guemini, Effects of ultrasound frequency and acoustic amplitude on the size of sonochemically active bubbles-Theoretical study, Ultrason. Sonochem. 20 (2013) 815–819. doi:10.1016/j.ultsonch.2012.10.015. S. Merouani, H. Ferkous, O. Hamdaoui, Y. Rezgui, M. Guemini, New interpretation of the effects of argon-saturating gas toward sonochemical reactions, Ultrason. Sonochem. 23 (2015) 37–45. doi:10.1016/j.ultsonch.2014.09.009. S. Merouani, O. Hamdaoui, Y. Rezgui, M. Guemini, Mechanism of the sonochemical production of hydrogen, Int. J. Hydrogen Energy 40 (2015) 4056–4064. doi:10.1016/j.ijhydene.2015.01.150. H. Ferkous, S. Merouani, O. Hamdaoui, Y. Rezgui, M. Guemini, Comprehensive experimental and numerical investigations of the effect of frequency and acoustic intensity on the sonolytic
18
[35]
[36]
[37]
[38]
[39]
[40]
[41]
[42]
PROCESS ENGINEERING JOURNAL 1 (2017) 10–18
degradation of naphthol blue black in water, Ultrason. Sonochem. 26 (2015) 30–39. doi:10.1016/j.ultsonch.2015.02.004. S. Merouani, H. Ferkous, O. Hamdaoui, Y. Rezgui, M. Guemini, A method for predicting the number of active bubbles in sonochemical reactors, Ultrason. Sonochem. 22 (2014) 51–58. doi:10.1016/j.ultsonch.2014.07.015. C.–D. Ohl, T. Kurz, R. Geisler, O. Lindau, W. Lauterborn, Bubble dynamics, shock waves and sonoluminescence, Phil. Trans. R. Soc. Lond. A 357 (2009) 269–294. D.F. Gaitan, R.A. Tessien, R.A. Hiller, J. Gutierrez, C. Scott, H. Tardif, B. Callahan, T.J. Matula, L.A. Crum, R.G. Holt, C.C. Church, J.L. Raymond, Transient cavitation in high-qualityfactor resonators at high static pressures, J. Acoust. Soc. Am. 127 (2010) 3456–3465. doi:10.1121/1.3377062. S. Merouani, O. Hamdaoui, Y. Rezgui, M. Guemini, Modeling of ultrasonic cavitation as an advanced technique for water treatment, Desalin. Water Treat. 56 (2015) 1465–1475. doi:10.1080/19443994.2014.950994. S. Merouani, O. Hamdaoui, Y. Rezgui, M. Guemini, Computational engineering study of hydrogen production via ultrasonic cavitation in water, Int. J. Hydrogen Energy 41 (2015) 832–844. doi:10.1016/j.ijhydene.2015.11.058. E.L. Mead, R.G. Sutherland, R.E. Verrall, The effect of ultrasound on water in the presence of dissolved gases, Can. J. Chem. 54 (1976) 1114–1120. doi:10.1139/v76-159. E.J. Hart, A. Henglein, Sonochemistry of aqueous solutions: H2O2 combustion in cavitation bubbles, J. Phys. Chem. 91 (1987) 3654–3656. doi:10.1021/j100297a038. K. Makino, M.M. Mossoba, P. Riesz, Chemical effects of ultrasound in aqueous solutions. Evidence for •OH an •H by
[43]
[44]
[45]
[46]
[47]
[48]
[49]
spin trapping, J. Am. Chem. Soc. 104 (1982) 3537–3539. doi:10.1021/ja00376a064. Y. Iida, K. Yasui, T. Tuziuti, M. Sivakumar, Sonochemistry and its dosimetry, Microchem. J. 80 (2005) 159–164. doi:10.1016/j.microc.2004.07.016. G. Mark, A. Tauber, R. Laupert, H.P. Schuchmann, D. Schulz, A. Mues, C. von Sonntag, OH-radical formation by ultrasound in aqueous solution--Part II: Terephthalate and Fricke dosimetry and the influence of various conditions on the sonolytic yield, Ultrason. Sonochem. 5 (1998) 41–52. doi:10.1016/S1350-4177(98)00012-1. F. Burdin, N.A. Tsochatzidis, P. Guiraud, A.M. Wilhelm, H. Delmas, Characterisation of the acoustic cavitation cloud by two laser techniques, Ultrason. Sonochem. 6 (1999) 43–51. doi:10.1016/S1350-4177(98)00035-2. M. Ashokkumar, The characterization of acoustic cavitation bubbles - An overview, Ultrason. Sonochem. 18 (2011) 864–872. doi:10.1016/j.ultsonch.2010.11.016. A. Brotchie, T. Statham, M. Zhou, L. Dharmarathne, F. Grieser, M. Ashokkumar, Acoustic Bubble Sizes, Coalescence, and Sonochemical Activity in Aqueous Electrolyte Solutions Saturated with Different Gases, Langmuir 26 (2010) 12690– 12695. doi:10.1021/la1017104. H. Ferkous, Elimination du colorant azoïque bleu noir naphtol dans l’eau par sonochimie et procédés innovants d’oxydation, Ph. D. Thesis, Badji Mokhtar - Annaba University, 2016. S. Merouani, O. Hamdaoui, Y. Rezgui, M. Guemini, Theoretical Procedure for the Characterization of Acoustic Cavitation Bubbles, Acta Acust. United with Acust. 100 (2014) 823–833. doi:10.3813/AAA.918762.
Please cite this article as: S. Merouani, O. Hamdaoui, Computational and experimental sonochemistry, Process Eng. J. 1 (2017) 10−18.