Rapid control prototyping tutorial with application examples Vesa Hölttä
Lauri Palmroth
Lasse Eriksson
Control Engineering Laboratory Helsinki University of Technology P.O. Box 5500, FI-02015 HUT FINLAND
[email protected]
Institute of Automation and Control Tampere University of Technology P.O. Box 692, FI-33101 Tampere FINLAND
[email protected]
Control Engineering Laboratory Helsinki University of Technology P.O. Box 5500, FI-02015 HUT FINLAND
[email protected]
Abstract – Rapid control prototyping (RCP) is a control design method where testing of a new controller is done first in simulation environment. The simulation models are then converted with aid of automatic code generation to a prototype controller that can be used in field testing. With this approach, the time needed for developing new functions is reduced significantly because the manual computer code implementation phase is left out of the design and testing process. Consequently, it is possible to evaluate different control solutions without additional delay.
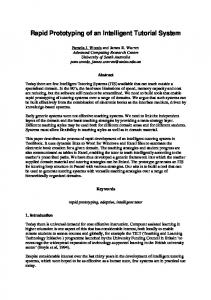
of the plant. The original control unit executes all the functions that will remain unchanged, while the new algorithms are calculated in a specific control unit, which also provides the additional inputs and outputs. The additional I/O can be used e.g. for testing new sensors or actuators without revising the existing control software of the plant. If needed, a PC provides the user interface for the new control system (Figure 1).
I. INTRODUCTION Rapid control prototyping provides a quick solution for prototyping new functions in different types of industrial processes and devices controlled with a complex distributed control system. The basic idea in this approach is to develop and to test the new control strategies and algorithms in simulation environment. As soon as the controller design is complete and the simulation results are acceptable, the controller can be transformed to a real-time prototype controller, which is used for testing the algorithm in real working conditions. The transforming from the offline simulation environment to a real-time controller is done automatically without any handwritten code. This paper begins with a general treatment of rapid control prototyping, which is followed in section III by a complete case example illustrating the steps of rapid control prototyping applied to a laboratory process. Realworld case examples are presented in section IV. Future prospects and conclusions wind up the paper in sections V and VI. II. RAPID CONTROL PROTOTYPING A. Overview The rapid control prototyping (RCP) process consists of the following phases: 1. 2. 3. 4.
Modelling of the plant in simulation environment Model validation Designing a prototype version of the control system Testing the prototype version of the control system against the simulation model 5. Testing the prototype version of the control system in the real plant Two basic RCP approaches can be distinguished: fullpass and bypass [2]. With fullpass, the original control system is completely replaced by the new one. All sensors and actuators are connected to this electronic hardware, and it has full authority to control the plant. In the bypassmethod the prototype controller of the new function is implemented by partially revising the existing control units
Figure 1. Bypass-based rapid control prototyping. [3]
B. Benefits and drawbacks The RCP approach has many advantages. The use of simulation models helps the control designer in deepening his or her understanding of the plant. Already the modeling phase of RCP forces the designer to carefully examine the plant in order to derive a proper model. Once derived, the model can be used among other things for training purposes. In simulation experiments it is possible to monitor state variables that are impossible or difficult to measure from the real process. It is also possible to experiment with features that are not available in the hardware currently used in the plant. These features include e.g. higher sampling rates and larger computational power. Thus it is possible to evaluate the benefits that would be obtained if the plant hardware was upgraded to a better and presumably more expensive version, or if e.g. new sensors or actuators were added to the plant. The software and hardware used in the RCP process also serve as high performance general purpose data acquisition tools in addition to providing a real-time control system for the new algorithms. Time and money are saved when the costly and time-consuming I/O-wiring of the plant is done only once. The same equipment is used for testing of the new control prototype in the real working environment as well as for data acquisition in modeling and model validation phases. Control prototyping does not require any modifications of the plant’s existing control software components.
Automatic code generation speeds up significantly the iterations in control system design because the timeconsuming manual coding phase of the algorithms is left out. It also removes the programming errors that would appear during the manual coding phase. As a whole, the time needed for designing and implementing a control system is shortened. Thus several different solution candidates can be prototyped and tested in the real plant. The use of RCP may require purchasing commercial proprietary software and hardware to be used during the design and testing process. However, the cost of such products is small when compared with the amount of work that would be required to realize a similar test setup from scratch. The software and hardware can also be reused in other development projects. To be able to design a good control algorithm for a plant using the RCP method, the plant model must be accurate enough. Unmodeled plant dynamics and nonlinearities as well as unexpected measurement noise and disturbances during testing with the real plant may result in the failure of a control algorithm that has performed well in simulations. Should this be the case, the data obtained from the plant can be used to refine the model of the plant before retuning or redesigning the control algorithm. C. Tools In the examples presented in this paper Matlab and Simulink from MathWorks were used as the simulation tool. Matlab and its toolboxes provide a high level development environment for implementing different control strategies. In Simulink the system to be simulated is represented graphically using a block diagram. Many types of controllers are implemented in the toolboxes, e.g. the PID controller or solutions based on fuzzy and neural network approaches can be created using existing blocks. Other software products that can be used in this manner exist, e.g. National Instruments’ LabVIEW provides a similar graphical development environment. The hardware used for controlling the plant can also be selected among several possibilities. If the testing is done in a laboratory environment, the most cost-efficient solution is to use a standard PC equipped with appropriate I/O hardware and a real-time operating system. A real-time operating system is required, since otherwise it would not be possible to guarantee that the values of the control signal could be computed in time. Specialized hardware is available from several vendors, e.g. dSPACE, National Instruments and Quanser. III. COMPLETE EXAMPLE To illustrate the rapid control prototyping method, a complete controller design example is presented. The example begins with the derivation of a first principles plant model. The plant used in this example is a simple RC circuit. After the model has been derived, it is validated by comparing simulation results with responses from the plant. Then two controllers are designed and tuned in simulation environment, and finally the new controllers are used for controlling the plant.
C2 R1 R2 Uin
C1
C3
Uout
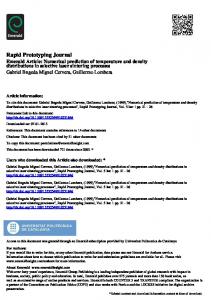
Figure 2. Circuit diagram of the plant. Table 1. Plant parameters.
Component R1 R2 C1 C2 C3
Value 820 kΩ 680 kΩ 0.33 µF 0.68 µF 0.33 µF
A. Plant model The plant is a second degree RC circuit that was originally built for teaching process identification on the laboratory experiment course of the Control Engineering Laboratory of the Helsinki University of Technology (see [4]). The circuit diagram of the plant is presented in Figure 2, and the parameter values are summarized in Table 1. The input to the plant is the voltage Uin and the output is the voltage Uout. The model of the plant can be derived from first principles and it can be presented e.g. in Laplace-plane as a transfer function G(s) = =
U out ( s ) U in ( s )
sR2C2 + 1 R1R2 ( C1C2 + C1C3 + C2C3 ) s + R1 ( C1 + C3 ) + R2 ( C2 + C3 ) s + 1 2
Substituting the parameter values in Table 1 to the model gives the transfer function G( s) =
1.487 s + 3.216 s 2 + 3.949s + 3.216
When this model is discretized using a sampling time of 0.025 seconds and zero-order hold the pulse transfer function becomes H ( z) =
B ( z ) 0.03636 z − 0.03445 = 2 A( z ) z − 1.904 + 0.906
In addition to the plant the experiment hardware consists of two computers. One of the computers, called the host PC, runs Matlab with Simulink, Real-Time Workshop and xPC Target Toolboxes installed. This computer is used for controlling the other computer, called the target PC, which is connected to the plant via an I/O board. The target PC runs the real-time operating system included in xPC Target. The computers are interconnected via a local area network.
B. Validation of the model The plant model was validated by giving the same step input sequence to the plant and to the model. No feedback was used, only open-loop control. The differences in the outputs were observed in order to evaluate the quality of the model. Simulink and Real-Time Workshop were used to create the measuring and controlling software. The Simulink block diagram that is shown in Figure 3 was made for model validation purposes. The block labeled ‘Reference’ builds a sequence of step inputs that is used as the test input. The plant model was implemented as a transfer function. The plant is represented by analog input and output blocks that correspond to the outputs and inputs of the I/O board in the target PC (Figure 4). Real-Time Workshop was used to create program code in C from Simulink models and Microsoft Visual Studio C/C++ compiler to produce executable code which is uploaded to the target PC that runs it in the real-time operating system.
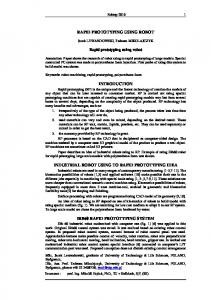
The outputs of the plant and of the model are shown in the upper part of Figure 5. The modeling error which can be seen more clearly in the lower part of the figure is fairly small. The error is mainly caused by the inaccuracy of the electrical components. The true resistance and capacitance of the components may vary tens of percents from the nominal values given by the component manufacturer. In order to improve the model the resistances and capacitances should be measured instead of using the manufacturer’s values in the model. C. Controller models To illustrate the easiness of testing and comparing different types of controllers, a PID controller and a controller based on polynomial pole-placement design are used. The parameters of both controllers are optimized with respect to a cost function presented later. The plant is controlled with a discrete PID controller of the form
1 u ( kh) = K e( kh ) + TI h
∑ e(kh) + h ∆e(kh) TD
where K is the gain of the controller, TI and TD are integration and derivation times, respectively, k is the index of the sample, h is the sampling period, e(kh) is the input to the controller (error between reference and plant output), and ∆e(kh) = e(kh) – e(kh – h). The controller is easier to implement in the incremental form
Figure 3. Plant model validation setup.
1 + TD h
e( kh) + 1 TD T + −2 − 1 e( kh − h ) + D T h h I h
∆u ( kh ) = K
The Simulink block diagram of the incremental form of the discrete PID controller is shown in Figure 6.
Figure 4. Interface to the plant.
du(kh)
-K-
Time domain response
Amplitude [V]
2
0
5
e(kh-h)
15
20
25
Time [s] Error
1
-K-
z Unit Delay2
1/(Ti/h)-2*Td/h-1
z Unit Delay1
10
1 u(kh)
K
1
Model Plant Reference
-4
-KTd/h
Figure 6. Incremental form of the discrete PID controller.
In addition to the PID controller, a controller based on the polynomial pole-placement method was used. The general form of the polynomial controller is given by
0.1 Amplitude [V]
1 z Unit Delay
0
-K-
1+Td/h
1 e(kh)
-2
e( kh − 2h)
0.05 0
R (q)u (kh) = T (q) yref (kh) − S (q ) y (kh)
-0.05 -0.1 0
5
10
15
20
25
Time [s]
Figure 5. Time domain response of the open-loop model and plant (above) and the difference between their responses (below).
where R, S and T are the controller polynomials and yref is the reference signal [7]. To obtain the controller polynomials the Diophantine equation
A(q) R (q) + B(q ) S (q ) = Ao (q ) Ac (q)
must be solved. In the equation Ao is the so called observer polynomial and Ac is the desired characteristic polynomial of the closed-loop system. To control the plant, a dead-beat type observer polynomial is used, i.e. Ao = qm, where m = 0, 1, 2,… When the controller is designed the poles of the closed-loop system (the roots of polynomial Ac) are placed into such locations in the complex plane that the performance of the system is good enough. The Simulink block diagram of the polynomial poleplacement controller is shown in Figure 7. T(z)
1
1
R(z)
Discrete Filter
Discrete Filter2
1 yr
1 u
S(z)
2 y
the blocks in Figure 6 and Figure 4, respectively. The responses of the model and of the real plant are shown in Figure 9 for the PID controller and in Figure 10 for the polynomial controller. The control error for both controllers is shown in Figure 11, but the difference is not visible at the level of detail of the Figure. The PID controller is slightly slower, but it uses less control effort. When the cost function used in optimization is evaluated using data obtained from the real process, the cost for the PID controller is 377.7 and for the polynomial controller 376.0. Hence the simulation tests predicted successfully that the polynomial controller would slightly outperform the other in this control problem.
1 Discrete Filter1
Figure 7. Polynomial pole-placement controller. Figure 8. Controller test setup.
D. Testing in simulation environment Time domain response
One objective for simulation testing is to find suitable controller parameters. This was done by optimizing the performance of the closed-loop system with respect to the cost function
Amplitude [V]
2
N
2 J = ∑ w1 ⋅ e(kh) 2 + w2 ( yref (kh) − g ⋅ u (kh) ) k =0
Model Plant Reference
-2 -4 0
5
0
5
10
15 Time [s] Difference between model and plant
20
25
20
25
Amplitude [V]
0.1 0.05 0 -0.05 -0.1 10
15 Time [s]
Figure 9. Time domain response of the closed-loop model and plant (above) and the difference between their responses (below) when PID control is used. Time domain response 2 Amplitude [V]
where e is the error signal between reference yref and plant output, u is the control signal, w1 = 0.7 and w2 = 0.3 are the weights of the two quadratic terms in the cost function, and g is the plant open loop static gain. The sampling interval h was 0.025 seconds. The reference signal that was used was the same series of steps that was used earlier in this paper. Optimization was carried out numerically with Matlab and the optimal PID controller parameters were K = 1.85, TI = 0.75 and TD = 0. The optimal value for the cost function was 403.1. When the controller based on polynomial pole placement is optimized with respect to the same cost function, the optimal result is obtained when the poles are placed to 0.957 and 0.919. This selection gives the following controller polynomials for the plant: R(q) = q – 0.2289, S(q) = 7.0497q – 6.0209 and T(q) = 1.7999q. The optimal value for the cost function was 402.6, which is slightly less than for the PID controller.
0
0 Model Plant Reference
-2 -4 0
5
0
5
E. Testing in the plant
10
15 Time [s] Difference between model and plant
20
25
20
25
In the simulation phase it was concluded that the controller based on polynomial pole-placement design performs better with respect to the optimality criterion that was used. Hence the PID controller could be left out from further tests. However, both controllers can be easily tested in the plant when rapid control prototyping is used. The Simulink block diagram for automatic code generation in the PID controller case is shown in Figure 8. The blocks labeled ‘Discrete PID’ and ‘Process’ contain
Amplitude [V]
0.1 0.05 0 -0.05 -0.1 10
15 Time [s]
Figure 10. Time domain response of the closed-loop model and plant (above) and the difference between their responses (below) when polynomial pole-placement control is used.
Control error 6 PID Polynomial pole-placement
5 4
Amplitude [V]
3 2 1 0 -1 -2 -3 -4
0
5
10
15
20
25
Time [s]
Figure 11. Error signal with PID and polynomial pole-placement controllers.
IV. CASE EXAMPLES A. Prototyping forest harvester functions The test case reported in [5] used rapid control prototyping for developing a new control algorithm for a forest harvester. Forest harvesters are used for felling, delimbing and cutting trees. Modern forest harvesters are becoming more and more computerized and a number of sophisticated control methods such as fuzzy control and learning systems are included in the distributed control system of the machines. The development of new functions requires extensive testing, preferably in the actual working environment, and several approaches may need to be tried out before a working one is found. Therefore flexible tools like rapid control prototyping which enable fast design and testing are needed. One of the main problems in the product development of mobile working machines is the difficulty of collecting additional data and testing new control prototypes in normal working conditions. This is due to the extremely harsh working environment that all additional sensors and signal processing units placed in the machines must tolerate. Implementing new control algorithms often requires revising some of the software components of the machine’s existing control units. As a result of this, usually only small modifications are made at a time to a product that has proven its functionality in practice. When using rapid control prototyping, extensive testing can be done in simulation environment. For the field tests there are commercially available real-time capable control units that are designed to be used in a wearing environment. A simulation model of the forest harvester was created so that it would be possible to simulate the processing of a tree. The simulation model was implemented in Simulink. The main subsystems of the model are: • • • •
Control unit Supply pressure (300 blocks) Hydraulics and actuators (1600 blocks) Tree dynamics and mechanical interactions (400 blocks)
The validation tests were conducted using the existing control unit of the machine. The existing control system of the machine has mainly open-loop sequences, which means that it was possible to get proper data for system identification by conducting measurements from the normal working process, and no special test signals were needed. Most of the validated parameters also relate to the interaction of the harvester head and the tree during the working process. The validation tests were conducted by using a dSPACE MicroAutoBox as the data acquisition equipment. The test data was stored to Matlab data files, where it was easily accessible for comparison with simulation results. It was assumed that the known properties of the simulation model, e.g. actuator masses and dimensions, do not need to be validated. Instead, the validation process concentrated on validation of the model structure and finding the correct values of unknown system parameters, like friction coefficients and time constants. Matlab and dSPACE provide a huge signal processing and computing capacity, which is an advantage in the early stages of the RCP process. However, it must be noted that there may be tighter limitations in the data acquisition and signal processing hardware of the production machine. Also limitations of control valves and actuators have to be taken into consideration when designing the new function. The aim of the controller was to speed up the feeding of the tree to a new cutting position and to improve the positioning accuracy. These improvements were to be gained without deteriorating the tree diameter and length measurement accuracy and the result of the delimbing of branches. The control algorithms were designed in simulation environment. The algorithms were implemented using C-MEX S-functions, which were written in C code. In the beginning of the simulation study it was very important to find out the influences of different control strategies to the total performance of the machine, because a performance improvement in a single function may have negative effects to other functions and thus to the whole process. Simulation study gave also a good opportunity to make comparisons between the performances of different control methods. It would be quite difficult to make these comparisons in the real working environment, because it is very hard to separate the influence of the operator and varying working conditions from the actual performance of the machine. After the functionality of the controller was tested against the simulation model, the testing of the prototype controller in the real working environment was quite straightforward, since the prototype controller was generated automatically from the simulation model. Thus the focus of the field tests was on finding the right control parameter values and evaluating the machine performance. The results showed that the new control algorithms improved the tree handling features and the positioning accuracy in tree processing. This increases the efficiency of the processing head of the forest harvester, and thus the whole timber harvesting process. It also leads to better quality of the harvested timber.
B. Fault diagnosis of a hydraulic valve The aim of the test case presented in [6] is to design and to test a test sequence that can be used to evaluate the condition of a hydraulic valve. The sequence should be such that it can be performed periodically without disturbing the normal operation of the machine. If possible, the test sequence should also be performed without any additional equipment and the results of the test sequence should be interpreted automatically so that the evaluation of the health of the valves is obtained without expertise in hydraulics. Simulation was used for avoiding tasks that would be time-consuming, expensive and impractical to do in practice. In the test case the goals of simulation were: • • •
Finding the optimal pressure levels and positions of hydraulic components and actuators Finding the optimal inputs of the test sequence Finding the optimal sensor locations in the system.
If these goals were to be achieved without simulation, extensive work changing the hardware to test e.g. different sensor positions would be required. In simulation testing the parameters of the process can be kept constant and disturbances are replicable, whereas in real-world testing the fault in the process could become more severe during the testing, making the results to be non-comparable. Fault detection is based on measuring pressure levels from the system. The waveform of pressure vibration generated by the faulty valve is not perfectly sinusoidal, but it appears roughly around the valve natural frequency. In order to have time domain fault residuals that represent certain frequencies of a signal, the fault residuals were generated using the discrete wavelet transform. The discrete wavelet transform is performed to the pressure measurement using a symlet-wavelet [1], and the wavelet coefficients that represent the frequencies near the valve natural frequency are chosen for fault residuals. The time-domain presentation of the fault residuals is generated calculating the floating root-mean-square (RMS) values of the chosen wavelet coefficients. Simulations were conducted in the case of no fault and a single failed pressure valve. In practice, multiple faults of different levels of severity may occur at the same time. However, this is not a problem, since the test sequence and pressure sensor location can be chosen in a way that other failed components do not cause false fault detection for a healthy component. It is expected from the simulations that a proportional pressure reducing valve, with impending instability, starts to lose its ability to regain a steady pressure level after a stepwise change in the pressure setting. A completely faulty valve is unable to reach a steady state at all. An experimental test was arranged using a real hydraulic system. The component to be tested was chosen to be an old, partially unstable valve, which was still usable. The instability of the valve was still so insignificant, that the fault would not have been noticed in normal working conditions. However, it was expected that the component would fail in the near future. The same test sequence that was used in the simulations was also used also in the experimental tests. The results
were very much similar as the simulation results. After a stepwise change is made in the valve input, the faulty valve is unable to regain a stable state as expected, but the amplitude of the vibration is smaller than in the simulations. However, the residuals are significantly higher than in the idle state and the fault can easily be detected. V. FUTURE RESEARCH AND DEVELOPMENTS The current software and hardware that is available for rapid control prototyping can be used for successful development of new functions without further improvements. However, to widen the scope of the approach several issues need to be addressed. The code produced by automatic computer code generation is not necessarily well optimized. Using this code in the embedded control system of the final product may not be possible due to the limited computational power of the embedded controller. Hence the code must be re-written and optimized manually before it can be taken to the product. Automatically created computer code does not contain errors arising from misinterpretation of the specifications, but it must be tested before using it in safety-critical systems. Due to the length and complexity this is a time-consuming task. VI. CONCLUSIONS Rapid control prototyping reduces significantly the time and costs of implementing a prototype of new function. Although thorough modeling of the process may take a lot of effort, the advantages gained afterwards are numerous. Simulation study combined with automatic code generation of the prototype controller eases the design process and reduces significantly the total engineering work in the prototype testing phase. VII. ACKNOWLEDGMENT The authors gratefully acknowledge the funding received from Sim-Serv for writing this white paper. VIII. REFERENCES [1] [2] [3] [4]
[5] [6]
[7]
Daubechies I.: Ten lectures on wavelets. SIAM, 1992. dSPACE GmbH: Solutions for Control, Catalog 2003. dSPACE GmbH: MicroAutoBox datasheet. Hölttä V. and Eriksson L.: Teaching controller design and system identification: A laboratory experiment with real-time control. The Nordic Matlab Conference 2003, Copenhagen, Denmark. Palmroth L.: Rapid control prototyping of forest machine functions. The Nordic Matlab Conference 2003, Copenhagen, Denmark. Palmroth L. and Hölttä V.: Rapid control prototyping in test sequence design for condition monitoring of a hydraulic valve. IEEE Conference Mechatronics and Robotics 2004, Aachen, Germany. Åström K. J. and Wittenmark B.: Computer controlled systems: theory and design. 3rd ed. Prentice Hall, Inc 1997.