Reliability databases in perspective - IEEE Xplore
Recommend Documents
data is being stored in NoSQL databases, security issues become growing concerns. ... The recent advance in cloud computing and distributed web applications ...
factor affecting the reliability of electronic equipment. Today, because of ... when asked about Sony's perspective on reliability prediction methods during a US ...
M. T. Chao. J. C. Fu. M. V. Koutras. The reliability of C( k,n:F) was first studied by Kontoleon. [48 - 511 ... examples from Chiang & Niu [18] and Chao & Lin [14].
clientiserver examples, including file servers, database servers, video servers, ... Contract Placement. 28. IEEE Communications Magazine February 1998 ...
Passengers on Connecting Itineraries experience trip delays due to: â Delayed flights (Hub to Destination). â Rebooked due to Cancelled flight (Origin to Hub).
experimental validation using accelerated life tests. ... Fatigue lifetime of TPVs in glass is predicted .... The glass used in this study is provided by Asahi Glass.
Jianan Xue 0 Wayne State University 0 Detroit. Key words: Continuous state reliability analysis, state tree analysis, design for reliability, degradation. SUMMARY ...
SSD array storage using RAID mechanism. The proposed method enhances the reliability of SSD array. 2% higher than that of existing RAID system and.
Reliability Prediction for TFBGA Assemblies. Zoran Radivojevic, Yasir ... predict failure rates. ... dissipated in the electronic components or by environmental.
those of press-packed GTOs. Although first. IGBT-press-pack solutions have been presented to the market, IGBT-presspacking remains difficult and expensive.
Reliability Allocation Through Cost Minimization. A. O. Charles Elegbede, Chengbin Chu, Member, IEEE, Kondo H. Adjallah, and Farouk Yalaoui. AbstractâThis ...
System Optimization With Component Reliability. Estimation Uncertainty: A Multi-Criteria Approach. David W. Coit, Member, IEEE, Tongdan Jin, and Naruemon ...
Meilin Wen, Assitant Professor, Beihang University. Yunxia Chen, Professor, Beihang University. Key Words: reliability metrics, reliability evaluation, aleatory ...
lamp, 0; the trigger pulsewidth, t,; and the normalized trigger pulse overvoltage (V, - V,,)/Vd, ... circuits for xenon flashlamps is the reliability whh which the energy ...
AbstractâThis paper proposes a reliability-based turbo detec- tion scheme for multiple-input multiple-output (MIMO) systems with frequency-selective fading.
each customer's service entrance. This paper presents a new method, termed Hierarchical Markov Modeling. (HMM), which ca
Key Words-Multiple objectives, Interactive optimization, Reliability ... The method determines the most preferable reliability allocation are formulated as follows:.
Use of degradation data for reliability estimates and maintenance decisions are presented. Index TermsâDegradation modeling, equivalence of test plans,.
[14] R. N. Allen, R. Billinton, I. Sjarief, L. Gloel, and K. S. So, 'A Reliability ... Richard D. christie received his B.S. and M.E. degrees from Rensselaer in. 1973 and ...
Feb 8, 2016 - ... Takeshi Kaneko, Student Member, IEEE, and Sho Sakaino, Member, ...... [27] T. Tsuji, T. Yokoo, Y. Hasegawa, K. Abe, Y. Sakurai, and S. Ishii,.
retrieval approach based on virtual images to perform content-based retrieval. ... Index TermsÃImage databases, query by image content, iconic indexing, ...
the system and a damage model, such as a fatigue prediction model. Information for ... Index TermsâElectronic components, fatigue, modeling, Monte. Carlo ...
Reliability databases in perspective - IEEE Xplore
AbstractâConcepts and methods used in designing modern. RDB (reliability data banks) are reviewed. Taxonomies for failures and maintenance actions are ...
294
IEEE TRANSACTIONS ON RELIABILITY, VOL. 51, NO. 3, SEPTEMBER 2002
Reliability Databases in Perspective Roger Cooke and Tim Bedford
Abstract—Concepts and methods used in designing modern RDB (reliability data banks) are reviewed. Taxonomies for failures and maintenance actions are not fully standardized and can cause confusion. Section II summarizes current usages. The structure of the raw data is identified as: component socket histories with competing risk. Successive sections discuss data-structure and operations on data, data analysis with and without competing risk, and the analysis of uncertainty. In the context of reliability data, the assumption that competing risks are -independent is frequently unwarranted. Models for dependent competing risk are discussed, and illustrated with examples from pressure-relief-valve data at two Swedish nuclear-power stations. Some lessons learned are: The needs of various users of reliability databases must be distinguished. The interests and requirements of a maintenance engineer are very different from those of a risk analyst or a component designer. It is unlikely that a single reliability number serves these diverse needs. The problem of analyzing reliability-data has become a problem of data compression. Years ago, analysts justifiably complained about the sparseness of reliability data. With the advent of computers, automated sensors, and condition monitoring, there is no reason for sparseness today. The problem is knowing what to collect, how to make sense of the wealth of data that one can gather, and what to do with it. To be useful, reliability data must reveal not only the probability of failure, but also the cause of failure. Thus, competing factors causing the termination of service sojourns must be quantifiable from reliability data. Failure-causes interact, and this interaction makes the problem of quantification very challenging. Index Terms—Censoring, colored Poisson process, competing risk, dependent censoring, dependent competing risk, maintenance model, reliability database.
ACRONYMS1 CB Cdf CM iff
MLE MTBF pdf PM
-confidence bounds cumulative distribution function corrective maintenance if and only if time-wise lower-bound for average failure rate time-wise upper-bound for average failure rate maximum likelihood estimate mean time between failures probability density function preventive maintenance
Manuscript received March 1, 2000; revised January 16, 2001. Responsible Editor: J.-C. Lu. R. Cooke is with the Department of Mathematics, Delft University of Technology, Mekelweg 4, 2628 CD Delft, The Netherlands (e-mail: [email protected]). T. Bedford is with the Department of Management Science, Strathclyde University, Glasgow, Great Britain (e-mail: [email protected]). Publisher Item Identifier 10.1109/TR.2002.802889. 1The
singular and plural of an acronym are always spelled the same.
r.v. RC RDB ROCOF Sf TTT
random variable random clipping reliability data base rate of occurrence of failure survivor function (reliability) total time on test DEFINITION
ip, ips, ip
similar to “it, its, it” except that the “p” implies person, whereas the “t” implies thing. NOTATION
obr
Sf sub-Sf Cdf sub-Cdf constant failure rate time-dependent failure rate observed failure rate repair rate conditional probability of censoring I. INTRODUCTION
R
ELIABILITY parameters characterize populations that emerge from complex interactions of components, operating environments, and maintenance regimes. This paper reviews the mathematical tools for defining and analyzing populations from which reliability data are to be gathered. Such analyses form a subfield of lifetime data analysis with its own specific features. These features emerge from the uses to which reliability data are put. Modern RDB are intended to serve at least 3 types of users: • the maintenance engineer interested in measuring and optimizing maintenance performance, • the component designer interested in optimizing component performance, • the risk/reliability analyst wishing to predict reliability of complex systems in which the component operates. To serve these users, modern RDB can distinguish at least 10 failure modes: mutually exclusive ways of terminating a service sojourn. Different users are typically interested in different failure modes. Critical failures are of primary interest in risk and reliability calculations. A maintenance engineer is interested in degraded and incipient failures, because these are often associated with PM. A component designer is interested in the particular component function that is lost and in the failure mechanisms. In addition to failure modes, modern RDB also have data fields relating to component characteristics,
COOKE AND BEDFORD: RELIABILITY DATABASES IN PERSPECTIVE
component boundary, operating characteristic, and maintenance/repair policy. Because decision-makers increasingly demand an assessment of uncertainty in risk and reliability calculations, modern RDB also provide uncertainty-intervals for failure-rate estimates. The systematic collection of reliability-data dates from the Titan Missile program [39]. Since the 1980s there have been many attempts to provide systems for collecting and organizing raw data, and to standardize the information presented in the data banks. The Center for Chemical Process Safety of the American Institute of Chemical Engineers (CCPS) published its Guidelines for Process Equipment Reliability Data [18] in 1989. Other Guidelines are in [4], [20], [21], [26], [30]. Lannoy [32] and the ESReDA Working Group [40] represent current practice in Europe. A special issue of Reliability Engineering and System Safety (vol. 51, num. 2) is devoted to the design of reliability databases. For an historical perspective, see [19]. The problem of designing an RDB is the problem of extracting estimates from the raw data. The first problem is finding an appropriate mathematical representation for the raw data. Because failure modes are mutually exclusive, think of failure modes as marks or colorings of an underlying point-process. The theory of colored Poisson processes has been used implicitly and explicitly for this purpose [38]. Also, think of mutually exclusive failure modes as risks which are competing to terminate the current service sojourn. The failure-mode seen is the risk which succeeded in killing the component first; which risks might have killed the component a little later are not seen. A colored Poisson process can be viewed as a renewal process generated by an independent exponential competing risk model for interarrival times (see Section VI-B). The general theory of competing risks, not necessarily independent and not necessarily exponential, is advanced here as a suitable mathematical language for modeling reliability data. Competing-risk data resemble what statisticians call “right censored data.” The language of censoring, however, is more appropriate to the analysis of cohort populations where the interest is in death due to a specific cause (e.g., the treated disease), and one lumps together as “censoring” everything which prevents observing this cause, e.g., moving out of town, death by other causes, termination of observation period. A simple example illustrates the problem of competing failure risks. RE (a reliability engineer) buys a new car and collects reliability life data. RE logs the times at which the car is taken in to repair a breakdown (failure). RE maintains the car fastidiously: every Sunday morning RE repairs anything which is not functioning normally even though no breakdown has occurred. These “noncritical repairs” are logged as PM. RE’s neighbor, who never works on ips own car, asks RE how reliable RE’s car is. If the neighbor uses the methods currently used in most RBDs, the neighbor estimates the rate of occurrence of breakdowns (failure rate) in ips own car via the TTT statistic (see Section VII-A): the number of failures divided by the total time in operation. The TTT statistic is the “observed rate of failure”: the rate at which failures befall the fastidious RE in spite of RE’s PM. It could also be something else, and herein resides much confusion. If the PM were performed randomly,
295
then the TTT statistic also estimates the rate of failures when no maintenance is performed. This latter is called the “naked failure rate.” Now what does the neighbor want to know? Because the neighbor never works on ips own car, ip wants to know the rate of failures when no maintenance would be performed. In other words, the neighbor wants to know the naked failure rate of RE’s car. If these two rates are the same, then RE would be a very poor reliability engineer indeed. RE’s maintenance efforts would be totally ineffective; failures would be just as frequent if RE did nothing. PM is supposed to prevent failures while losing as little useful service time as possible. This requires that PM be highly correlated to failure. Ideally, the car is PMed at time iff it would have failed shortly after . In sum, the modern RDB user is not only interested in when a component expires, but also why it expires. Such users distinguish several risks which are competing to terminate each service sojourn. Begin with taxonomies for maintenance and failure and the data structure for component socket histories. Standard techniques for data analyses are based on the absence of competing risks. After discussion of these, then the discussion is on the mathematics of competing risk, and on some competing-risk models. Uncertainty in estimation of failure rates under competing risks arises from statistical fluctuations and from nonidentifiability. Both sources of uncertainty must be considered. Conclusions draw together some lessons learned. This research draws on [7], [9], [10], [36], [41].
II. MAINTENANCE AND FAILURE TAXONOMIES First, distinguish between types of maintenance jobs (CM and PM), and ways in which maintenance is scheduled: calendar based, condition based, opportunity based, and emergency. A. Maintenance Taxonomy The 2 maintenance types are: • PM: Jobs which do not repair a fault or failure, but are part of regular servicing. • CM: Jobs to repair a defect, fault, or failure. The 4 scheduling types are: Calendar Based: Planned maintenance activities, not based on observed deterioration of component, but scheduled from calendar time, or some surrogate, such as cycles or cumulative load. This maintenance does not repair anything, and involves PM. Condition Based: The component’s state is observed to deviate from that which the manufacturer intended, though the component’s functionality (as required by the system in which it serves) is still maintained. Hence one can leave the component in socket until a suitable maintenance opportunity arises. This maintenance is therefore planned and corrective. It is typically triggered by indicators of degradation such as leaking, dirty oil, abnormal power consumption, vibration, noise, or heat. Opportunity Based: Maintenance is undertaken when a suitable opportunity presents itself. If the system is shut down for
296
IEEE TRANSACTIONS ON RELIABILITY, VOL. 51, NO. 3, SEPTEMBER 2002
TABLE I MAINTENANCE JOBS AND SCHEDULES
overhaul of one component, other components can be maintained as well. The decision to maintain a component at an opportunity might or might not be triggered by the condition of the component.2 Emergency: Actions to repair a component which is in a state that disables the system. The system cannot function until the repair is done, and the repair activity was not planned beforehand. Repair actions usually begin almost immediately after component failure. Postponing repair is not an option. Maintenance crews typically would like to prevent emergency maintenance from occurring. The way maintenance is scheduled can influence the type of maintenance which is performed. Although usage is not standardized in this regard, there is some currency in using these concepts; see Table I. B. Failure Taxonomy The 4 failure types are: Degraded Failure: A component is not in the state which the manufacturer intended for performing its function, but the system function is being fulfilled. The component is in a: noncritical degraded state. Critical Failure: The component is unable to perform its function due to critical-degradation of its state. Critically-degraded components are always repaired or renewed, and the repair typically begins as soon as possible. Critical failure can be total or nontotal. Entrained Functional Unavailability: The functionality of the component is lost due to upstream failure of some supporting system. The component need not be repaired. Total failure: The component not only fails to meet specifications, but fails to meet specifications to any degree. Non-total critical failure occurs when the component fails to meet specifications but still has some residual functionality, as when a pump cannot deliver the required flow rate but can still deliver some flow, or a valve does not close in the required time, but still closes. The terms “functional” and “nonfunctional” describe failures in a way which is complementary to the way they are used to describe component states. Thus a functional-failure puts the component in a nonfunctional state. Table II supplements Table I by including the types of repairs typically performed. There are, of course, exceptions, e.g., some components might be allowed to remain in-line even though 2There is considerable overlap between the notions of condition-based and opportunity-based maintenance. Opportunity-based maintenance is not considered further in this paper. It is included here for completeness.
TABLE II MAINTENANCE AND FAILURE TYPE
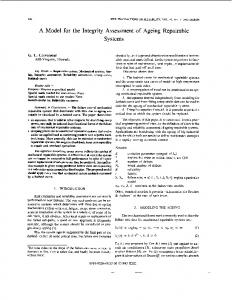
their functionality is totally lost; in this case the repair of a critical failure might be planned. Fig. 1 displays the various maintenance and failure concepts in a plot of state against time. C. Operating Modes, Failure Causes, Failure Mechanisms, Failure Modes It is common now to distinguish 3 operating modes: • Continuous operation: The component operates as long as the system operates • Standby: The component is dormant unless required to function on demand • Alternating (or intermittent): The component rotates sojourns of continuous operation with one or more spares. Components in the alternating mode are planned to relieve each other according to a regular schedule, whereas components on standby are typically brought into service when the front-line component is failed or in repair. The following terms are encountered in the literature. Though their use is not standardized, we use the definitions: Failure causes: These give the reasons why a component fails. RDB often list only local causes, viz, causes within the component itself (vibration, leak, crack, etc.). However these local causes themselves can be caused by factors outside the frame of the RDB, e.g., a component fails due to over-stress caused by other failures upstream. These are sometimes called root-causes. If root-cause analysis has been performed, the results would typically enter an RDB in the form of free text. Failure mechanisms: These describe the actual physical processes leading to a failure. Thus, the failure-cause might be “leak in the oil lines” and the failure-mechanism might be “jamming of piston.” The distinction between cause and mechanism is frequently discretionary. Time-related or demand-related failures: This distinction usually coincides with operating mode. Thus, a failure occurring when the component is called into service from the standby mode is classified as demand-related. Failures occurring while the component is in continuous operation are classified as timerelated. Because the same component type might operate continuously or in standby, this component can have both demand-related and time-related failures. Failure modes: These describe the way in which a component fails, usually from a functional or sub-functional point of view e.g., “fails to open,” or “fails to close.” It becomes necessary to distinguish failure modes when the consequences of a failure depend on the way in which a component fails.
COOKE AND BEDFORD: RELIABILITY DATABASES IN PERSPECTIVE
Fig. 1.
297
Maintenance and failure in time. TABLE III COMPONENT SOCKET TIME HISTORIES (#314 PRESSURE RELIEF VALVE)
III. DATA STRUCTURE AND OPERATIONS The data consist of: • component socket-time histories, organized in hierarchical categories, • incident data, as shown in Table III from the Swedish TUD RDB. The hierarchical categories identify the hardware in the system down to the smallest maintainable part, the subcomponent. The incident-fields include failure-fields describing each exit from ser-
vice, and repair-fields describing events leading to re-entry into service. These events might be replacing a defective part, or repairing a part. Any repair action is complete, the repair crew never returns a part to service unless it is believed to be as good as new (this of course must be verified). Some authors (e.g., [2]) have inveighed against confounding nonrepairable systems (failures replaced by new parts) and repairable systems (failures repaired, perhaps not completely). Successive service sojourns of nonrepairable systems generate a renewal process, whereas sojourns of repairable systems might not. The distinction is not
298
material here. In a competing-risk context, complete repair, even complete replacement, does not guarantee that the competing risk process is a renewal process (see Section V). Mathematically, a time history is a colored point process. The “points” are the event-times logged in the database. Each “point” bears some properties describing the event. A grouping of properties into mutually exclusive and exhaustive sets is called a coloring. The notion of a “colored point-process” resembles the “marked point-process” in the literature. However, in a marked point-process the distribution over the possible marks, given that an event has occurred, is independent of the history of the process. Competing-risk processes produce colored point-processes. are competing to After each event, risks (or colors) cause the next time-event. When the next time-event occurs, observe which risk caused it. Three main types of operation can be performed on the data. A. Superposition Time histories having the same begin and end points can be superposed. The set of event-times of the superposition is the union of the event-times of superposed processes. In general, superposing scrambles any structure in the individual processes. A notable exception occurs when superposing -independent (homogeneous or nonhomogeneous) Poisson processes. Because the intensity function of these processes does not depend on the history of the process, the intensity function of the superposition is the sum of the intensity functions of the superposed processes, and is -independent of the process history. B. Pooling Pooling is applied to data generally. The pooled data are considered as multiple realizations of the same r.v. or stochastic process. When time histories are pooled, they are considered as realizations of the same (colored) point process. When interevent times are pooled, they are considered as realizations of the same distribution. Typically, but not always, inter-event times are pooled when the individual processes are believed to be renewal processes. C. Coloring/Uncoloring A coloring of time events is a partition of the event properties into mutually exclusive and exhaustive classes (colors). A colored process can be uncolored simply by giving each event the same color. D. Illustrations To illustrate superposition and pooling, let the outages of the steam Pressure Relief Valve V001 of the 314 system be due either to the subcomponent “sensor” or to the subcomponent “valve.” Then the outage times of the valve and sensor can be superposed to form the outage times of the V001 pressure relief valve. If the sensor is renewed whenever the valve is repaired, and conversely, then the superposition is a renewal process, and the individual valve and sensor histories in general are not renewal processes. On the other hand, if the sensor is not renewed when the valve is repaired, then the superposition, viz, the V001
IEEE TRANSACTIONS ON RELIABILITY, VOL. 51, NO. 3, SEPTEMBER 2002
valve, is not a renewal process. The inter-outage times of the V001 and V002 valves in the 314 system can be pooled to form the set of inter-outage times for 314 valves. The outage events can be colored according to the subcomponent which failed the component, or they can be colored according to: the method of detection, effect, repair type, or length of repair, etc. Thus, the rule of thumb is: Superpose until “as-good-as-new,” and then pool similar histories. For a more detailed discussion of operations on component socket-time histories and relevant statistical tests to support these operations, see [36]. Statistical reference books are [13], [25], [42]. IV. DATA ANALYSIS WITHOUT COMPETING RISKS The analysis of data not subject to competing risk is briefly reviewed. A component enters service and remains in service until it fails. There is no other cause of termination of a service sojourn. Because this material is available in standard textbooks, [5], [25], [29], [33], this discussion is brief. A. Demand Related Failures Components subject to demand can be either nondegradable (not subject to maintenance), or degradable (typically maintained). The statistical analysis of the failure data for nondegradable is quite simple. Each demand can be modeled as a flip of a coin; assume, for each component type, that the probabilities of failure per demand are -independent and identical. The probability of observing failures in demands is: failures in
trials
failure per demand . The MLE of , given failures in trials, is . For failures in observations, the 90% CB are
or more failures in
largest such that: trials
or fewer failures in
least such that: trials
A component called to function on demand is in the standby mode. Some failure mechanisms, notably those associated with wear, are disengaged during stand-by, while others, notably those associated with corrosion, oxidation, or embrittlement, continue during standby. Therefore components on standby are often subjected to maintenance. Knowledge of the maintenance policy is necessary for determining reliability parameters from data. This is illustrated by 2 popular maintenance-policies. • Test-and-Replace Components are tested at regular interval , and if found in a failed state they are replaced immediately by new components of the same type. The failure probability, on demand, for uniformly distributed demand is: for • Fail-and-Fix
COOKE AND BEDFORD: RELIABILITY DATABASES IN PERSPECTIVE
A component with constant is allowed to fail and then taken off line and repaired. During repair the component is unavailable and would lead to a demand failure if demanded during outage. The is also constant; thus the equilibrium unavailability is
This formula remains valid when the variables are not exponential, and when the rates are interpreted as the inverses of -expected lifetimes. Evidently, -identical components subject to standby degradation do not yield the same demand probabilities when they are maintained in different ways. For such components, the user cannot interpret a failure probability on demand, unless the user knows the testing interval (when using test-and-replace) or the repair rate (when using fail-and-fix). Additional complications arise if a hybrid maintenance policy is pursued; components tested regularly and pulled off-line for repairs.
299
Let a sequence of observations of the lifetime variable be made: observe . number of failures up to time . Definition 1: The ROCOF is the derivative of the -expected number of failures up to time ,
Using the simple Poisson-gamma Bayes model, estimate the uncertainty about the ROCOF of a class of components which are considered -identical for the purposes of lifetime estimation. Specifically, let the pattern of failures is follow a homofailures in operating geneous Poisson process. There are time, . The ROCOF is , an uncertain quantity, and is modeled by a gamma distributed r.v. Let the prior distribution for be the gamma distribution: , with pdf
B. Time-Related Failures , be -independent variables with paLet ; the rameter , such that their Cdf is is: MLE for , given observations
After observing for is
failures in time
, the posterior distribution
(1) (2)
-Confidence intervals are based on the fact that has a distribution with degrees of freedom. The 90% symmetrical -confidence interval has the lower and upper limits: and : largest least
such that such that
less than
If the pattern of failures follows a Poisson process with rate the
with probability 1 as dated, then
. When a prior
,
is up-
more than
Instead of -identical components, let there be 1 component with constant failure rate which fails and is repaired to as good as new, or replaced with a new, -identical component. The number of failures as a function of time is a Poisson process with parameter . The -expected number of failures in time is . Given failures in time , the MLE of is . The . MTBF is C. Bayes Models Bayes methods have had a strong impact on the design of RDB. First, the simple Poisson-gamma model is discussed. The strength in Bayes models, however, lies in their ability to combine different types of data via hierarchical inference models. The 2-stage hierarchical model, used in the TUD RDB [38], is discussed briefly; this model has been reviewed in [11] and discussed in [16], [35]. A similar 2-stage model was proposed independently in [24]. An earlier model developed for components in nuclear-power stations has found extensive application [1], [27]; the goal was to capture both generic and plant-specific data sources.
with probability 1. Hence, if the posterior -expectation is used to estimate , it will converge in probability to the true value, i.e., this estimator is -consistent. The Pörn Model: A Bayes model for dealing with plant-to-plant variability has been adopted by the Swedish Nuclear Inspectorate [38]. Consider a collection of classes of components. Each class consists of components which are -identical for lifetime estimation, and which are used in a specific plant under plant-specific conditions. Different plant-specific conditions lead to different ROCOF. Using data from given plants to infer the ROCOF in another plant, assumptions are necessary about the underlying relationship between the ROCOF of the various plants. In the Pörn model, these ROCOFs are treated as -independent realizations of random quantities with the same distribution. Specifically: 1) The pattern of failures at each plant is follows a Poisson process. At plant , there are failures in operating time, . The plant specific ROCOF is , a realization of the r.v. .
300
IEEE TRANSACTIONS ON RELIABILITY, VOL. 51, NO. 3, SEPTEMBER 2002
2)
has a gamma distribution3 with unknown parameters . The uncertainty over values of is modeled by assuming that is a random vector. are conditionally -independent realizations 3) . of , given , then are -indepen4) Given dent. are 5) Given , then , -independent. A consequence of this -dependence structure is that data from plant can influence only one’s beliefs on the ) through its influence on one’s beliefs on the value of ( value of . Inference Under the Pörn Model: Let there be data from plants ; choose a prior distribution for ; and update the distribution of the hyper-parameters . There is information on from 2 directions: 1) The influence of all of the data on the prior beliefs of the value of . on 2) The influence of the plant-specific data . the beliefs about the value of Under the Pörn model assumptions, the likelihood function given the data ( ) is proporof tional to
(sometimes called the naked failure rates). The theory of independent competing risks is developed in [12], [14], [15], [22], [34]. ; let be the Let there be competing risks, . In a competing-risk context, observe minimum of the minimum of the , and observe which it is; i.e., observe
is cured, if it is eliminated without disturbing the distributions of the other risks. Mathematically, curing risk corresponds to observing
the distribution of . over
is obtained from that of and
Let
,
by integrating
are -independent.
be -independent copies of . The process is the competing-risk renewal-process associ-
ated with . , Let necessary, let the first
, and observations be
. Re-arranging if
(3) are interarrival times at which The likelihood of
, given
Thus the posterior distribution of , is
was ob-
served,
, is
the interarrival times at which Cdf , pdf , Cdf , pdf . is (because: The probability of
, given data:
was observed.
):
(4) , follow the distribution proportional to Pr hood function in (3)].
[likeliis described by parameter which does not occur in If . then the MLE of does not depend on
,
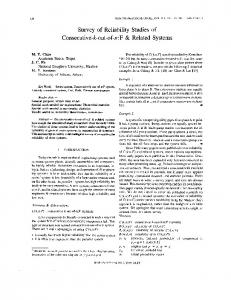
V. COMPETING-RISK CONCEPTS and METHODS To assess the failure rates corresponding to various competing ways of ending a service sojourn, the situation is: competing risk. Various “ways of dying” are competineg (as it were) to terminate the component’s service sojourn. Section IV shows that a failure event can be described by assigning values, or colors, to several failure fields. Fig. 3 shows possible fields form the #314 valve. In each failure event, exactly 1 value in each field is realized. A coloring is simply a partition of the set of failure events into disjoint subsets. In practice, choose 1 field for coloring, and then assign different colors to the values in that field. Thus one might color the field “method of detdection” by grouping failure events into “alarm or unintended discovery” and “operator or test or revision.” This section introduces the basic mathematical formalism for describing competing risks. The goal is to extract information about the failure rates of competing failure-modes 3Pörn uses a contaminated distribution: a mixture of a 0( ; ) distribution (whose parameters can be updated) with a 0(0:5; 1) distribution.
A. Subsurvivor Functions and Identifiability Unless stated otherwise, in this section: all distributions have pdfs. and , where is the censoring variable. Consider only is Sf . The failure rate of is:
In the competing risk context, the failure rate of ( ) is the could be observed failure rate which would be observed if without the observation being censored by earlier occurrences , . It is sometimes called the naked failure rate: is of the rate at which failures of type would be observed if all other competing risks were eliminated.
COOKE AND BEDFORD: RELIABILITY DATABASES IN PERSPECTIVE
301
When the competing risks are not eliminated, a different is observed. The observed failure4 rate for failure rate for is defined as
Fig. 2. Calendar-time picture of censored data.
Theorem 1 [9] (Proof is Obvious): If competing risks are -independent, with differentiable Sf, then , . If the competing risks are -independent, then the problem of estimating the naked failure rate does not arise, because the naked and observed failure rates coincide. For notational convenience, focus on 2 competing risks: . is the subsur[3]. depends on , though this fact vival-function of is continuous at 0 then is suppressed in the notation. If . If and are -independent. then
Definition 2: Real functions and on form a (continuous) subsurvival pair if: and are nonnegative nonincreasing (continuous, con, ; tinuous from the right at zero)
If , then has an atom at infinity: there is a nonzero probability that a component with life distribution never expires. Atoms at infinity are invoked in theorem 2. and form a subsurvival pair. If there are data for then the “empirical subsurvival functions” can be calculated; these contain all the information in the data: any parameter that can be estimated from the data can be written as a function of the empirical subsurvival functions. The “conditional subsurvival function” is the subsurvival function, conditioned on the event that the failure mode in question is manifested. Assuming and at zero: continuity of
Closely related to the notion of subsurvival functions is the probability of censoring beyond time ,
For continuous subsurvival functions, The “subdistribution functions” for
. and
are
4Some sources, [29], use the designation “cause-specific failure rate” for what is termed here as: observed failure rate. This is confusing when the competing risks are not s-independent, because both the naked and observed failure rates are cause-specific.
Reference [37] derived bounds on
by noting that
which entails The quantities on the left and right sides are observable. Theorem 2 is the main result for -independent competing risks; it generalizes for competing modes. Theorem 2 [3], [43], [44]: 1. Let and be -independent and continuous. Let and be life variables, with -independent life variables such that and . Then , and . and are a subsurvival pair and are continuous, 2. If then there exist -independent life variables and such that and , and at most 1 of has an atom at infinity. By observing -independent copies of the subsurvival functions can be estimated. Assuming -independence of and , the Sf of and can be determined uniquely; and the distributions of and are identifiable from the censored data. Of course, and might not actually be -independent, and in this case the Sf obtained via theorem 2 would NOT be correct. Moreover, the -independence assumption can never be tested by the censored observations because, according to theorem 2 (2), any censored observations can be explained by an -independent model. B. Colored Poisson Representation of Competing Risks Some RDB [17], [38] suggest a colored Poisson representation of censoring. This section shows that the colored Poisson representation is equivalent to -independent exponentially-distributed competing risks. It also affords additional insight into the model’s assumptions. For visualization, use the following notation: is the failure process, and is to be colored fuchsia, • is the maintenance (censoring) process, and is to be • colored magenta. , where are -inConsider the process . Let data be dependent copies of generated by instantly replenishing a component socket with as-good-as-new components whenever a component exits service. The components exit service either because of failure ( ) or because of PM ( ). Plot the set of observed “inter-arrival in calendar time, then the times” picture in Fig. 2 emerges. is obtained by removing all labels. The process Think of: as the uncolored process, the s as colored magenta, the s as colored fuchsia. The coloring-theorem for Poisson processes is [31]:
302
Theorem 3: Let the uncolored process be a Poisson process with intensity , and the coloring of a point be determined by the outcome of an -independent coin toss; heads for magenta, heads , then the tails for fuchsia with , • magenta points are a Poisson process with intensity • fuchsia points are a Poisson process with intensity , • magenta and fuchsia processes are -independent. can therefore be A colored Poisson process starting at represented as
IEEE TRANSACTIONS ON RELIABILITY, VOL. 51, NO. 3, SEPTEMBER 2002
VI. COMPETING RISK MODELS A. -Independent Exponential Competing Risk Let and be -independent and exponentially distributed -independent copies of with failure rates and . Let be observed. Arrange the observations so as to distinguish the s and s, as follows: Substitute the exponential Cdf and pdf into (4) and set the “derivative of the logarithm” 0; then (5)
where and are the inter-arrival times of 2 -inde, with intensities pendent Poisson processes, starting at and respectively; the uncolored (Poisson) process gotten by . The interleaving uncoloring the points has intensity of the 2 processes is uniquely determined in every realization : failure occurs between the PM’s and if
can be associated with a subsurvival pair as follows: denotes the Sf for the uncolored inter-arrival times,
Now, is the probability of magenta, is the probability of fuchsia. ; Theorem 4 [9]: 1. Let be a colored Poisson process. Then there is a unique -independent competing risk process,
The quantity on the right-hand-side of (5) is the TTT statistic. This result does not depend on the distribution of , as long as it is -independent of . If the censoring is -independent, then neglecting the could produce a important over-estimate for . For reliable components, the sum of the censored lifetimes is typically much larger than the sum of the observed failure times. -Confidence intervals cannot be readily computed for the MLE of under random right censoring, because the sampling distribution of TTT is not available. One could, however, use the asymptotic normality of the MLE to derive bounds, but this is not done here (for a discussion see [5], [33]). Although competing-risk data can always be explained by an -independent model (theorem 2), this does not mean that any censored observations can be explained by a model with exponential-life variables. Rather, a very sharp criterion for exponentiality is derived in terms of the subsurvival functions [8]: and be -independent life variables, Theorem 5: Let then any 2 of the following imply the others: 1) 2) 3)
associated with . Moreover, and are exponentially disand respectively. tributed with Sf be -independent copies of 2. Let ( ), where and are -independent and expoand renentially distributed with Sf be the competing-risk renewal spectively. Let process associated with . Then is a colored Poisson process with intensities and for the and processes, respectively. Consider the distance between an uncolored point , and the . This distance follows an expoprevious uncolored point , because is the nential distribution with failure rate . If is colored by flipping an -indefailure rate of . pendent coin, this does not affect the distribution of Hence, the distance between a maintenance point and its nearest predecessor has the same distribution as the distance between a failure point and its nearest predecessor. In other words, given that a service sojourn terminates in PM, the distribution for the length of that sojourn is the same as the distribution for the length of sojourn given termination in failure. This is illustrated in a different way in remark i) of theorem 5.
4) Remark i: Let and be -independent exponential life variables with failure rates and ; then
In other words, the conditional subsurvival functions are equal (conditional probability of , and exponential, and given survival up to ) is constant. Remark ii: For -independent exponential competing risks, can be computed as , from which
Assuming -independence among all the events, usual methods can be used to test the hypothesis that both of the empirical conditional subsurvival functions follow the same exponential distribution.
COOKE AND BEDFORD: RELIABILITY DATABASES IN PERSPECTIVE
Theorems 1, 4, 5 yield the following characterization of -independent exponential competing risks: If competing risks are -independent and exponential, then the rate of occurrence of each risk is unaffected by curing (eliminating) other risks. In particular, if PM and critical failure are -independent exponential competing risks, then abandoning all PM would not affect the rate of occurrence of critical failures.
303
2. For all
:
Condition 1 of theorem 7 says that the subsurvival functions and are consistent with a random-signs censoring model. For random-signs censoring under the conditions of theorem 7, the conditional probability of censoring is maximal at the origin:
B. Random Clipping Perhaps the simplest model of interaction between an exponential-life process and a warning process is obtained by . assuming that is always censored by a random amount -indepenThat is, is exponential and for some positive r.v. . can be thought of as a warning dent of , observe which a component emits prior to expiring at time . Of course might be greater than , which is interpreted as censoring at birth. Let the censors, at birth, simply be not recorded; i.e., components emitting warnings at birth are simply repaired until the warning disappears, and the false start is not recorded as an incipient failure at time 0. Indeed, this is what usually happens. be a RC of . Thus, in this case Let the variable
is exponential with parameter . be a r.v. -independent of , and Theorem 6: Let . Then conditional on , has the same distribution as . C. Random Signs A simple model for -dependent competing risk is “random signs competing risk” (called age-dependent censoring in [8]). time at Consider a component subject to right censoring; which a component would expire if not censored. Let the event “component expires due to competing risk ” be -independent at which the component would expire, but given of the age that the component expires from , the time at which it expires might depend on . For example, suppose that a component emits some warning of deterioration (leakage, vibration, noise) before expiring (life variable ). If these warnings are perceived by maintenance personnel, then the component will be PMed and competing risk is observed. If the process of perceiving the warnings is -independent of the component’s time in service, then the random-signs model is appropriate. This situation is captured in the definition: , Definition 3: Let and be life variables with , , and sgn . The variable where: is a: random signs censoring of by . be a pair of continuous strictly Theorem 7 [8]: Let monotonic subsurvival functions; then the following are equivalent: , such that 1. There exist r.v. and ,
Not every set of censored observations is consistent with a random-signs censoring model. Assuming continuity and strict monotonicity, theorem 7 says that a random-signs censoring the conditional subsurvival model exists iff for all function for failure dominates that of censoring. Under random-signs censoring the population of observed failures are statistically equivalent to the uncensored population, hence:
Recalling the estimate under -independent right censoring,
and noting that typically for reliable systems, it is evident that the -independence assumption can lead to gross underestimates of the critical failure rate for random-signs competing risk (see example “action taken” in Section VI-B). D. Conditionally -Independent Competing Risks A somewhat more complex model views the competing-risk and , as sharing a common quantity , and as variables, being -independent given :
where , , are mutually -independent. Explicit expresare exponential [23], [36]: sions can be derived for: , , be -independent with Theorem 8: Let , , , , , then 1)
2)
3)
4) 5)
304
IEEE TRANSACTIONS ON RELIABILITY, VOL. 51, NO. 3, SEPTEMBER 2002
6) If has an arbitrary distribution such that Pr and is -independent of and , then
Further, it is easy to see that
,
. Hence:
Together with (5), these give 3 equations for estimating the 3 , , , which show that this model is identifiparameters able from the subsurvival functions (of course, maximum likelihood provides a better means of estimating these parameters). The ratio of the naked over the observed failure-rates for is:
E. Time-Window Censoring When analyzing data, the user chooses a time window, that is begin and end times for observation. The begin-time can typically be chosen to coincide with plant startup (perhaps after major overhaul), thus the inception of observation coincides with the inception of a service-sojourn in each socket. At the end of the time-window, however, each socket will typically have a functioning component whose last service-sojourn is not terminated. Such sojourns are called “time-window censored.”5 Techniques for dealing with time-window censoring and competing-risk are not well developed, but a crude procedure is described to assess the impact of this type of censoring. For a given sojourn, let denote the minimum of all competing risks. Let be a variable describing the time-window censoring. Put for each sojourn which is not time-window censored. If the sojourn is time-window censored, let be the time between the inception of the sojourn and the termination of observation, . and put The data are obtained by drawing sojourns from an urn with draws, on draws the replacement. There are is obtained (on these draws ) and on draws is obtained (on these draws ). Let the have constant failure rate, , and the observations be recorded . The MLE of satisfies as
Fig. 3.
Data fields for coloring.
This gives a rough estimate of the effects of time-window cen, and the equality holds if there are no timesoring. window censors. VII. UNCERTAINTY The Introduction observed that most modern reliability databases provide some indication of the uncertainty of estimates derived from the failure data. Uncertainty bounds convey the restrictions on the possible choices of reliability parameters arising from the observed life data. It is convenient to distinguish uncertainty due to nonidentifiability from uncertainty due to sampling fluctuations. To exclude the effect of sampling fluctuations, it is useful to consider how one should proceed if there actually were infinitely many observations of the censored life process. A. Uncertainty Due To Non-Identifiability: Bounds in the Absence of Sampling Fluctuations be the subcumulative distribution of the life process Let of interest: and let
be the Cdf of the minimum of
and
,
Let Reference [37] observes that the Sf for
be the estimate of the failure rate of if the censoring times are simply ignored. Rearranging the terms:
, satisfies
and shows that these bounds are sharp6 in the following sense. , there are joint distributions with Sf For all and all and , depending on and satisfying
For 5This is distinct from what is commonly called type-II censoring. With type-II censoring, observation of a population at risk is terminated after a predetermined number of failures has occurred.
,
= Cdf[ ], these bounds can also be written as
6Reference [6] notes that the bounds are true only under certain continuity conditions.
COOKE AND BEDFORD: RELIABILITY DATABASES IN PERSPECTIVE
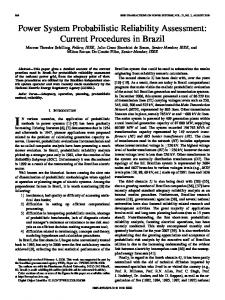
Fig. 4.
Coloring of “failure effect.”
Through any point between the functions and there passes a (nonunique) Cdf[ ] which is consistent with the cen, then sored data. Because If
305
has an exponential distribution with failure rate , then
Hence, the observed data yield an upper bound on . and This result [37] does not say that any Cdf between is a possible Cdf of . Theorem 9 is a simplified version of results in [6], [44]: Theorem 9: If is a Cdf satisfying
Although there might be a wide band between and , the band of exponential Cdf passing through this band can be quite narrow. A better visual appreciation of the data is afforded by considering the time-average failure rates. The for is failure rate so that the time-average failure rate is If , then the time-average failure rate is the (constant) failure rate . Applying this transformation, the [37] bounds become
then there is a joint Cdf for with as marginal distri, bution for iff for all , , with In other words, the distance between increasing in .
and
must be
At each , the set of numbers between and responds to the time-average failure rates at time
corwhich are
306
Fig. 5.
IEEE TRANSACTIONS ON RELIABILITY, VOL. 51, NO. 3, SEPTEMBER 2002
Coloring of “action taken.”
consistent with the data, up to . As , then so that . Hence the lower bound on the admissible values of the time average failure rate decreases as time becomes large. The [37] bounds are the endpoints of the intersection for all of the admissible time-average failure rates: [37] bounds
B. Accounting for Sampling Fluctuations The bounds developed in Section VII-A reflect a lack of due to nonidentifiability of the Cdf for knowledge in caused by censoring. This lack of knowledge cannot be reduced by observations unless the censoring is suspended. In practice, there is another lack of knowledge: that caused by a limited number of observations. The [37] bounds can be used to obtain classical CB depending on time (time-wise bounds). Bounds -independent of time
have been given based on a nonparametric test [6] and based on a test [41] which also compares these two bounds for several data sets. The derivation of time-wise bounds is straightforward. The [37] bounds are:
For each , the and can be estimated from the data. Classical CB on these estimates can be substituted into the previous formula to yield classical CB for the time-average failure rate of , for each time . of -independent observations of If in , the event is observed, then
COOKE AND BEDFORD: RELIABILITY DATABASES IN PERSPECTIVE
307
Fig. 6. Coloring of “method of detection.”
is approximately standard Gaussian where can be estimated as . Hence the classical can be written as 5% lower CB for
• in 95% of the -samples the empirical version of is less than . This does not mean that 95% of the -samples lie above [below ] for all .
(6) observations of the Similarly, for -independent observations of 95% classical CB for
in then an upper is (7)
is now estimated as . The curves and have the following interpretation. If samples of size are , then for each repeatedly drawn from the Cdf of , • in 95% of the -samples the empirical version of is greater than , and
VIII. EXAMPLES OF DEPENDENT COMPETING RISK MODELS Pressure-relief valves are designed to open when pressure exceeds a certain limit. A typical boiling-water reactor has 20 pressure relief valves inside the containment. These are tested once a month. The data discussed below come from 1 Swedish nuclear-station operating 2 identical reactors, from the period 01/01/1978 up to 01/09/1995. This yields a total 17.5 12 20 2 8400 socket-months. In each socket, 1 sojourn is timewindow censored, and these censors amount to 1995 months, leaving 6405 socket months. There are 252 sojourns which are not time-window censored. The following analyses are based on these 6405 socket months and 252 sojourns. Fig. 3 shows
308
Fig. 7.
IEEE TRANSACTIONS ON RELIABILITY, VOL. 51, NO. 3, SEPTEMBER 2002
Coloring of “subcomponent.”
the data fields which can be selected for coloring; these fields are failure detection, failure effect, action taken, and subcomponent. The user chooses a field and applies 2 colors, light and dark, to the elements of the selected field. Thus in Fig. 3, the field “Effect of Failure” is chosen and the first 9 effects are colored dark, while the last effect, “nonfunctional” is colored light. “Type 1” always corresponds to the dark coloring. Four analyses, based on applying a coloring to each field, are presented. To gauge the effect of time-window censoring, consider the minimum of the dark and light variables, and assume . The this follows an exponential distribution with parameter minimum does not depend on which field is selected for colis estimated as oring. Ignoring the time-window censors, . A. Failure Effect In Fig. 4, the field “Failure effect” is selected for coloring. The functional failures have been darkened, and the “nonfunc-
tional failure” is colored light. There are 124 functional and 128 nonfunctional failures with total sojourn times 2938 and 3467 months, respectively. The functional failures include “fail to open” and “fail to close.” These are both essential functions of a valve, but from the risk view-point only “fail to open” would be important. Fig. 4 shows the subsurvival and conditional subsurvivor functions. The is the probability of a service-sojourn terminating due to color . The subsurvival plots show that the probability is about one half that a sojourn ends in functional failure. The conditional subsurvival functions are more or less equal. This is consistent with the -independent exponential model (theorem 5) and with the conditional -independence model (theorem 9). The -independent exponential model also is constant. Fig. 6 is not wholly convincing predicts that in that respect. The conditional -expectation model is more flexible in this respect and yields an estimated failure rate of 0.02 failures/month. Nonetheless, proceed here with the -independent exponential model. The lower 2 plots show
COOKE AND BEDFORD: RELIABILITY DATABASES IN PERSPECTIVE
the time-wise bounds on the time-average failure rate. The estimated failure rate with this model is failures/month. Apparently the difference in these models is not great. The bottom 2 plots show the time-wise average failure rate bounds as given in (6) and (7).
309
be equal. This is the signature for the -independent exponential model. The naked failure rate is estimated on this model as . REFERENCES
B. Action Taken Now, color the field “action taken.” The dark color corresponds to the action “Replace,” the light color to the other possible actions. There are 57 (dark) sojourns terminating in “Replace” and 195 other (light) sojourns. The total sojourn times for these 2 (dark, light) colors are 1812 and 4593 months, respectively. It is not unreasonable to suppose that the other actions are undertaken with the goal of prohibiting or intercepting the action “Replace.” In this case the maintenance personnel might plausibly behave in accordance with the random-signs model. That model predicts that the conditional subsurvivor function for “other” should lie below that for “Replace,” and that should take its maximum value at the origin. Fig. 5 confirms these predictions. These patterns are not at all consistent with the -independent exponential or conditional -independent model. The “random-signs estimate” . Had the -indeof the dark failure rate is pendent exponential model been used, the estimate would be . If the maintenance crew is trying to prohibit “Replace” actions while losing as little useful service time as possible, then the number of “Replace” actions should be small relative to the number of others and the anticipated sojourn-times ending in “other” is only a little shorter than the anticipated sojourn times ending in “Replace” [28]. When these maintenance indicators are applied to these data, the maintenance crew appears to be doing a good job. The lower 2 graphs (Fig. 5) show the time-wise average failure-rate bounds. For “Replace,” the random-signs and -independent exponential models are shown. Both lie within the bounds, and the latter is a factor 3 lower than the former. C. Method of Detection Fig. 6 shows the results of applying coloring to the field “Method of detection.” The dark color corresponds to “alarm” or “unintended discovery.” Discussions with maintenance personnel indicated that these were indeed events which they would try to avoid. There are only 4 such events (dark), and 248 other (light) events. The total sojourn times are 185 (dark) and 6220 (light). As in the example in Section VIII-B, the random-signs model seems appropriate. The random-signs . estimate of the dark failure-rate is D. Subcomponent The most important (and expensive) subcomponents in the pressure-relief valves are piston and valve. Fig. 7 shows the coloring of subcomponent, with “valve” and “piston” colored dark, and the others colored light. There are 202 dark events with a total sojourn time of 5055 months; there are 50 light events with a total sojourn time of 1350 months. appears to be constant and the conditional subsurvivor functions appear to
[1] A. Mosleh and G. Apostolakis, “The development of a generic data base for failure rates,” in Proc. ANS/ENS Int’l. Topical Meeting on Probabilistic Safety Methods and Applications, 1985. [2] H. Asher and H. Feingold, Repairable Systems Reliability: Marcel Dekker, 1984. [3] A. V. Peterson, “Expressing the Kaplan–Meier estimator as a function of empirical subsurvival functions,” JASA, vol. 72, no. 360, pp. 854–858, 1977. [4] B. Tomic, “Multi-purpose in-plant data system,”, Technical report IAEA, 1993. [5] L. J. Bain, Statistical Analysis of Reliability and Life-Resting Models: Marcel Dekker, 1978. [6] T. Bedfod and I. Meilijson, “A characterization of marginal distributions of (possibly dependent) lifetime variables which right censor each other,” Annals of Statistics, vol. 25, pp. 1622–1645, 1997. [7] T. Bedford and R. M. Cooke, Probabilistic Risk Analysis, Foundations and Methods: Cambridge University Press, 2001. [8] R. M. Cooke, “The total time on test statistic and age-dependent censoring,” Statistics and Probability Letters, vol. 18, 1993. , “The design of reliability data bases—Parts i and ii,” Reliability [9] Engineering and System Safety, vol. 51, pp. 137–146, 209–223, 1996. [10] R. Cooke, T. Bedford, I. Meilijson, and L. Meester, “Design of reliability data bases for aerospace applications,” European Space Agency, Department Math, Delft, Technical Report 93-110, 1993. [11] R. M. Cooke, J. Dorrepaal, and T. Bedford, “Mathematical review of Swedish Bayesian methodology for nuclear plant reliability data bases,” in The Practice of Bayesian Analysis, S. French and J. Q. Smith, Eds: Arnold, 1997. [12] D. R. Cox, “The analysis of exponentially distributed life-times with two types of failure,” J. R. Statistics Soc. B., vol. 21, pp. 414–421, 1959. [13] D. R. Cox and P. Lewis, The Statistical Analysis of Series of Events: Methuen, 1996. [14] M. Crowder, “On the identifiability crisis in competing risks analysis,” Scand. J. Statistics, vol. 18, pp. 223–233, 1991. [15] H. A. David and M. L. Moeschberger, The Theory of Competing Risks: Charles Griffin and Co., 1975. [16] E. Hofer and J. Peschke, “Bayesian modeling of failure rates and initiating event frequencies,” in Safety and Reliability, Schuller and Kafka, Eds: Balkema, 1999, pp. 887–887. [17] “EIREDA European Industry Reliability Data Handbook,” C.E.C.-J.R.C., ISEI 21 020 ISPRA, Varese, Italy, EDF - DER/SPT 93206, France, 1991. [18] Center for Chemical Process Safety, “Guidelines for process equipment reliability data,”. [19] J. R. Fragola, “Reliability and risk analysis data base development: An historical perspective,” Reliability Engineering and System Safety, vol. 51, pp. 125–137, 1996. [20] , “Reliability data bases: The current picture,” Hazard Prevention, pp. 24–29, Jan./Feb. 1987. [21] G. Johanson and J. Fragola, “Synthesis of the data base for the Ringhals 2 PRA using the Swedish ATV data system,” in ANS/ENS Int’l. Meeting on Thermal Reactor Safety, 1982. [22] M. Gail, “A review and critique of some models used in competing risk analysis,” Biometrics, vol. 31, pp. 209–222, 1975. [23] P. Hokstadt and U. Jensen, “Predicting the failure rate for components that go through a degradation state,”, 1998. [24] S. C. Hora and R. L. Iman, “Bayesian modeling of initiating event frequencies at nuclear power plants,” Risk Analysis, vol. 10, no. 1, pp. 102–109, 1990. [25] A. Hoyland and M. Rausand, System Reliability Theory: Models and Statistical Methods: Wiley, 1994. [26] IAEA, “Component reliability data for use in probabilistic safety assessment,”, Vienna, Technical Report, IAEA TECHDOC 478, 1988. [27] PLG Inc., “Seabrook station probabilistic safety study prepared for public service company of New Hampshire, a Yankee Atomic Electric Company,”, Technical Report PLG-0300, 1983. [28] J. Paulsen and R. Cooke, “Concepts for measuring maintenance performance and methods for analyzing competing failure modes,” in Proc. ESREL 1994; 9th Int’.l Conf. Reliability and Maintainability, 1994.
310
[29] J. D. Kalbfleisch and R. L. Prentice, Statistical Analysis of Failure Time Data: Wiley, 1980. [30] D. Kelly and S. Seth, “Data review methodology and implementation procedure for probabilistic safety assessments,” MITRE Corp., Mclean, VA, Technical Report, MTR-93W0000153, HSK-AN-2602, 1993. [31] J. F. C. Kingman, Poisson Processes: Oxford University Press, 1993. [32] A. Lannoy, Analyze Quantitative et Utilité du Retour d’Dxperiance Pour la Maintenance des Matriels et la Sécurité: Editions Eyrolles, 1996. [33] J. F. Lawless, Statistical Models and Methods for Lifetime Data: Wiley, 1982. [34] M. Crowder, “Identifiability crises in competing risks,” Int’l. Stat. Review, vol. 62, pp. 379–391, 1994. [35] W. Meyer and W. Hennings, “Prior distributions in two-stage Bayesian estimation of failure rates,” in Safety and Reliability, Schuller and Kafka, Eds: Balkema, 1999, pp. 893–899. [36] J. Paulsen, J. Dorrepaal, P. Hokstadt, and R. Cooke, “The design and use of reliability data base with analysis tool,” Risoe National Laboratory, Roskilde, Denmark, Technical Report Ris3-R-896(EN) NKS/RAK-1(96) R6, 1996. [37] A. V. Peterson, “Bounds for a joint distribution function with fixed subdistribution functions: Application to competing risks,” Proc. Nat’l. Academy Science, USA. [38] K. Porn, “On empirical Bayesian inference applied to Poisson probability models,” Ph.D. dissertation, no. 234, Linkoping Studies in Science and Technology, Linkoping, 1990. [39] “Engineering reliability: Procedure and data for estimating reliability and maintainability,” Martin, Denver, Technical Report M-M-P59-21, 1959. [40] ESReDA Working Group Report, “Handbook on quality of reliability data,” det Norske Veritas, Hovik, Norway, Technical report, 1999. [41] R. M. Cooke and T. Bedford, “Analysis of reliability data using subsurvival functions and censoring models,” Recent Advances in Life-Testing and Reliability. [42] T. Aven and U. Jensen, Stochastic Models in Reliability: Springer, 1999. [43] A. Tsiatis, “A nonidentifiability aspect of the problem of competing risks,” Proc. National Academy of Sciences.
IEEE TRANSACTIONS ON RELIABILITY, VOL. 51, NO. 3, SEPTEMBER 2002
[44] J. A. M. van der Weide and T. Bedford, “Competing risks and eternal life,” in Safety and Reliability (Proc. ESREL’1998), H. A. Sandtorv, S. Lydersen, and G. K. Hansen, Eds., 1998, vol. 2, pp. 1359–1364.
Roger Cooke (born 1946 in Ohio, USA) studied philosophy and mathematics at Yale University. After completing his Ph.D. at Yale, he moved to The Netherlands and worked as a jazz musician for 2 years. Eventually, he joined the faculty of the University of Amsterdam in logic and philosophy of science. With his move to Delft in 1987 his interests shifted to risk analysis. Since 1994 he holds the chair in Applications of Decision Theory in Delft. Prior to the recent book co-authored with Tim Bedford, he published Experts in Uncertainty (1991 Oxford University Press). He has applied structured expert judgment in much contract work, in particular in a joint U.S.–European uncertainty analysis of nuclear accident consequence models. Current research interests include uncertainty analysis, dependence in high dimensional distributions, probabilistic inversion methods, and general methodology in risk analysis. He is occupied with a new Master of Science program in Risk and Environmental Modeling at Delft.
Tim Bedford is Professor of Decision and Risk Analysis at the Department of Management Science, Strathclyde University. His research interests are focused on Technological risk modeling; Uncertainty modeling; decision support; and reliability data. He has worked for various organizations to develop risk and reliability methodology, including the European Space Agency, the Industry Management Committee of the Nuclear Industry in the UK, and the Health and Safety Executive. He is a member of the advisory board of the Norwegian Risk Project. Tim is also involved in professional societies—currently in the Safety and Reliability Society in the UK and previously in the Dutch Society for Risk and Reliability, of which he was the Chairman. He is the author of many papers on risk and reliability, and in particular was (with R. Cooke) co-author of the book Probabilistic Risk Analysis: Foundations and Methods, published by Cambridge University Press.