the system and a damage model, such as a fatigue prediction model. Information for ... Index TermsâElectronic components, fatigue, modeling, Monte. Carlo ...
38
IEEE TRANSACTIONS ON COMPONENTS, PACKAGING, AND MANUFACTURING TECHNOLOGY—PART A, VOL. 20, NO. 1, MARCH 1997
Designing and Building-In Reliability in Advanced Microelectronic Assemblies and Structures John W. Evans, Jillian Y. Evans, and Byung Kil Yu Abstract—New technologies in electronics require that product development embrace the paradigms of design for reliability and built-in reliability. These paradigms require effective measures to create robust designs and manufacturing processes. This objective must be achieved through modeling failure processes and taking proactive steps early in the development. Following an assessment of material properties, finite element models are built of key structures in the system. A statistical experimental design is then developed. This statistically designed “virtual experiment” will include the geometrical and materials’ variables comprising the system and a damage model, such as a fatigue prediction model. Information for process development or improvement is derived from the virtual experiment. The statistical model is then embedded in a Monte Carlo simulation to assess the impact of uncertainty and variability. This process of stochastic physics of failure is the subject of this paper. The process will be described and an application of this systems engineering based approach to micro-via interconnect reliability, in a complex multichip module (MCM), will be presented. Index Terms—Electronic components, fatigue, modeling, Monte Carlo, multichip module, reliability, simulation, via.
I. INTRODUCTION
P
RODUCT reliability has become one of the most important factors in achieving success in highly competitive market places. It is a key component to gaining a market advantage in industries such as consumer electronics, computers, automobiles, medical equipment, and photographic equipment [2]. This has lead to a focus on built-in reliability to insure the products entering the market are robust and meet consumer needs. However, to control cost and time-to-market, robustness in manufacturing must be achieved early in the development process. Problems must be solved upstream of full scale product manufacturing and deployment. Effective allocation of resources to product improvement requires a solid understanding of the relationship between sources of manufacturing variability and product reliability. Sources of variation which effect reliability include material properties, dimensional variations and defect content. The links between these factors and reliability is the key to achieving the goal of built-in reliability. This critical connection can be established through modeling the failure processes
Manuscript received June 1996; revised November 1996. This paper was presented in part at the 5th IEEE International Symposium on the Physical and Failure Analysis of Integrated Circuits, Singapore, November 28, 1995. J. W. Evans is with the Department of Systems Engineering, Institute for Advanced Engineering, Ajou University, Seoul, Korea. J. Y. Evans is with NASA Goddard Space Flight Center, Greenbelt, MD USA. B. K. Yu is with the Department of Systems Engineering, Ajou University, Seoul, Korea, and the Institute for Advanced Engineering, Manufacturing Technology Laboratory, Seoul, Korea. Publisher Item Identifier S 1070-9886(97)00255-2.
that a product will experience in use. The contribution of manufacturing variability to the failure process can then be evaluated. The primary sources that contribute the most to product unreliability become the focus of improvement. The use of modeling becomes an essential tool in producing the data necessary to make rapid upstream decisions effecting product improvement. These techniques include Monte Carlo simulation and statistical experimental designs coupled to failure mechanism models. II. PHYSICS
OF
FAILURE
Physics of failure is the process of focusing on root causes of failure during product design and development [4]. Individual failure mechanisms are modeled and their contribution to the unreliability of the product is assessed. The modeling process may employ tools such as finite element analysis to evaluate the stresses at various failure sites in a product. The results of the stress analysis are then used as an input to a damage model, such as a fatigue model. The life of the product can then be evaluated at different stress levels. The shortcoming of this process is that it is largely deterministic. The use of Monte Carlo simulation in the evaluation process can overcome this problem. Furthermore, sensitivity studies and statistical analysis will reveal which process variabilities are most important to improving product reliability. Then, the relative magnitude of different improvement strategies can be studied. This is important to priorities the application of resources to often costly process improvements. Clearly, this cannot be achieved through simple worst case analysis. Materials characterization is essential to achieving accurate models and is an important early step in the process. Following an assessment of material properties, models of the failure processes can be applied to key structures in the system, which may serve as failure sites. A statistical experimental design can then be developed around the materials and geometric factors that will contribute to variability in the performance of the key structure in its application environment. The experiment is conducted using the model. Hence, the term virtual experiment can be applied. The assembly of prototypes early in the development or past experiences with manufacturing can yield significant information about expected sources of variability from the manufacturing processes to provide the necessary information to develop distributions of manufacturing variabilities and initiate a virtual experiment. A statistically designed virtual experiment will include a damage model, such as a fatigue prediction model, to relate product stresses expected in the operating environment to product life. Information for process development or improve-
1070–9886/97$10.00 1997 IEEE
EVANS et al.: ADVANCED MICROELECTRONIC ASSEMBLIES AND STRUCTURES
39
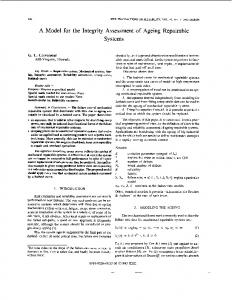
Fig. 1. Flow chart for the stochastic physics of failure process using finite element analysis as a basis for information.
ment is then derived from the virtual experiment. Statistically significant variables become the focus of further study and point the direction for improvements in the manufacturing process. A closed form statistical model is yielded by the “virtual experiment” and can be embedded in a Monte Carlo simulation to assess the impact of uncertainty and variability on unreliability. This process is shown in the flow chart in Fig. 1. As a result of this process, improvements can be evaluated and effective decisions about improving the product can be made. This process of stochastic physics of failure is the subject of this paper. The process will be described and an application of this systems engineering based approach to a microelectronic structure, will be presented. III. MODELING FAILURE MECHANISMS In some cases, a closed form failure mechanism model can be directly written in terms of geometric and materials variables. For example, Black’s equation for electromigration in semiconductor metallization systems can be written as a function of line geometry. While Black’s equation does not explicitly account for all sources of varaibility in electromigration lifetime, line width and line thickness effects can be evaluated. These parameters would be expected to vary as a result of the lithography and metallization processes. The impact of process variations can be related directly to the life of the device and the reliability impact of process
improvements, specifically related to line width and thickness, could be studied. The overall contribution of variability in the life of the device from all of the key variables can be explored using a Monte Carlo simulation. Hence, improvements or changes in the probability density function (pdf) can be estimated for the life of the product. This is discussed in further detail below. The example of Black’s Equation is simple and perhaps obvious. However, failure processes tend to be complex and may not have models which explicitly relate materials and geometry to the driving stresses. Mechanisms may be technology specific requiring model developments through appropriate test structures, statistically designed experiments and accelerated testing. In complex structures, where failure is driven by mechanical loading, finite element modeling may be necessary to determine the response of the structure to loading. Finite element analysis is an effective modeling tool to explore failure processes in complex structures. However, finite element analysis does not explicitly address uncertainty. In reliability assessment, its effectiveness can be significantly enhanced through applying factorial experiments to the model to explore ranges of geometric and materials variables [3], [8]. Finite element models can also be combined in a statistical experiment with a damage model. For example, the strain from a finite element analysis calculation is an input to a fatigue damage model. Thus, the material properties and geometric parameters can be varied in accordance with a statistical
40
IEEE TRANSACTIONS ON COMPONENTS, PACKAGING, AND MANUFACTURING TECHNOLOGY—PART A, VOL. 20, NO. 1, MARCH 1997
TABLE I LAYOUT FOR A TWO LEVEL FACTORIAL EXPERIMENT Run 1 2 3 4 5 6 7 8
Factor 1
+ + + + 0 0 0 0
Factor 2
+ + 0 0 + + 0 0
Factor 3
+ 0 + 0 + 0 + 0
experimental design and the finite element analysis and damage models executed accordingly. Thus, a link is established between geometric and materials variables to product life for complex failure mechanisms using this process. Since actual product is not tested, the process can be termed a “virtual test” or “virtual experiment” Many failure mechanisms can be modeled using the general linear model
Transformations of failure models for electrical and mechanical processes will often clearly show their linear nature, including fatigue models. For example, consider the Manson–Coffin fatigue model relating life or cycles to failure to plastic strain range
Taking the natural log of both sides of the equation clearly shows the model fits the following linear form:
Using regression analysis, a closed form linear statistical model can be developed, which relates geometry, materials and environmental parameters to product life from the virtual experiment, where a closed form model cannot be written directly. For example, the geometric parameters comprising a finite element model, which, of course, contribute to the strain or stress in the structure, can be directly related to the life of the structure. A statistical analysis identifies the most important parameters. The parameters of a model are estimated using a multivariable regression analysis employing the least squares method. The data from a virtual experiment may be modeled using the following least squares matrix:
Beta represents the vector containing the solution or regression model parameters, , represents the matrix containing the dependent variables, fixed by the experimental design and represents the vector containing the response, as calculated from the virtual experiment. The significance of any particular variable, relative to the overall variability in the experiment, can be assessed using a statistical significance test, such as an F-test or t-test. In the case of the fatigue analysis, which uses a finite element model as a bases of information about the loads, the geometric factors which are statistically significant become targets for studying the impact of process variations. In addition, the confidence limits of the various model parameters and of potential model predictions can be determined, yielding some information about variability. However, the pdf cannot be estimated. This requires a Monte Carlo simulation. V. EXPLORING VARIABILITY: THE MONTE CARLO METHOD
Electromigration, ionic contamination and diffusion driven mechanisms, time dependent dielectric breakdown, and corrosion will also exhibit linear forms. This often makes a two level factorial design adequate to explore factors relating materials and geometry to product life. However, it may be desirable to create designs allowing higher order models. The application of statistical designs is discussed below. IV. STATISTICAL EXPERIMENTAL DESIGN: VIRTUAL TESTING The two level factorial experiment may be used in modeling many failure processes. In this case, the number of runs in a virtual experiment using a factorial design can be calculated as follows:
where is the number of runs, 2 is the number of levels or order of regression and is the number of experimental parameters. A typical layout for a factorial experiment involving three variables is shown in Table I. In this case the design can explore the ranges of three variables, where plus represents the highest set value and minus represents the lowest set value. Layouts for various other designs can be found in [1] or [6].
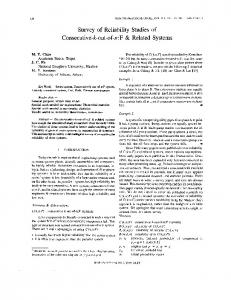
The variability of any parameter in a closed form deterministic failure mechanism model contributes to the overall variability in the life of a structure. Monte Carlo simulations can provide valuable information about the variability of life distributions due to the variability in the parameters that effect the life or failure mechanism model. The simulation process can be performed on a PC. The process utilizes the Law of Large Numbers to estimate the pdf, mean, and variance through numerous simulations of the deterministic failure model. Thus, the uncertainty in the model is determined through propagation of uncertainty in the parameters that comprise model. The logic of the simulation process is summarized in Fig. 2. The principle key to the process is the simple code necessary to randomly sample the input distributions. Algorithms for random number generators, their testing and limitations are discussed in [5]. Initially, the distribution of the parameters comprising a failure mechanism model or series of models are estimated. These distributions are subsequently sampled, using an appropriate random number generator. The values from the sampled distributions are then used to calculate the time to fail or the number of cycles to failure from the deterministic closed form model. The process is repeated for many calculations, keeping track of the results of each new sample calculation. The mean
EVANS et al.: ADVANCED MICROELECTRONIC ASSEMBLIES AND STRUCTURES
41
Fig. 2. Logic for a Monte Carlo simulation program.
time to failure and variance of the failure distribution can be estimated from the results of the simulation. In addition, the pdf can be determined. Hence, the reliability can be estimated and improvements in the process can be studied as to their yield in reliability improvement. The estimates for the distribution of the parameters that comprise the deterministic failure mechanism model can be determined from process information or measurements from prototypes. For example, considering a new metal deposition process, the variability in the line thickness can be directly measured from process prototypes. In this case, the appropriate normal distribution can be determined. An estimate of a process variable’s specific distribution can be performed using a simple triangular distribution. In this case, the mean, maximum and minimum values of the parameters are used to construct a triangular distribution. This simplifies the analysis process and often, the distribution of the input parameters may not be known. For example, given a parameter of interest, we can estimate values of along a triangular distribution given the following:
where is a uniformly generated random number on the interval of 0 to 1, such that
and
where
In this case, alpha is the minimum value of beta is the most likely value of and gamma is the maximum value of Once again, consider Black’s equation for electromigration, the maximum, minimum, and mean of the metal thickness and width could be used to construct simple triangular distributions of these parameters. This information could then be used to simulate the process variations arising from lithography, and their impact on the electromigration life time, through a Monte Carlo simulation. In the more complex case, a closed form model derived from a virtual experiment or test program can be embedded in a Monte Carlo simulation. It should be pointed out that the actual distributions of sources of design and manufacturing variabilities would be preferred to estimates using triangular distributions to improve the accuracy of reliability estimates. However, in the case where data are not available, triangular estimates can provide an initial estimate. Determining the relative impact of variabilities and relative improvements through sensitivity studies may be as important as absolute accuracy in making a decision about allocation of resources during development or product improvement studies. In this case, reasonable estimates of variation, to determine relative improvements and to effect sensitivity studies, are preferable to arbitrary guesses as to which sources of variability are most important. VI. CASE STUDY: THIN FILM
VIA
PROCESSING
The implementation of the concepts discussed in earlier sections are conveniently demonstrated through an exami-
42
IEEE TRANSACTIONS ON COMPONENTS, PACKAGING, AND MANUFACTURING TECHNOLOGY—PART A, VOL. 20, NO. 1, MARCH 1997
Fig. 3. Via structure used in the example simulation.
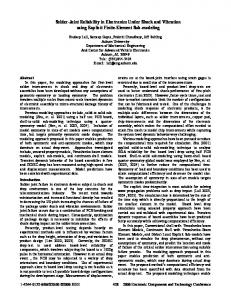
nation of vias in a thin film interconnect structure used in microelectronic circuits. A via is created by a combination of etching or laser drilling and electroplating. The reliability of this type of structure and related structures—plated through holes (PTH’s)—in printed wiring board assemblies, is highly important to electronic systems and devices. Fatigue, occurring as a result of thermo-mechanical loading, is a dominant failure mechanism and has been widely explored in the literature [8]. A. The Failure Mechanism Model The reliability of via structures in thin film polyimide has been investigated using finite element analysis [7], [9]. In these evaluations, finite element models of the General Electric-Texas Instruments’ high density interconnect (HDI) were developed. A detailed view of this structure is shown in Fig. 3. The process of fatigue in this structure is driven by thermo-mechanical loading. A significant difference in the out-of-plane coefficient of thermal expansion between the polyimide dielectric and the electroplated copper via structure induce the thermo-mechanical strains during ambient thermal cycling. The finite element analysis was used as an input to subsequent fatigue estimates. The fatigue model selected was a variation of the Manson–Coffin fatigue model developed by Engelmaier [3], [7]. The detailed measurements of the material properties were developed following the selection of the materials and development of the structure and processes. Defects were explicitly considered through analyzing stress concentration. The subsequent fatigue analysis revealed the limitations of the structure, as shown in Fig. 4. The fatigue model closely matched initial test data for early prototypes and test vehicle devices [9].
Fig. 4. Fatigue analysis of via structure shown in Fig. 3.
B. The Virtual Experiment These initial results reflected observations of irregularities in the via structure, which created significant stress concentration. In the region of nominal elastic stresses in the copper, the stress concentration factor ranged up to 3.5, based on observations of the via [7]. In addition, the potential ranges of other variables and their associated parameters, used in the modeling process are shown in Table II. These parameters reflect the primary sources of variability occurring in the processing of the via. Prototypes and preproduction statistical process control data provided the estimates of variability reflected in Table II. A statistical experimental design was built around this data. A full factorial design was used requiring 32 experimental runs as shown in Table III. This was followed by a virtual
EVANS et al.: ADVANCED MICROELECTRONIC ASSEMBLIES AND STRUCTURES
43
TABLE II RANGES OF MANUFACTURING VARIABLES FOR AN HDI VIA Factor Via Wall Thickness
tp )
Units Microns
Low Value 2
High Value 5
Microns
8
16
%
10
30
Degrees from vertical
0
45
1 3.5
3.5 Elastic 8.6 Plastic
(
AdhesiveThickness
tA )
(
Copper Ductility
D)
(
Wall Angle ( ) Strain Concentration Factor (Ke )
experiment based on the design. In this case, the temperature range was kept constant at 40 C and the range of the strain concentration over the plastic range was used, simulating use conditions. The results of the fatigue analysis, for each condition shown in the design, are also shown in Table III. An initial analysis of Table III, using an analysis of variance (ANOVA), indicated the dominance of the defect size, as reflected by stress concentration variations and plating thickness. Thus, via wall preparation and electroplating are the most critical processes to control, to achieve built in reliability. Clearly, achieving adequate plating thickness and uniformity is essential to the reliability of the structure. Whereas, variations in plating ductility, adhesive thickness and wall angle of the via are not as important at the operating range of 40 C. This work was extended to derive a closed form model using a regression analysis. As previously shown, fatigue is in general a power law relationship between strain and cycles to failure. A regression was performed using the natural log of each factor contributing to the strain, as shown in Tables II and III and the natural log of the cycles to failure was used as the dependent variable. The regression was performed using a step-wise procedure to obtain the model best fitting the data. Best fit was determined from the correlation coefficient and an examination of the residuals. The best fit model was compared to the model consisting of only the significant contributors to the via life-plating thickness and strain concentration or defect size. The best fit model was comprised of four of the factors. The model is shown below. The correlation coefficient was 97% for this model. The correlation coefficient of the model with the two most significant factors was 94%. In the models below, represents the cycles to failure, is the ductility of the copper, is the plating thickness, is the strain concentration factor (defect size) and psi is the via wall angle. Model 1:
Model 2:
C. Exploring Variability Both of the models shown above were embedded in a Monte Carlo simulation. Since the actual distributions of the parameters of interest were not known, simple triangular distributions were constructed using the data shown in Table
Fig. 5. Summary of triangular distributions used for the case study.
Fig. 6. Results of the Monte Carlo simulation showing the pdf of the log of the cycles to failure for the via structure at a temperature cycle range of 40 � C.
II above. These are summarized in Fig. 5. As previously discussed, distributions determined from measurements would be preferred to triangular estimates to improve model accuracy. The initial simulation on both models was intended to explore the sensitivity of the variability in the life, , to the variability of the parameters of interest listed in Table II. The results of the simulation are shown in Fig. 6, as curves A and B. There is very little difference in curves A and B confirming that the primary contribution to fatigue life variability is the result of plating thickness and defect size. The peak value, or cycles. The most likely life for the via structure is minimum life is approximately cycles. It is interesting to note the differences between this approach and the results in [7]. In applying finite element analysis from a deterministic view point, a “worst case life” at an environment of 40 C temperature range was cycles. Overall the range of life was significant. By inspection of the plot and to cycles data, the life could extend from (overall probability of 1.0). In fact, it is not unusual for fatigue data to extend over several decades, particularly at low stress levels. Clearly, the plot also shows the distribution is not lognormal, since it is not symmetrical. The assumption of lognormal is often made for fatigue data. However, the Weibull distribution perhaps has more physical significance, as it is an extreme
44
IEEE TRANSACTIONS ON COMPONENTS, PACKAGING, AND MANUFACTURING TECHNOLOGY—PART A, VOL. 20, NO. 1, MARCH 1997
TABLE III FULL FACTORIAL LAYOUT AND VIRTUAL EXPERIMENT RESULTS FOR THE PARAMETERS SHOWN IN TABLE II
value distribution which can describe situations were strength is limited by the largest flaw or “weakest link” present in the material. This is the case with fatigue. Hence, the data obtained from the simulation could be fit to the Weibull distribution, if desired. An additional simulation was performed on both models after changing the input distribution for the strain concentration factor. The new strain concentration factor distribution
reflects the effect of improving the process through reducing defect size and defect size variability. In this case, the most likely strain concentration factor was reduced to 2.0 and the maximum was reduced to 3.0. The impact to the via life is reflected by curve C for model 1. The data reflect a substantial increase in reliability that could be achieved by improving the processes of via preparation and electroplating. The most likely value increased by more than a factor of 10 to
EVANS et al.: ADVANCED MICROELECTRONIC ASSEMBLIES AND STRUCTURES
and the minimum value increased to cycles to failure. Clearly, focusing manufacturing improvements on reduction in defect size through enhancing plating uniformity and reducing via wall roughness would yield a significant payoff in increased product reliability. The accuracy of the simulation is inherently limited by knowledge of the input variable distributions. Measurements of variabilities from actual products, test vehicles and prototypes may be used in conjunction with plotting or regression analysis to determine the actual distribution and improve accuracy. Model accuracy in the tails of the distribution may be effected by using the triangular distribution estimates, depending upon the range selected and whether or not the simulation data are fit to a distribution. Clearly, the strength of the method is in relating the sources of variability to product reliability through the root cause of failure. This leads to clearly identifying where to focus corrective action and yields specific information concerning the impact of improvements by linking them to reliability. Development and implementation of this methodology will lead to greater understanding about root cause and improve the effectiveness of product improvement and development. VII. CONCLUSION Building-in reliability to achieve robust products requires an assessment of design and manufacturing variabilities and their relationship to reliability. The relationship between specific product characteristics influenced by the manufacturing processes and reliability can be achieved through understanding the failure mechanisms which are present in the product. In some cases, such as electromigration, an explicit model may exist. However, a relationship between product life and design or manufacturing variabilities may require development through the process of stochastic physics of failure using techniques such as virtual experiments and Monte Carlo simulation. Product improvements to achieve the goal of robustness can be made after clearly understanding the influence of the variability of product characteristics on reliability. ACKNOWLEDGMENT The authors wish to thank the members of the RELTECH team from the U.S. Naval Surface Weapons Center, the Army Research Laboratory, the Air Force Rome Laboratory, the CALCE EPRC at the University of Maryland, and the Advanced Research Projects Agency of the Department of Defense and the National Science Foundation. Special thanks goes to the General Electric Corporation for their involvement in demonstrating many of these concepts. REFERENCES [1] G. E. P. Box, W. G. Hunter, and J. S. Hunter, Statistics for Experimenters. New York: Wiley, 1978. [2] K. Clark and T. Fujimoto, Product Development Performance. Cambridge, MA: Harvard Business School Press, 1991. [3] J. Evans, J. Evans, A. Prabu, and A. Dasgupta, “Software environment for reliability assessment of advanced interconnect technologies,” in
45
[4] [5] [6] [7]
[8] [9]
Proc. ASME Int., Intersociety Electron. Packag. Conf., Lahaina, HI, 1995. J. Evans, P. Lall, and R. Bauernschub, “A framework for reliability modeling of electronics,” in Proc. Reliability and Maintainability Symp. (RAMS), Washington, DC, 1995. G. Hazelrigg, Systems Engineering: Information Based Design. Englewood Cliffs, NJ: Prentice-Hall, 1996. R. Myers, Response Surface Methodology. Blacksburg, VA: Virginia Polytechnic Institute and State University, 1976. A. Prabu, D. B. Barker, M. Pecht, J. Evans, W. Grieg, E. Bernard, and E. Smith, “A thermomechanical fatigue analysis of high density interconnect vias,” in Proc. ASME Int., Intersociety Electron. Packag. Conf., Lahaina, HI, 1995. M. Pecht, A. Dasgupta, J. Evans, and J. Evans, Quality Conformance and Qualification of Microelectronic Packages and Interconnects. New York: Wiley, 1994. RELTECH Interagency MCM Reliability Program Quarterly Report, NASA Headquarters, Washington, DC, Jan. 1994.
John W. Evans received the the B.S. degree in mechanical engineering from the University of Nebraska, Lincoln, the M.S. degree in chemical and materials engineering from the University of Iowa, Iowa City, and the Ph.D. degree in materials science and engineering from Johns Hopkins University, Baltimore, MD. He is a Visiting Professor at the Institute for Advanced Engineering, Department of Systems Engineering, Ajou University, Seoul, Korea, where he is engaged in teaching and research in product development and improvement. He is on sabbatical from NASA, Washington, D.C. At NASA, he is responsible for developing and managing national programs for NASA and ARPA in electronic systems, packaging and parts. He is the author or co-author of over 30 technical papers and articles, a book chapter on electronic materials and most recently a book on reliability in the development of advanced microelectronic devices. Dr. Evans is the recipient of several awards from NASA and a recipient of the IEEE Singapore Section IPFA Best Paper Award.
Jillian Y. Evans. received the B.S. degree in mechanical engineering from the University of Iowa, Iowa City, and the Master’s degree in mechanical engineering and the Ph.D. degree in reliability engineering from the University of Maryland, College Park. She is currently a Visiting Professor at Korea University, Seoul, Korea. She is also a Consultant in electronic system design, development, and reliability at the Daewoo Electronics Corporate Quality and Reliability Laboratories, Seoul, and is a Guest Lecturer on Reliability Engineering at the Ajou University Institute for Advanced Engineering, Seoul, Korea. She is presently on sabbatical from NASA Goddard Space Flight Center. At NASA, she is responsible for managing research in advanced electronics for the Electronic Packaging and Processes Branch. She is a co-founder of the NASA/ARPA interagency RELTECH program. She has written over 20 technical publications, a book chapter on electronic materials, and has recently co-edited a book on advanced electronic packaging reliability. Dr. Evans has received several awards from NASA, including a doctoral research fellowship, and is a co-recipient of the IEEE Singapore Section IPFA Best Paper Award. She is a past national officer of the Korean Scientists and Engineers Association.
Byung Kil Yu received the M.S. degree in metallurgical engineering from the Seoul National University, Seoul, Korea, the B.S. degree in metallurgical engineering from Yonsei University, Korea, and is now a Ph.D. candidate in Ajou University, Korea. He is a Researcher at the Institute for Advanced Engineering, Department of Manufacturing Technology Laboratory, Seoul, where he is responsible for developing the laser welding system, welding technologies, and quality control. He is the author and co-author of over 10 technical papers and articles relating to statistical quality control.