Abstract: Spatial Analysis and Decision Assistance (SADA) is a Windows
freeware program that ... Information Systems (GIS), sample design, statistics,.
SADA: A Freeware Decision Support Tool Integrating GIS, Sample design, Spatial Modeling, and Risk Assessment Robert N. Stewart (
[email protected]) and S. Tom Purucker (
[email protected]) The Institute for Environmental Modeling, University of Tennessee, USA
Abstract: Spatial Analysis and Decision Assistance (SADA) is a Windows freeware program that incorporates tools from environmental assessment into an effective problem-solving environment. SADA was developed by the Institute for Environmental Modeling at the University of Tennessee and includes integrated modules for GIS, visualization, geospatial analysis, statistical analysis, human health and ecological risk assessment, cost/benefit analysis, sampling design, and decision support. SADA began in the middle 1990s as a simple tool for integrating human health risk with spatial modeling tools. Since then, SADA has continued as an evolving freeware product targeted to individuals needing the integration or expansion of existing models into a spatial context. Because of the varied user base, SADA was engineered with an open and highly scaleable environment that in most cases allows additional functionality without an apparent increase in complexity. As a result, applications of SADA have extended into other disciplines that place strong emphasis on the spatial distribution of data. This paper provides an overview of the central functions of SADA and discusses how we addressed the problem of presenting complex and integrated models in a tractable manner. Information on SADA and a free download of the program can be found at http://www.tiem.utk.edu/~sada/. Keywords:
1.
software; decision; environmental; geostatistics; sample design
INTRODUCTION
The purpose of the Spatial Analysis and Decision Assistance (SADA) software is to provide a tool that makes a direct and practical connection between data analysis, modeling, and decision making within a spatial context. The target user is normally an environmental investigator interested in characterizing contamination and designing a remedial action for a particular site. Because SADA presents an open (but guided) modeling environment, its uses are wide ranging. SADA is multidisciplinary with tools found in Geographic Information Systems (GIS), sample design, statistics, data management, 2d and 3d visualization, spatial modeling, uncertainty analysis, human health and ecological risk assessment, remedial design, and cost/benefit analysis. These tools can be used independently or with an integrated approach. With the number of tools available, the user base has been wide ranging both in purpose and ability. To this end, it is important to engineer an assessment environment that is extensive, yet at the same time
suited to a specific user with a specific goal. An example goal might be to calculate how much soil must be removed to achieve a certain human health risk level. The interface was created with four broad criteria in mind: 1) The user should easily find where they can achieve a goal, 2) for this goal, the interface should organize itself to present only relevant tool sets and not clutter the environment, 3) the interface should provide open and flexible guidance through any interim steps that might be required to achieve the goal, and 4) the interface should appear consistent across all goals. To meet these criteria, a highly scaleable interface was created that encapsulated existing goals and permitted the addition of numerous goals without increasing the complexity of the software for all users. SADA was developed at the University of Tennessee’s Institute for Environmental Modeling with funding from the U.S. Nuclear Regulatory Commission, Environmental Protection Agency, and the Department of Energy. SADA is now in its tenth year of development with the most recent release (Version 4.1) in 2005. Between the last two releases
of SADA, there have been over 15,000 downloads with strong international interest, particularly from Europe. A free copy of the software can be downloaded from http://www.tiem.utk.edu/~sada/. The basic tool set of SADA will be presented here within the language of environmental characterization. Within this context, SADA provides tools for many major areas of assessment. Figure 1 shows a typical way in which these tools may be organized to facilitate decision support from the earliest phases of investigation. This type of design directs the sampling both initially and as information becomes available.
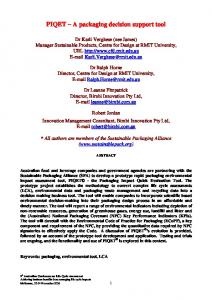
Figure 2. Incorporation of ArcGIS layers in site definition for both horizontal and vertical extent
3.
INITIAL SAMPLE DESIGN
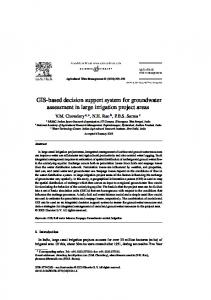
Initial sample designs are available that calculate both the number and location of new samples (USEPA, 2002 & Gilbert, 1987). Several of these designs are available in SADA and are divided into two major categories: random and gridded. Random designs essentially scatter sample locations randomly across the region of interest (Figure 3a). Gridded designs can provide uniform coverage across a site, each with a particular coverage goal in mind (Figure 3b). SADA also permits users to manually add new samples using the judgmental design (Figure 3c).
Figure 1. Example flow path through SADA We base the remaining sections of the paper on these major components.
2.
SITE SETUP
SADA provides a set of tools for setting up the site of interest. A site is defined by both horizontal and vertical boundaries. Users may also divide the subsurface into layers for visualization and modeling. SADA provides some GIS capabilities to help, such as drawing tools and methods for defining space in the vertical direction. Additionally, SADA can import GIS layers from external software packages such as ARCGIS and display them to provide additional context for the site (Figure 2). With the site set up, users can now import existing data or create an initial sample design.
In addition to these types of uninformed designs, a suite of targeted designs based on secondary sample design strategies (discussed later) is available. One such targeted sample design is to preferentially sample in an area where the risk of elevated values is high. These types of targeted sample designs require encoding of prior information about the site. Information can come from one or more sources but must be assimilated into a single knowledge map that characterizes the risk of contamination across the site. Figure 3d below shows a user-defined probability indicating the location where the greatest concern about contamination exists. Overlaid on this map is a high value design with the intent of preferentially locating samples in this area in the attempt to confirm the existence of elevated values.
contamination exist. These areas are sometimes referred to as “hot-spots”.
Figure 3. a) random design b) triangular aligned grid c) judgmental (user defined) d) targeted design (darker shades indicate greater risk of finding contamination). Recently, the Multi-Agency Radiological Survey and Site Investigation Manual (MARSSIM) sample designs for Class I, II, and III radiologically contaminated sites have been added to SADA. MARSSIM guidance is a highly prescriptive approach; details can be found in (USNRC, 2000). All sample designs can be exported to a simple external file format complete with coordinate locations. These can then be used to actually locate and recover the samples at the correct locations. Once the data has been collected, it can then be imported into SADA and assessed.
4.
Data Exploration and Visualization
After the samples have been collected and imported, users can visualize in 2d and 3d the results of the sampling effort. In figure 4, we see a typical twodimensional and three-dimensional visualization of the data. This affords the user a quick way to identify outliers or unexpected trends in the distribution of contamination. In addition to visualization, SADA provides a significant suite of summary statistics to help users quantify what is occurring on the site. Perhaps one of the simplest and most beneficial tools is the data screening option, which highlights those samples that are above a specified concentration level. This concentration level, often referred to as a data screening or decision threshold value, can come from the risk assessment models discussed later in the paper or they can be entered from an external source. Examples of external sources include guidance requirements or the outcome of other models. Screening data in a graphical manner such as this permits users to see where areas of elevated
Figure 4. a) 2d layer view, values that exceed 220pCi/g are highlighted with boxes b) 3d data view
5.
GEOSPATIAL ANALYSIS
After a careful investigation of the data values, it is often useful to predict the concentration values for unsampled locations. This is achieved through interpolation of the existing data points. SADA provides five interpolation routines: nearest neighbor, natural neighbor, inverse distance, ordinary kriging, and indicator kriging. In a broad sense, all interpolation methods assume that there is a spatial relationship among the data values. That is, the processes that created the contamination did not result in a purely random scattering of concentration values. Responsible interpolation of the data usually requires a full geospatial analysis, where spatial or temporal trends in the data are recognized and addressed prior to modeling. Deterministic methods, such as nearest neighbor, natural neighbor, and inverse distance, assume simple distance or relative positioning of nearby data to estimate the value of an unsampled location. This results in a single estimate for each location. Geostatistics is comprised of a large body of methods that make explicit use of the spatial variability or spatial correlation measured in the data set. A full explanation of geospatial modeling is beyond the scope of this paper. Readers should refer to Srivastava, 1989, and Goovaerts, 1997. For those familiar with geostatistical methods, however, it is important to note that SADA provides a full toolset for measuring and modeling spatial correlation, including semi-variogram plots, variogram maps, correlation models, and a model auto fit function for both ordinary and indicator correlation assessment. Rather than create a single estimate at any location, geostatistics creates a distribution of possible values,
permitting one to concentration as well.
model
uncertainty
about
With these distributions, one can calculate at each point the probability that the sample value, when measured, will exceed the screening value or decision criteria. This can be thought of as a continuous version of a discrete data screening map presented earlier. By plotting these probability values, one can then generate probability maps for any given decision criteria.
Figure 5. a) standard geospatial interpolation of concentration values b) probability map (probability of Uranium exceeding 220 pCi/G)
pathways due to behavioral patterns (land use scenarios) determines the extent of their risk. SADA’s risk models follow the EPA's Risk Assessment Guidance for Superfund (RAGS) and can be customized to fit site specific exposure conditions (USEPA, 1989). There are two outcomes to this modeling effort. The first is a screening value called the preliminary remediation goal or PRG. The PRG value is the calculated concentration limit for identifying potential contaminants of concern. Usually, a lengthy list of contaminants is reduced by a simple screening against this value. Those contaminants with sample values above this limit are considered contaminants of concern and are carried forward in the investigation. SADA can perform these PRG calculations, perform the data comparison, and identify contaminants of concern automatically and in a tabular format. For those contaminants of concern, SADA can also provide spatial data screens, where the decision threshold is the PRG, to visualize where the exceedances are found.
These maps form a framework for discussing uncertainty in the decision outcome and how that could impact remedial design, volume, and cost. The decision threshold value can come from external sources or from the internal risk assessment models. We now briefly discuss these models.
The second outcome is a full risk assessment for those contaminants of concern. In this scenario, the exposure concentration is calculated based on the statistical requirements of the data set, and the exposure and associated risk to an individual is produced. Total risk also may be calculated due to exposure to multiple contaminants at once.
6.
7.
HUMAN HEALTH RISK
A traditional risk assessment involves first characterizing the exposure for an individual to a contaminant of concern and then quantifying the behavior of the individual based on how the site might be used. Land use is divided into broad categories, such as a residential, industrial, agricultural, recreational, and excavation. For example, a residential use of the site would significantly increase the exposure to an individual over a recreational use (e.g. park). In addition, the effect of the contaminant on the individual depends on the chemical properties of the contaminant and how it enters the body. To this end, several exposure pathways are considered in combination with these land use scenarios. These include direct ingestion and inhalation of the contaminant or ingestion by food grown on site (e.g. vegetable garden). Dermal contact or external radiation is important as well. One can also assume multiple exposure pathways. The exposure that individuals receive through these
ECOLOGICAL RISK
Ecological risk assessment explicitly attempts to estimate the probability and magnitude of the effects for an ecological endpoint exposed to contamination. Ecological risk assessment is a multi-step process beginning with screening steps and culminating in characterization of the ecological risks from human activities. SADA supports many of the steps in a typical ecological risk assessment. The ecological risk module allows users to perform benchmark screenings and the ability to calculate forward dose to a number of terrestrial and aquatic receptors. An early step in ecological risk assessment is hazard identification. This process consists of comparing (or screening) environmental measurements to benchmarks. Benchmarks are environmental effects concentrations derived from toxicity testing. Contaminants at the site that exceed these benchmarks are kept for further examination. SADA contains one of the most complete, publicly available
list of benchmark sources and allows the user to screen data and areas of the site in a GIS view or in tabular form. Benchmarks are adjusted for sitespecific physical parameters as appropriate. Exposure assessment consists of determining which ecological receptors and pathways to model by taking into account bioavailability, behavior, growth, and spatial distribution. A conceptual site model is used at this point. Exposure can also be directly measured via measurements of body burdens or tissue residues. SADA provides terrestrial dose exposure models to assist in modeling dose body burdens at a contaminated site. Also provided are default exposure parameters for over 20 species commonly found in North America. Species can be parameterized for males, females, and juveniles. Risk characterization incorporates the outcomes of the previous activities to estimate the likelihood that significant effects are occurring or will occur and describe the nature, magnitude, and extent of effects on the designated assessment endpoints. Dose results also can be displayed spatially or in tables. SADA also allows the user to input toxicity reference values from the literature to determine if a contaminant is a problem at the site, and if so, what portions of the site are causing the problem.
8.
Figure 6. a) Block scale area of concern b) costs vs. decision goal
9.
SECONDARY SAMPLING
Whether another round of sampling is viable can depend on a number of issues. One example issue is the cost of remedial design. Based on the best available models, the cost may be reduced by taking a few strategically located samples. This is the goal of the boundary design seen in Figure 7. Another design simply confirms that high concentrations exist where the model is predicting they exist (high value). In the third part of Figure 7, the threshold radial design seeks to surround elevated sample locations with new samples to determine if the encounter is an isolated contamination event or part of a larger contaminated zone.
DECISION ANALYSIS
Modeling is often conducted to support a decision. This decision is typically where to concentrate remedial efforts and predict the expected payoff of remediation. The site area that is the focus of a remedial design is referred to as the area of concern. SADA provides two frameworks for determining the area of concern: block scale and site scale. In a block scale framework, any location that exceeds a given decision threshold is remediated. In site scale, the most contaminated areas are remediated until the site wide average falls below the decision criteria. In addition to the spatial outcomes, SADA can also estimate the remedial volume for a range of decision thresholds. If cost/unit volume is available, this becomes a cost/benefit analysis. One can then look for financial or risk reduction payoffs, perhaps associated with small modifications to an existing criteria. Of particular interest are areas where the cost curve exhibits a steep gradient. In these areas, small changes in the criteria result in large volume and cost values (Figure 6).
Figure 7. Three example secondary designs: Threshold radial, high value, and AOC Boundary Each of these secondary sampling designs can be used within an iterative or adaptive sampling plan. In an adaptive plan, new sample locations are identified and collected. This new information is then used to update the model or decision map, which in turn indicates the optimal location of another set of samples. From a practical standpoint, the decision to stop taking additional samples depends on the extent new information impacts the model or decision outcome. For example, if additional samples are creating significant changes in the area of concern, then the decision to terminate may be premature. The degree of “change” depends on the user’s interpretation. One example may be that the cost of simply proceeding with a conservative remedial
design is less than the time and effort spent on acutely refining the boundary on the area of concern. In SADA, users can log changes to their assessment and make a determination to stop sampling based on cost, risk, or any relevant factor.
10. SCALEABLE ISPR INTERFACE As the functionality of SADA grew from version 3 to version 4, so did the risk of the software becoming overly complicated and increasingly difficult to use. To address this problem, we derived a highly scaleable interface referred to as the Interview-StepsParameters-Result (ISPR) approach. The ISPR provides a list of “interviews” that cover virtually every major function of SADA and are presented in everyday language. For example, one interview might be “Develop an Area of Concern Map”. Another might be “Perform a Data Screen”. The majority of SADA’s interface space is then divided into three sections: steps, parameters, and results. Figure 8 shows the basic interface visual design.
by well-organized series of steps. This has proven particularly useful for novice users.
11. SUMMARY SADA is a practical modeling and decision analysis tool that integrates various models, such as human health, ecological risk, and remedial design, with a foundation of spatial analysis methods. The entire scope of SADA is extensive, and only a broad coverage of major functional areas is presented here. In order to support the user base, an extensive help file, user’s guide, on-line documentation, and user’s group have been created. In addition, conferences, workshops, and trainings are provided each year. Future directions of SADA include expansion of the ecological module, expansion of the geostatistical functions, methods for dealing with sparse data, incorporation of soft data into site assessment, and various improvements in subsurface characterization. For more information on the software and to download a free copy of the package, visit the SADA website at http://www.tiem.utk.edu/~sada/.
12. References Environmental Protection Agency (EPA). Guidance on Choosing a Sampling Design for Environmental Data Collection, Washington, D.C. EPA/240/R-02/005, 2002.
Figure 8. Schematic of the ISPR design. For each interview, there is a set of steps to accomplish the end goal. By clicking on each step, the parameter window changes to reveal the parameters associated with that step. When all the steps have been completed, the user is presented with the result in the graphics window. By organizing the interface in this manner, the number of interviews is unbounded (in a practical sense). Because the step and parameter windows re-organize themselves for each situation (Note sequence A and B in Figure 8), the interface “real-estate” is not further consumed by the addition of new interviews. With the ISPR interface, users from a particular discipline or with a particular task no longer need to search through unnecessary functions. Furthermore, the user is guided through complicated assessments
Environmental Protection Agency (EPA). Risk Assessment Guidance for Superfund: Volume I Human Health Evaluation Manual (Part A), Washington, D.C. EPA/540/1-89/002, 1989a Gilbert, Richard. Statistical Methods for Environmental Pollution Monitoring, John Wiley & Sons, New York, 1987. Goovaerts Pierre, Geostatistics for Natural Resources Evaluation, Oxford University Press, New York, 1997. Isaaks, E. and Srivastava, M., An Introduction To Applied Statistics, Oxford University Press, New York, 1989. Nuclear Regulatory Commission (NRC), MultiAgency. Radiological Survey and Site Investigation Manual, NUREG1575, Washington, D.C., 2000.