SCCF - System to Component Level Correlation Factor S. Thijs, M. Scholz1, D. Linten, A. Griffoni2, C. Russ3, W. Stadler3, D. Lafonteese4, V. Vashchenko4, M. Sawada5, A. Concannon4, P. Hopper4, P. Jansen and G Groeseneken2 imec, Leuven, Belgium 1
2
also at: Faculty of Engineering, Dept. Elec, Vrije Universiteit Brussels, Belgium also at: Department of Electrical Engineering, Katholieke Universiteit Leuven, Belgium 3 Infineon Technologies AG, D–81726 Munich, Germany 4 National Semiconductor Corporation, Santa Clara, CA 95052, USA 5 HANWA Electronics Ind. Co. Ltd., Wakayama, Japan Email:
[email protected]
Abstract – As a first step towards correlation of system level ESD robustness based on component level ESD results, on-wafer Human Metal Model (HMM) measurements are compared with on-wafer HBM for a wide range of devices in various process technologies. A device level System to Component level Correlation Factor (SCCF) is defined and can range from 10 to 150 % based upon physical failure mechanisms. Five main categories are defined independent of process technology.
I. Introduction Manufacturers of Integrated Circuits (ICs) face the difficulty of providing ESD robust products to system vendors without knowing the final application and the worst-case system level ESD stress for this application. This can lead to ICs which satisfy the component-level ESD robustness requirements, but fail the ESD system level tests carried out by the system vendor on the system. To enable the IC manufacturer to predict the ESD performance of their products under system-level stress conditions, the ESD Association (ESDA) proposes a standard practice method: Human Metal Model (HMM) [1]. In this paper, a first step towards correlation of system level ESD robustness based on qualification component level ESD results is made by comparing device level failures from an HMM stress to device level failures from an HBM [2] stress on a wide set of examples. This provides fundamental understanding of how a device responds when it fully undergoes the system level stress. This scenario might be worst-case as part of the system level stress might be dissipated elsewhere in the system [3], however such alternative current paths are rarely known upfront and often dangerous to rely on. Moreover, there is a trend in industry to get rid of off-chip system level ESD protection due to cost, overall form factor, integration and performance reasons [4]. For some high-speed and high-frequency circuits, no off-chip ESD protection elements can be tolerated and the full system level ESD stress needs to be dissipated by the
on-chip ESD protection as demonstrated for the 60 GHz Low Noise Amplifier (LNA) in [5]. Often, HMM tests are performed in powered-up condition which could lead to more vulnerable circuits. Since in this paper, mainly stand-alone protection devices are investigated regarding their system level ESD response, they can be evaluated in powered-off condition. Devices or circuits submitted to system level stress are known to have either soft or hard failure modes making correlation difficult. Therefore, in each of the examples discussed in this paper, a detailed electrical analysis of the pre- and post-stress DC leakage measurements is performed in conjunction with both HBM and HMM stress tests with voltage and current waveform analysis to verify the device operation and failure mode during both component and system level ESD stress. Of course, functional fails of the system cannot be observed as HMM provides a system level waveform only on device level, but not on the full system. Only HMM is considered as system level stress in this work, although there are many more system level stresses such as cable discharge which can be more severe [6]. In this paper, first the System to Component level Correlation Factor (SCCF) is defined in Section II. Section III elaborates extensively on the obtained experimental results from several technologies (CMOS, SOI, FinFET, Bipolar CMOS DMOS (BCD)). Five SCCF groups are distinguished and are discussed in separate subsections. Finally, the paper is concluded in Section IV.
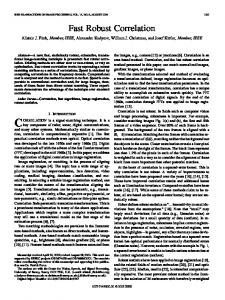
II. System to Component Level Correlation Factor The measured 3 kV HBM and 1 kV HMM discharge current waveforms are shown in Figure 1 from our Hanwa HBM and HMM HED-W5000 on-wafer testers. The HMM current features two peaks: first, a fast initial CDM-like peak and secondly a slower HBM-like pulse. The first peak may create CDM-like damage of dielectric and junction, while the second could be responsible for adiabatic overheating and local melting of the device. The HBM tester meets the joint ESDA-JEDEC HBM standard [2] while HMM testing was performed according to [1].
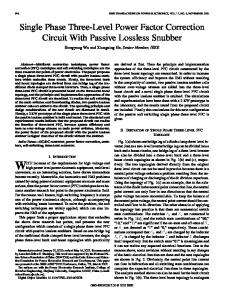
more accurate integration of the on-chip ESD protection device in the system level ESD protection architecture, if required in combination with off-chip protection elements. Table 1: Overview of System to Component level Correlation Factor (SCCF) for different DUT in various technologies. Category
Device
Technology
1
DIODE
45 nm CMOS
3.35
1.3
39%
DIODE
65 nm CMOS
6.2
2.2
35%
DIODE
90 nm CMOS
7.4
2.3
31%
SCR
65 nm CMOS
5.6
1.65
29%
DTSCR 180 nm CMOS w/o GM poly 180 nm CMOS DTSCR with GM ggNMOS SOI FinFET
4.6
1.5
33%
4.6
1.3
28%
2.6
0.9
35%
60 GHz PA 45 nm CMOS
5.3
1.75
33%
2.9
1.8
62% 43%
4 3.75 A/kV
3 kV HBM measurement 1 kV HMM measurement
2
Current [A]
3 2 A/kV 2
3
1
1 A/kV
50
100 Time [ns]
150
200
Figure 1: Measured 1 kV HMM and 3 kV HBM discharge current waveforms with HMM current waveform parameters.
By using an on-wafer HMM testing system, initial results showed that devices and circuits have different failure levels if stressed with HBM testing in comparison to HMM testing [5]. A System to Component level Correlation Factor (SCCF) can be defined as the ratio of the failure precharge level for HMM and HBM (VHMM and VHBM, respectively):
SCCF =
VHMM VHBM
(1)
The SCCF indicates how robust the ESD protection device is against system level stress in comparison to its component level ESD robustness.
III. Experimental Results In Table 1, HBM and HMM results of different types of Devices Under Test (DUT) for various technologies are shown with their corresponding SCCF. Based on these results, five different types of SCCF can be distinguished. Even more categories might appear when other technologies/devices are considered. It is very important to be able to categorize each ESD protection device into one of the proposed categories, as correlation results can vary from 10 to 150 % SCCF. This knowledge will enable
SCCF
HV PNP
50 V BCD
HV PNP
25 V BCD
7
3
HV PNP
12 V BCD
5.6
2.8
50%
HV NPN
100 V BCD
5.5
1.5
27%
ggNMOS
SOI FinFET
1.8
0.5
28%
4
DTSCR with GM
180 nm CMOS
2.6
0.3
11%
LVTSCR
90 nm CMOS
4.5
0.65
14 %
5
NLDMOS
100 V BCD
0.2/7.4
0.3/1.7
150/23%
0 0
HBM [kV] HMM [kV]
The five distinct categories based on Table 1 are as follows: 1. SCCF ranging from 30-40 %, which can be attributed to uniform thermal failure during both HBM and HMM stress as indicated in Section III.1. 2. High SCCF from 40-60 %, where thermal failure occurs during both HBM and HMM stress. The high SCCF value is attributed to the high holding voltage (VH) of the DUT as explained in Section III.2. 3. SCCF around 27 % for devices prone to isothermal current instability [7], as discussed in Section III.3. 4. Low SCCF < 20 % for protection devices where the fast peak of the HMM current causes gate oxide failure either in the protection device itself or in the protected device, as discussed in Section III.4. 5. SCCF ranging from 23-150 % as function of gate bias for a NLDMOS power array, where different device physics can be induced due to the nature of the HMM current pulse, as discussed in Section III.5. First, a general theoretical approach is used in Section III.0 to derive a mathematical expression for the SCCF in case of thermal failure. This expression can be simplified to yield two boundary cases, namely for
The thermal energy dissipated in the DUT during ESD stress is calculated as in [8] using:
Wel = ∫
tend
0
VDUT (t ) I DUT (t )dt ,
(3)
with VDUT(t) and IDUT(t) the voltage and current waveforms of the DUT under the ESD stress. Since the majority of the energy of both the HBM and HMM pulse is located in the decaying part of the discharge pulse, the rising part can be neglected. IDUT(t) is then modeled as a simple RC discharge current for both HBM and HMM in formulas (4)-(5), with the RC values depending on the equivalent HBM and HMM discharge circuits.
5
[Ohm]
In case of thermal failure during both HBM and HMM stress, the thermal energy Wel dissipated will be equal. Wel ,HBM = Wel ,HMM (2)
DUT
0. Thermal SCCF
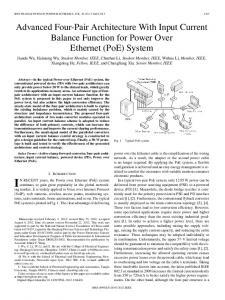
2 shows SCCF contour lines by solving (7) using (1) for 1 kV HBM (solid line) and 2 kV HBM (dotted line). The corresponding HMM value then can easily be obtained from (1). When increasing the HBM level from 1 kV to 2 kV, a given combination of RDUT and VH will result in a lower SCCF value. The change of RDUT and VH with HBM precharge level for 60 % SCCF is indicated by the arrow in Figure 2. Figure 3 shows the SCCF solution of (7) for 4 kV (solid line) and 8 kV (dotted line) HBM with a similar arrow.
On-resistance R
devices with low and high holding voltage VH in Section III.1 and III.2 respectively. Section III.3-III.5 discuss the last three categories according to Table 1.
4
1 kV HBM 2 kV HBM
3 2 1 0
0
10
−t
(4)
−t
(5)
(6)
with VH the holding voltage of the DUT and RDUT its high-current on-resistance. When solving (2) using (3)-(6), a quadratic equation is obtained which allows prediction of VHMM based upon VHBM to yield similar thermal energy dissipation during both HBM and HMM.
RDUT
2 VHBM C HBM + VH VHBM C HBM = RHBM
RDUT
2 VHMM C HMM + VH VHMM C HMM RHMM
50
60
(7) As can be seen from (7), SCCF as defined in (1) will generally depend on the device parameters RDUT and VH, and will vary as a function of precharge voltage. The solution of this quadratic equation can be graphically represented for given HBM values. Figure
5
[Ohm]
Their peak amplitude is defined by the ratio of the precharge voltage and the discharge resistor. The impedance of the DUT can be neglected with respect to RHBM and RHMM for typical ESD protection devices. VDUT(t) is calculated based on IDUT(t) according to
VDUT (t ) = VH + RDUT I DUT (t ) ,
40
Figure 2: Contour plot of the SCCF [%] solution of the quadratic equation in (7) for 1 kV (solid line) and 2 kV (dotted line) HBM precharge levels.
DUT
V I HMM (t ) = HMM e RHMM C HMM RHMM
30 H
On-resistance R
V I HBM (t ) = HBM e RHBM C HBM RHBM
20
Holding voltage V [V]
4 kV HBM 8 kV HBM
4 3 2 1 0
0
10
20
30
40
50
60
Holding voltage V [V] H
Figure 3: Contour plot of the SCCF [%] solution of the quadratic equation in (7) for 4 kV (solid line) and 8 kV (dotted line) HBM precharge levels.
However, two boundary cases exist that lead to an analytical solution for SCCF, independent of device parameters or precharge voltages, corresponding to the first two categories of Table 1. Therefore, Section III.1 discusses devices with low VH, where the linear term in (7) is neglected with respect to the quadratic term. Then, in Section III.2, the quadratic term in (7) can be neglected with respect to the linear term when VH is large enough.
C HBM RHMM = 38% RHBM C HMM
(8)
with RHBM=1.5 kΩ, CHBM=100 pF, RHMM=330 Ω and CHMM=150 pF. In this case, SCCF becomes independent of device parameters and precharge voltages. This analytic approximation of SCCF can be numerically verified by taking the full current waveform IDUT(t) into account instead of the RCdecay alone (4)-(5). This approach was preferred instead of using a constant peak current with an effective pulse width as proposed in [8]. An analytical expression for the HBM current was used, where the current waveform is described as a product of an exponential with a hyperbolic sine [9]. For the HMM current, an equation consisting of a sum of two exponentials was used [1]. All parameters of these equations were extracted from the used measurement system responses. A comparison between these analytical expressions and the measured waveforms for a precharge voltage of 3 kV HBM and 1 kV HMM is shown in [10]. A good agreement was observed. When numerically evaluating the failure energy (3) using these analytical expressions for HBM and HMM, equal failure energies for both HBM and HMM were obtained for a SCCF of 38 % matching the analytical prediction (8). Instead of using analytical equations, measured voltage and current waveforms could be used as well provided calibrated voltage waveforms are available. Example 1 The 100 µm wide p-well diode from Table 1, processed in 45 nm CMOS technology is evaluated. The 1 V turn-on voltage of the diode is neglected in first order, such that the diode can be considered as a pure resistive element. The evaluation of the other diodes and SCR devices from category 1 in Table 1 is similar. Table 2 shows an overview of the statistical measured HBM and HMM failure levels, each averaged over 7 samples. A small precharge step size of only 50 V in both HBM and HMM was used. Very reasonable deviations in failure levels of 200 V and 50 V were observed for the HBM and HMM results respectively. The failure energy was calculated using (3), taking into account the 0.8 Ω diode series resistance. The difference in failure energy is less than 5 %, proving that the diode fails thermally under both HBM and
Table 2: Comparison of HBM and HMM failure level and corresponding failure energy for a 100 µm p-well gated diode in 45 nm CMOS.
Test
Failure level
Failure energy
HBM
3.35 kV±200 V
(295±50) nWs
HMM
1.3 kV±50 V
(310±25) nWs
For devices with low holding voltage, the failure energy is proportional to the integral of IDUT2(t). Graphically, it can be seen in Figure 4 that the extra energy due to the higher HMM current peak at 30 ns is compensated by the energy content of the longer tail of the HBM current pulse. 30 350
25
Failure Energy [nWs]
SCCF =
2
Theoretical approach By setting VH to zero in (7), an analytical solution can be found for SCCF:
HMM stress conditions, as expected. An average SCCF of 39 % was obtained for this set of measurements, matching the predicted 38 % since the analytical tester models were calibrated to our inhouse measurement equipment.
Squared Current [A ]
1. Thermal SCCF - Low VH
20 15
300 250
HBM
200
HMM
150 100
t
2 W el ( t) = ∫ R DUT I DUT (τ ) d τ
50
0
0
10
0
50
100 150 200 Time [ns]
250
300
HBM 3.35 kV
5
HMM 1.3 kV 0
0
50
100
150
200
250
300
Time [ns]
Figure 4: Squared HBM and HMM current waveforms just before failure for the 100 µm p-well diode in 45 nm CMOS technology. The failure energy using 0.8 Ω RDUT is shown in the inset.
However, SCCF can be impacted by several sources of variation. In this work, device variation was removed by performing statistical measurements. Further, small step sizes for both HBM and HMM precharge voltages were used for accurate determination of SCCF. Finally, SCCF should be verified for each set of component and system level ESD test equipment to eliminate tester variation. Example 2 35 % SCCF was obtained for grounded-gate NMOS devices implemented in SOI FinFET technology. The measured devices have 45 nm gate length, 30 nm fin width, and 65 nm fin height. They consist of 400 fins in a single block, and have 16 blocks in parallel. The total amount of silicon width is 192 µm. A silicide block region of 400 nm is used on both drain and source side ensuring uniform failure. Technological
3
HMM 900 V 2
When taking into account the holding voltage of a protection device using (6), SCCF becomes a function of VH and RDUT, and changes with each precharge level. When VH is sufficiently high, the quadratic term in (7) can be neglected leading to an analytical solution for SCCF:
C HBM = 67% C HMM
1
0
2. Thermal SCCF - High VH
SCCF =
1.5
0.5
Example 3
(9)
This is only valid on the condition that the physical device operation is the same during both HBM and HMM stress. Therefore, voltage waveforms during both stress types need to be analyzed and have to show similar device behavior. Figure 6 shows the voltage waveforms for the lateral PNP (50 V BCD technology) from Table 1. The PNP has a measured VH of 60 V, both during HBM and HMM stress.
0
50
100
150
200
250
300
Time [ns]
Figure 5: 2.6 kV HBM and 900 V HMM current waveform for a grounded gate NMOS device processed in SOI FinFET technology. Silicide blocking was used to ensure uniform failure. 200 HBM 150 Voltage [V]
As a final example of thermal SCCF with low VH, HBM and HMM measurements have been performed on the input of a 60 GHz Power Amplifier (PA), implemented in 45 nm digital CMOS technology and protected by an ESD inductor. When stressing the RF input positively to ground, the ESD current is shunted by the ESD inductor placed between these two pins. Due to its low inductance, and due to additional voltage clamping at the gate of the RF transistor, no voltage overshoots are occurring which could lower the overall ESD robustness. Details regarding this protected RF design including ESD results can be found in [12]. The RF circuit was failing at 5.3 kV HBM due to metal line failure of the ESD inductor. VFTLP results showed no failure up to the measurement limit of 8.5 A. Since all voltage overshoots are clamped to safe values in this design, the inductor can be considered as a pure resistive protection element with 0 V holding voltage. As such, it falls under category 1 in Table 1, and the measured HMM failure level of 1.75 kV results in 33 % SCCF, which is according to the expected result for devices in this category.
HBM 2.6 kV
2.5
Current [A]
details and interpretation of the dependence of the ESD performance on the layout and process parameters can be found in [11]. HBM and HMM measurement results show failure at 2.6 kV and 0.9 kV respectively, with 2.6 V VH and 1.3 Ω RDUT in both cases. A comparison of the HBM and HMM current waveforms at these respective precharge levels is shown in Figure 5. Again, the HMM current peak is larger than for HBM. These results are in line with the predicted result from (8).
HMM
100
50
0
0
100
200
300
400
Time [ns]
Figure 6: Measured voltage during HBM and HMM stress for a lateral PNP in a 50 V BCD technology.
The measured 62 % SCCF matches well will the predicted SCCF value of (9). This high holding voltage leads to high dissipated power in the on-state condition. For these devices, the major part of the thermal dissipation is defined by a linear dependence on the dissipated current instead of a quadratic dependence (VH‧IDUT instead of RDUT‧IDUT2). As a consequence, devices with high holding voltage are relatively more robust to system level stress than devices with lower holding voltage. It is very important to note that specific devices can suffer from isothermal current instability, meaning that they fail at constant current levels. Some devices with high holding voltage can fall under this category such that instead of the expected SCCF around 67 %, only 27 % SCCF is obtained. Such failure mechanism is discussed in the next section.
3. SCCF - Isothermal Current Instability Isothermal current instability can be initiated by impact ionization under high field conditions [7].
12
Current [A]
1.2 1 0.8 0.6 0.4
0 -10
8
HBM 1.8 kV HMM 500 V -5
0
5
10
15
20
Voltage [V]
Figure 8: HBM-IV and HMM-IV for the wide fin ggNMOS SOI FinFET devices right before failure. The same quasi-static behavior is observed.
6 4 HBM max current HBM standard 0.67 A / kV
2 0
1.4
0.2
HMM current @ 30 ns HMM standard 2 A / kV @ 30 ns
10
The resulting HBM-IV and HMM-IV right before failure are shown in Figure 8 to verify that the same conduction mechanisms are activated in the device during both types of stress. The concept of HMM-IV is shown here for the first time; however it is identical to HBM-IV [13]. For HMM-IV, the transient IV curves can be obtained from single shot HMM measurements by plotting instantaneous current versus instantaneous voltage. Care has to be taken as the fast initial HMM current peak will induce large voltage overshoots and consequent voltage ringing in the measurements as can be seen in Figure 8. However, the voltage waveforms are accurate enough to verify that both devices respond in the same way during HBM and HMM for the quasi-static part of the IV (i.e. after the initial voltage overshoot). The failure levels of 1.8 kV HBM and 500 V HMM result in a SCCF of 28 %.
Current [A]
Devices affected by isothermal current instability will fail under constant current conditions rather than constant power and fall under category 3 in Table 1. Since these devices fail at constant current conditions, the SCCF can be predicted based on the HBM and HMM current specifications as function of precharge voltage. For HBM, 0.67 A/kV peak current is expected according to (2), while HMM has a 30 ns current value of 2 A/kV as seen in Figure 1 and according to (1). Even though the initial HMM peak current of 3.75 A/kV is larger, the peak duration is probably too short to cause isothermal current instability as demonstrated by the two examples further in this section. Based on the above considerations, a predicted SCCF of 33.5 % is expected where HBM and HMM reach the same current levels. However, as noted already in Section III.1, SCCF is heavily depending on the used testers and should be verified for each set of testers used. In our case, analyzing the used HBM tester shows a HBM peak current of 0.6 A/kV and on the other hand, the HMM tester produces a 30 ns HMM current level of 2.2 A/kV, both shown in Figure 7. This small deviation with respect to the HBM and HMM standard, although still within standard specifications, changes the predicted SCCF to 27 %, which agrees with the obtained results of category 3 in Table 1.
0
1
2
3
4
5
6
7
8
Precharge Voltage [kV]
Figure 7: HBM tester characterization shows a peak current level of 0.6 A/kV. HMM tester characterization shows a 30 ns current level of 2.2 A/kV.
Example 1 Isothermal current instability was shown in [15] to occur for ggNMOS devices in SOI FinFET technology with 40 µm wide ‘fins’, irrespective of their gate length. The measured devices in this example have 205 nm gate length, 65 nm fin height, are fully silicided, have a tensile strain layer of 0.8 GPa deposited and consist of 16 parallel blocks of 40 µm wide ‘fins’.
In Figure 9 and Figure 10, the analysis is performed on the failing HBM and HMM voltage waveforms respectively, where the moment of failure can be very clearly seen by the voltage drop compared to the previous non-failing stress levels. Note that in this paper up to now, voltage and current waveforms have always been shown for the precharge levels prior to failure. Failure occurs, both for HBM and HMM, at the moment of maximum current (excluding the initial peak current of the HMM pulse) as seen by comparing the voltage waveforms in Figure 9 and Figure 10 with the corresponding current waveforms in Figure 11. Further, Figure 11 shows failure at constant current levels for both HBM and HMM. Remember that in case of thermal failure, the 30 ns HMM current value is clearly higher than the HBM peak current, as was seen in Figure 5 for narrow-fin FinFET devices.
The HBM- and HMM-IV curves just before failure are shown in Figure 12, indicating similar quasi-static device operation during both component- and system level ESD stress. The HMM initial current peak and resulting voltage overshoot due to system parasitics are clearly visible as well. A holding voltage of 11 V is measured with 1.5 Ω series resistance after calibration.
20 HBM 1.8 kV
Voltage [V]
15
HBM 1.9 kV HBM failure
10
6
5
5 0
50
100
150
200
250
300
Time [ns]
Figure 9: HBM voltage waveforms right before (1.8 kV) and during (1.9 kV) failure. 60
4 Current [A]
0
3 2
Voltage [V]
50 40
HMM 500 V
30
HMM 550 V
20
HMM 1.5 kV
1 0
0
10
20
30
40
50
60
Voltage [V]
HMM failure
10
Figure 12: HBM-IV and HMM-IV for the stacked ggNMOS right before failure. The same quasi-static behavior is observed.
0
A similar thermal SCCF contour plot as in Figure 2 and Figure 3 for can be drawn for the measured HBM failure level of 5.5 kV, as function of RDUT and VH, see Figure 13. Using 1.5 Ω RDUT and 11 V VH, SCCF is estimated to be 53 % as indicated by the cross in Figure 13. Using this SCCF, for 5.5 kV HBM, in case of thermal failure, 2.9 kV HMM is expected.
-10 -20
0
50
100
150
200
250
300
Time [ns]
Figure 10: HMM voltage waveforms right before (500 V) and during (550 V) failure. 1.4
5
1.2
[Ohm]
isothermal current instability
1 0.8
DUT
HBM 1.8 kV
On-resistance R
Current [A]
HBM 5.5 kV
HMM 500 V
0.6 0.4
5.5 kV HBM
4 3 2 1
0.2 0
0
0
50
100
150
200
250
300
Time [ns]
0
10
20
30
40
50
60
Holding voltage V [V] H
Figure 11: 1.8 kV HBM and 500 V HMM current waveform for a ggNMOS device processed in SOI FinFET technology. Isothermal current instability is observed.
Figure 13: Contour plot of the SCCF [%] solution of the quadratic equation in (7) for 5.5 kV HBM precharge level. The cross indicates the resulting 53 % SCCF for 1.5 Ω RDUT and 11 V VH.
Example 2
However, according to Table 1, only 1.5 kV HMM is measured which is roughly half of the expected 2.9 kV HMM based on the thermal SCCF. This discrepancy can be explained by analyzing the current waveforms just before failure in Figure 14. Similar as for the FinFET in example 1 in this section, again
A second example exhibiting isothermal current instability is demonstrated using a stacked grounded gate NMOS clamp, processed in a 100 V BCD technology.
isothermal current instability is observed, causing device failure at 3.4 A. The measured SCCF is 27 %, matching the prediction based on our tester evaluation in Figure 7. 7 HBM 5.5 kV
6
Current [A]
5. SCCF - NLDMOS Power Array
HMM 1.5 kV
5 4
isothermal current instability
3 2 1 0
In case of the LVTSCR, gate-oxide failure occurs in the SCR itself during HMM, while the HBM failure is thermal. To avoid overestimation of the HMM level based on HBM, additional VFTLP measurement data could be taken into account to predict voltage overshoots.
0
50
100
150
200
250
300
Time [ns]
Figure 14: 5.5 kV HBM and 1.5 kV HMM current waveform for a stacked ggNMOS device processed in 100 V BCD technology. Isothermal current instability is observed.
In this section, the self-protection HBM and HMM capability is studied of a 30 mm wide NLDMOS power array output driver processed in a 100 V BCD process. Since HMM measurements are often performed in powered-up conditions, the respective HBM and HMM failure levels as function of gate bias of the NLDMOS are shown in Figure 15. For low gate bias, almost no MOS current conduction occurs and the device fails at snapback at very low precharge levels. With increasing gate bias, the self protection capability of the power array increases as the ESD current is shunted by the 30 mm wide MOS channel [16]. 8
When placing a Gate Monitor (GM) in parallel to the Diode Triggered SCR (DTSCR) [14], gate oxide failure can occur in the GM due to voltage overshoots during both HBM and HMM as seen in category 4 in Table 1. These voltage overshoots will decrease SCCF below 20 %. Explaining this observed SCCF level due to voltage overshoots requires detailed knowledge about the ESD testers, the turn-on speed of the protection device and the breakdown properties of the gate oxide. Regarding the ESD testers, HMM delivers a 5.6x higher peak current than HBM. Further, the rise time of our HMM current pulse is about 5x faster than our HBM. However, the overshoot duration during HMM is limited to 2-3 ns due to the fast decrease of the initial current peak. For HBM, due to the relatively slow current decay, the voltage overshoot will depend fully on the device turn-on speed, which can easily extend beyond 10 ns for slow protection devices. In general, to avoid premature failure due to voltage overshoots during HMM, care has to be taken regarding the turn-on speed of the protection element. For example, by changing the STI-defined diodes in both the SCR and the trigger diodes to poly-defined as in [15], the speed improvement results in a boost in SCCF up to 28 %, even with GM. Thermal failure of the SCR was observed instead of gate-oxide breakdown and the poly DTSCR with GM falls back in category 1 as shown in Table 1.
Failure voltage [kV]
4. SCCF - Voltage Overshoots
7
HBM
6
HMM
5 4 3 2 1 0
0
1
2
3
4
Gate bias [V]
Figure 15: HBM and HMM failure levels for a NLDMOS power array as function of gate bias.
For low gate bias, even higher HMM protection levels are measured than HBM resulting in SCCF > 100 %. With increasing gate bias, both HBM and HMM failure levels increase but HBM increase more rapidly, resulting in a SCCF of 23 % at 4 V gate bias. SCCF as function of gate bias is shown in Figure 16. For the first time, HMM levels higher than HBM are reported. Waveform analysis is performed in order to understand the physical origin of this unexpected behavior. In Figure 17 and Figure 18, voltage and current waveforms for the failing HBM and HMM precharge levels are shown respectively for 0 V gate bias.
200
SCCF [%]
150
100
50
0
0
1
2
3
4
Gate bias [V]
Figure 16: SCCF for a NLDMOS power array as function of gate bias. 150 HBM 250 V HMM 350 V
HMM failure
250
HBM failure
HBM 7.6 kV 200 50
0
Voltage [V]
Voltage [V]
100
increases rapidly until the device snaps back when its breakdown voltage of around 135 V is reached as seen by the voltage collapse in Figure 17. At the moment of snapback, all charges stored on the drain parasitic capacitances of the power array and the HBM test board capacitance discharge through the localized snapback segment causing spot-like drain/source filamentation [17]. This additional current peak is also measured in Figure 18, and common when HV devices go into snapback [18]. From Figure 17 and Figure 18, it is clear that a much higher HMM current gives rise to a similar voltage built-up as for HBM. Due to the fast rising nature of the HMM pulse, much more gate coupling occurs, opening a MOS channel to dissipate the current. This MOS channel is not present during the HBM pulse. Due to the different conduction mechanisms, the NLDMOS is more robust against HMM than HBM for low gate bias.
0
20
40
60
80
HMM failure
150
HBM failure
100
100 50
Time [ns]
0
Figure 17: Voltage waveforms of the failing 250 V HBM and 350 V HMM pulses on the NLDMOS power array with 0 V gate bias. 1.2
0
20
40
60
80
100
Time [ns]
Figure 19: Voltage waveforms of the failing 7.6 kV HBM and 1.8 kV HMM pulses on the NLDMOS power array with 4 V gate bias.
HBM 250 V
1
HMM 350 V 5
0.8
HMM failure 0.6
4 HMM failure
0.4
HBM failure
0.2 0
Current [A]
Current [A]
HMM 1.8 kV
0
20
40
60
80
3
HBM failure
2
100
Time [ns]
Figure 18: Current waveforms of the failing 250 V HBM and 350 V HMM pulses on the NLDMOS power array with 0 V gate bias.
Since the NLDMOS has 0 V gate bias, almost no MOS channel is opened, except due to some gate coupling. Therefore, the voltage across the device
HBM 7.6 kV
1
HMM 1.8 kV 0
0
20
40
60
80
100
Time [ns]
Figure 20: Current waveforms of the failing 7.6 kV HBM and 1.8 kV HMM pulses on the NLDMOS power array with 4 V gate bias.
On the other hand, with increasing gate bias, the importance of this additional coupling effect of the HMM pulse decreases such that SCCF rapidly decreases as seen in Figure 16. When analyzing the failure waveforms in case of 4 V gate bias, similar current and voltage levels are observed during HBM and HMM in Figure 19 and Figure 20 respectively. During HBM, failure occurs in the falling part of the current waveform, while for HMM it occurs at its maximum. At these voltage and current conditions, snapback occurs in the device leading to device failure.
IV. Conclusions Based upon a wide range of experimental measurements, a device-type related System to Component level Correlation Factor (SCCF) has been established across many different devices and process technologies. This analysis provides a first step into understanding and obtaining correlation between component level ESD robustness of protection devices and their behavior under system level stress. Next research steps are to see how the actual system level stress arrives at the on-chip protection device and how the on-chip protection can be co-designed with any, if allowed, off-chip protection. Basically, in this paper five different device groups can be distinguished, which are independent of technology. In general, low holding voltage ESD protection devices have a SCCF between 30-40 %, provided they fail both thermally during HBM and HMM. For devices with high holding voltage, SCCF can increase up to 67 % in case of thermal failure. The occurrence of isothermal current filamentation decreases SCCF down to 27 %, even for devices with high holding voltage. Voltage overshoots cause a lower HMM protection level due to its inherent faster nature compared to HBM, reducing SCCF below 20 %. In case different conduction mechanisms are triggered during HBM and during HMM, a large impact on SCCF is observed, ranging from 23 to 150 % in case of the NLDMOS power array. In general, it is very important to know in which category the protection device belongs as it will help in achieving correlation between component and system level ESD robustness.
References [1] [2] [3]
[4] [5] [6] [7] [8] [9] [10] [11] [12]
[13]
[14] [15] [16] [17] [18]
ESD SP5.6, “Electrostatic Discharge Sensitivity Testing - Human Metal Model (HMM)”, ESDA, 2009. ESDA/JEDEC S-001-2010, “Electrostatic Discharge Sensitivity Testing – Human Body Model (HBM) Component Level”, ESDA/JEDEC, 2010. B. Sorgeloos et al., “On-Chip ESD Protection with Improved High Holding Current SCR (HHISCR) Achieving IEC 8 kV Contact System Level”, IEW, Poster 2.8, 2010. G. Notermans et al, “On-Chip Protection of RF Pins Against HMM”, IEW, Presentation A.3, 2010. M. Scholz et al., “On-wafer Human Metal Model Measurements for System Level ESD Analysis on Component Level”, EOS/ESD, pp. 405-413, 2009. W. Stadler er al., “Characterization and Simulation of Real-World Cable Discharge Events”, EOS/ESD, pp. 419-426, 2009. V. A. Vashchenko and V. F. Sinkevitch, “Physical Limitations of Semiconductor Devices”, Springer, 2008. W. Stadler et al., “From the ESD Robustness of Products to the System ESD Robustness”, EOS/ESD, pp. 67-74, 2004. A. Amerasekera and C. Duvvury, “ESD in Silicon Integrated Circuits”, 2nd edition J. Wiley & Sons, 2002. S. Thijs et al., “System to Component Level Correlation Factor”, IEW, Poster 3.3, 2010. D. Trémouilles et al., “Understanding the Optimization of Sub-45nm FinFET Devices for ESD Applications”, EOS/ESD, pp. 408-415, 2007. S. Thijs et al., “CDM and HBM Analysis of ESD Protected 60 GHz Power Amplifier in 45 nm LowPower Digital CMOS”, EOS/ESD, pp. 329-333, 2009. S. Thijs et al., “Characterization and Optimization of Sub-32nm Fin-FET Devices for ESD Applications”, IEEE Transactions on Electron Devices, vol. 55, no. 12, pp. 3507-3516, December 2008. S.L. Jang et al., “Novel Diode-Chain Triggering SCR Circuits for ESD Protection”, Solid-State Electronics, 44, pp. 1297-1303, 2000. M. Scholz et al., “Calibrated Wafer-Level HBM Measurements for Quasi-Static and Transient Device Analysis”, EOS/ESD, pp. 89-94, 2007. D. Lafonteese et al., “Self-Protection Capability of Power Arrays”, EOS/ESD, pp. 364-370, 2009. Y. Chung et al., “Snapback Breakdown Dynamics and ESD Susceptibility of LDMOS”, IRPS, pp. 352355, 2006. D. Linten et al., “Extreme Voltage and Current Overshoots in HV Snapback Devices during HBM ESD Stress”, EOS/ESD, pp. 204-2100, 2008.