The growing number of services like Content Delivery Networks (CDNs) and cloud computing triggers a sustainable growth of data transfer and consequently ...
ICTON 2014
Th.B3.6
Simulated Annealing Algorithm for Optimization of Elastic Optical Networks with Unicast and Anycast Traffic 0LFKDá�$LELQ and Krzysztof Walkowiak*, Member, IEEE :URFáDZ�8QLYHUVLW\�RI�7HFKQRORJ\��:\EU]HĪH�:\VSLDĔVNLHJR�������-����:URFáDZ��3RODQG�
�7HO������� ������������H-PDLO��KU]\V]WRI�:DONRZLDN@SZU�HGX�SO� ABSTRACT The growing number of services like Content Delivery Networks (CDNs) and cloud computing triggers a sustainable growth of data transfer and consequently leads to an increasing interest in anycasting that is an efficient way to provision network requests related to Data Centers. On the other hand, Elastic Optical Network (EON) is an effective and cost-efficient solution for optical networks, which can support bandwidthdemanding needs ranging beyond 100 Gb/s. This paper focuses on joint optimization of unicast and anycast traffic in EONs including both Routing and Spectrum Allocation (RSA). We propose a novel heuristic algorithm to solve the RSA problem. The algorithm – named VSA – is a hybrid method that combines a Simulated Annealing (SA) approach and a simple greedy algorithm. To evaluate our approach, we run a wide range of experiments on real network topologies. First, we tune VSA to find the best values of the algorithm’s parameters. Next, we compare the performance of VSA against CPLEX (optimal results) and other heuristics. According to our experiments, VSA can improve the solution provided by a greedy algorithm by more than 10% and on average is about 4% worse in comparison to the optimal results. Keywords: elastic optical networks, anycast traffic, simulated annealing. 1. INTRODUCTION In recent years, we can observe a continued growth of data transfer, which triggers the demand to develop an efficient and scalable optical transport platform for a capacity beyond 100 Gb/s [1]. Moreover, a substantial increase can be seen in anycast traffic defined as one-to-one-of-many transmission techniques. This increase is caused by the introduction of new services, such as CDNs, cloud computing, IPTV and Video On Demand (VOD) [2], [4]. One of the technologies, which enable improved use of flexible optical network, is a scalable and efficient architecture called SLICE. This approach permits sharing links with a capacity beyond 100 Gb/s into smaller slices and combines them into larger groups. As a result we can achieve a greater variety of spectrum selection scenarios [3]. The SLICE approach, also known as Elastic Optical Network (EON), is an evolution of current optical networks. In contrast to current solutions, EON allows the resources to be assigned accordingly to the size of the required bandwidth [2]. A new optimization problem, known as Routing and Spectrum Allocation (RSA), occurs with the development of the EON technology. In this paper, we propose a novel metaheuristic algorithm for an RSA problem with joint unicast and anycast traffic. The proposed VSA algorithm is a hybrid method that improves a solution yielded by a simple greedy algorithm by using Simulated Annealing approach. An important part of metaheuristics is tuning of the algorithm. Therefore, we pay special attention to evaluate selection of algorithm’s parameters. According to the best of our knowledge, this is the first paper that proposes a SA algorithm in the optimization of EONs with joint unicast and anycast flows. The remainder of the paper is organized as follows. In Section 2, we describe a heuristic algorithm – VSA. In Section 3, we present numerical results for algorithm tuning, followed by our results and lastly we conclude our findings. 2. HEURISTIC ALGORITHM In this Section, we present a novel VSA algorithm proposed to solve RSA problems with joint unicast and anycast traffic. In particular, we solve two ILP models with two different objective functions. The first one – called MaxSpec – minimizes the maximum spectrum usage and was formulated in [4]. The second model called AvgSpec focuses on minimization of average spectrum usage and was presented in [7]. The VSA method is based on the SA approach, which is a generic probabilistic heuristic for the global optimization of a given function in a large search space. In VSA, a solution of the optimization problem is represented as a sequence (ordering) of demands. To calculate the objective function of a particular solution, we allocate the demands in the network one by one according to the particular sequence using a following procedure. For each demand, we analyze all possible candidate paths provided in advance (H�J., using N-shortest path algorithm). For each examined path, using the First Fit approach we calculate the value of the considered objective function, assuming that the demand is assigned to a particular path. Finally, we select a candidate path that guarantees the best value of the objective function. In the case of anycast demands, the candidate paths leading to all possible Data Center (DC) nodes are analyzed. Below, we present a pseudo-code of the algorithm.
978-1-4799-5601-2/14/$31.00 ©2014 IEEE
1
ICTON 2014
Th.B3.6
Algorithm 1 VSA 1:�FXUUHQW5 m FXUUHQW0; EHVW m FXUUHQW5, 7� m �EHVW P 2: while (L�LPD[ and 7�!�0.01): 3: G1� m rand(D), G2 m rand(D) Swap(G1�G2); calculate FXUUHQW5 4. 5. WHPS$ m countAllTakenSlices(); 6. if (WHPS$ < EHVW): 7: EHVW� m �WHPS$; 8: GHOWD� m �WHPS$�–�FXUUHQW5; 9: if (GHOWD < 0):
10: FXUUHQW5� m �WHPS$; 11: else: 12: [ m rand(); 13: if ([ < exp�-GHOWD�7)): 14: FXUUHQW5� m �WHPS$; 15: else: 16: Swap(G1�G2); 17: 7� m �7 M; 18: return EHVW;
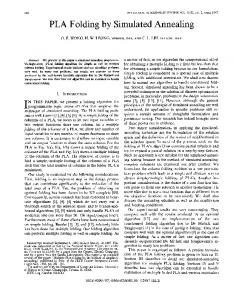
In line 1, we calculate an initial solution (sequence of demands and value of the objective function) denoted as FXUUHQW0 using the MSF algorithm introduced in [5]. This solution is selected as the best solution – EHVW and current solution – FXUUHQW5. Also, in line 1, we calculate initial temperature 7. We present an innovative approach for the calculation of this parameter that is fully automated. We take the result (number of slices) generated by MSF in line 1 and multiply it by P� parameter, which is an input tuning parameter of VSA. The simulation is being processed until we fulfill conditions from line 2 (number of iterations L�is smaller than the maximum number LPD[� and the temperature 7 has not reached absolute temperature, which is equal to 0.01). In line 3, we randomly select two demands, swap them in the sequence of demands and calculate a new result. We save the number of the current solution (number of slices) (countAllTakenSlices()) into WHPS$ variable and then process it by using the SA algorithm. If condition in line 6 is fulfilled, we assign a temporary result to best result and calculate GHOWD – difference between FXUUHQW5�DQG�WHPS$. Next, in line 9 we review if the current solution is better than the best by checking the value of GHOWD� and accordingly we assign FXUUHQW� as WHPS$. If it is not fulfilled, we randomly pick a value of [ (line 12) and check if it is smaller than Boltzmann function of probability distribution (line 13). If it is fulfilled, we repeat the same operation as in line 10. Alternatively, (L�H., [ is larger or equal then Boltzmann function), we swap the demands to restore the previous state without saving the result. Finally, we reduce the temperature 7 with the M parameter, named as a cooling rate parameter. When we fulfill conditions from the loop in line 2, we return best result as a result of an algorithm. For better understanding of the algorithm refer to [6]. 3. NUMERICAL RESULTS In this Section, we discuss the results of computational experiments. The goal of the experiments is threefold. First, we evaluate the performance of the VSA by tuning the three input parameters – jump parameter, number of iterations and the initial temperature. Second, we focus on the trade-off between the execution time and the effectiveness of the algorithm. Finally, we compare two objective functions considered in optimization. 3.1 Experiments design The experiments were performed using four network topologies - Euro28, Euro16, UBN24 and NSF15 (Fig. 1). In the experiments, we apply an anycast ratio ($5) parameter that is related to a ratio between anycast and unicast traffic in the network. In detail, we assume that K$Q\ and K8QL denote the overall volume of all anycast and unicast demands, respectively. Next, let K$OO = K$Q\ + K8QL denote the overall demand in the network. The $5 parameter is defined as the volume (capacity) of all anycast demands divided by the volume of all demands in the network, L�H., $5 = K$Q\ / K$OO. We run various simulation scenarios. Parameters that we changed in each scenario are as follows: ratio of anycast to unicast traffic – 0%, 20%, 40%, 60%, 80%, 100% ($5); number of DC (replica) nodes – 1, 2, 3, (4 – for UBN24 and Euro28) and candidate paths – 2, 3, 5, 10, 30. For each value of $5�we generate 5 demand sets, which were tested for 12 (16 for bigger topologies) different scenarios of location and number of DCs. This gave us the overall number of 360 (480 for bigger topologies) separate experiments. Since CPLEX can find optimal results of considered ILP models only for relatively small instances, to obtain optimal results we use only smaller topologies (NSF15 and Euro16), with overall demand K$OO equal to 2.5 Tbps, and the number of candidate paths is N = 2. Afterwards we compare the optimal results given by CPLEX 11.0 solver [8] to the following reference algorithms: FF [3], MSF [5] and LSF [5]. However, for experiments presenting the relationship between both maximum spectrum and average spectrum, we use all larger topologies with overall demand K$OO ranging from 40 Tbps to 50 Tbps. Concerning EONs assumptions, we use the half distance law, as in [4], [5] and [9], for selecting modulation levels for lightpath connections. 3.2 Tuning of the VSA Algorithm To tune VSA, we examine Euro16 topology for 15 separate cases different in terms of DC nodes numbers, amount of anycast and unicast traffic and number of candidate paths. We conduct simulations to tune the following three parameters of VSA algorithm: number of iterations, initial temperature 7�calculated according to
2
ICTON 2014
Th.B3.6
the m parameter and the cooling rate parameter – M� Firstly, we tune cooling rate (M) and define initial temperature using m parameter. We consider all combinations of three cases of M and three cases of m resulting in 9 scenarios summarized in Table 1. 7DEOH����7XQLQJ�VFHQDULRV�� Scenario No.
M�
m�
S1
0.9
10%
Optimality Gap 2.76%
S2
0.99
10%
2.92%
S3
0.999
10%
3.14%
S4
0.9
5%
2.72%
S5
0.99
5%
2.12%
S6
0.999
5%
2.89%
S7
0.9
2.5%
2.18%
S8
0.99
2.5%
2.21%
S9
0.999
2.5%
2.84%
)LJXUH����1HWZRUNV�XVHG�LQ�WKH�VLPXODWLRQV.� � � Each individual result is averaged over 15 cases and 10 repetitions of the algorithm for each case. The number of iterations is limited to 15,000. As we can see in Table 1, the best combination of tuning parameters is obtained in scenario S5 – the average optimality gap of VSA for this scenario is 2.12%. According to additional simulations carried out to determine the number of iterations, we set this parameter to 10,000, since this value provided the best trade-off between quality of results and execution time. As a result of the tuning process, we select the following values for further experiments: number of iterations – 10,000,�m = 5%,�M�=�0.99. The results of the tuning process presented above refer to the MaxSpec function, however in the case of the second AvgSpec function, the results of tuning process were comparable. �
�
3.3 Optimality Gap of VSA in MaxSpec and AvgSpec ILP models In this Section, we present optimality gaps of VSA and other heuristic algorithms. As we can see in Table 2, VSA is much better than other algorithms, with stable results in terms of confidence intervals. We can easily notice that the optimality gap of VSA for the AvgSpec model presents similar trends as for the MaxSpec model. Regarding the execution time, VSA outperforms CPLEX providing optimal results, L�H., for Euro16 network VSA needs about 60 seconds, while CPLEX requires on average 400 seconds. It should be underlined that VSA can significantly improve the initial solution provided by MSF (about 10% for MaxSpec and about 20% for AvgSpec). 7DEOH����3HUIRUPDQFH�RI�DOJRULWKPV. 2SWLPDOLW\�JDS�IRU�$YJ6SHF�0RGHO
2SWLPDOLW\�JDS�IRU�0D[6SHF�0RGHO FF
MSF
LSF
VSA
FF
MSF
LSF
VSA
NSF15
45.1%
13.1%
18.1%
3.8%
NSF15
51.4%
26.7%
22.5%
3.7%
Euro16
48.6%
11.5%
14.3%
4.3%
Euro16
50.5%
24.4%
19.0%
4.0%
/HQJWKV�RI�����FRQILGHQFH�LQWHUYDOV
/HQJWKV�RI�����FRQILGHQFH�LQWHUYDOV NSF15
2.09%
1.51%
1.78%
0.69%
NSF15
2.42%
1.59%
1.66%
0.91%
Euro16
2.15%
1.43%
1.56%
0,92%
Euro16
2.34%
1.02%
1.26%
0,74%
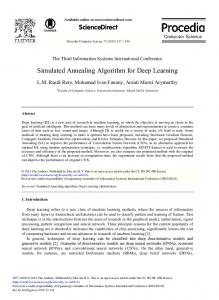
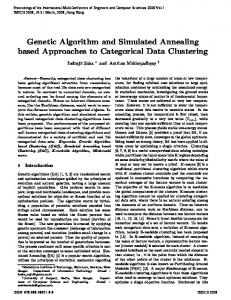
3.4 Results LQ�ELJJHU�QHWZRUN�LQVWDQFHV Finally, we report additional results to show the difference between average and maximum spectrum usage of unicast and anycast traffic in EON, evaluated by VSA for bigger networks UBN24 and Euro28. Note that in Figs. 2 and 3, the number next to the name of function (MaxSpec/AvgSpec) refers to a number of Data Center nodes in the network. As we can see in Fig. 2, the difference between two examined objective functions grows with the increase of anycast traffic ratio, however different performance is observed for various number of DC nodes, In general, with the increase of anycast traffic ratio, the average spectrum usage decreases. A corresponding trend for maximum spectrum is different, especially for 2 DCs. This follows mostly from the fact that maximum spectrum denotes the spectrum usage in the most congested link – in the case of 100% of anycast traffic and with only 2 nodes, the links adjacent to DC nodes are strongly congested and causes high values of this performance metric. Nevertheless, in the same case, the average utilization of the spectrum is much smaller, which is the main advantage of anycast traffic. In Fig. 3, we compare two cases in terms of the number of DC nodes. We can observe that with the increase of anycast traffic ratio, the difference between 1 and 4 DC nodes significantly grows up to factor of five. This is due to the fact that using more DC nodes decrease
3
ICTON 2014
Th.B3.6
the lightpaths’ lengths, what is especially visible when there is more anycast traffic, Moreover, this effect is amplified but possibility to use higher modulation formats which are available to implement as a result of smaller distance.
)LJXUH����'LIIHUHQFHV�LQ�VSHFWUXP�LQ�8%1��.�
)LJXUH�3��$YHUDJH�VSHFWUXP�XVDJH�IRU�(XUR��.�
4. CONCLUSIONS In this paper, we have focused on anycast-oriented EONs. In particular, we have proposed a novel metaheuristic algorithm named VSA. We have presented detailed results related to tuning for the VSA algorithm. To assess the algorithm performance, we have compared VSA with other reference algorithms and with optimal results generated by CPLEX for smaller networks. The numerical experiments have shown that VSA outperforms the reference heuristics as well as demonstrates significantly lower execution times and brings radically better scalability than CPLEX. Moreover, we have performed additional experiments to show the difference between average and maximum spectrum usage in EON. Furthermore, we have shown that increasing the number of DCs can bring savings in the spectrum usage, especially for large values of the anycast ratio. In future work, we plan to include in our research on EONs other objective functions such as network CAPEX/OPEX cost and power consumption, as well as develop a SA algorithm for these new optimization problems. Moreover, we would like to formulate a SA method for optimization of multicast flows in EONs. ACKNOWLEDGEMENTS This work was supported by The Polish National Science Centre (NCN) under Grant DEC2012/07/B/ST7/01215 and statutory funds of the Department of Systems and Computer Networks, Wroclaw University of Technology. REFERENCES [1] M. Jinno, H. Takara, B. Kozicki, Y. Tsukishima, Y. Sone, and S. Matsuoka, “Spectrum-efficient and scalable elastic optical path network: Architecture, benefits, and enabling technologies”, ,(((� &RPPXQLFDWLRQV�0DJD]LQH� vol. 47, no. 11, pp. 66-73, 2009. [2] B. Kozicki, H. Takara, Y. Tsukishima, T. Yoshimatsu, K. Yonenaga, and M. Jinno, “Experimental demonstration of spectrum-sliced elastic optical path network (SLICE)”, 2SWLFV�([SUHVV, vol. 18, no. 21, pp. 22105-22118, Oct. 2010. [3] M. Jinno, H. Takara, B. Kozicki, A. Hirano, Y. Tanaka, Y. Sone, and A. Watanabe, “Distance-adaptive spectrum resource allocation in spectrum-sliced elastic optical path network”, ,(((�&RPPXQLFDWLRQV� 0DJD]LQH, vol. 48, no. 8, Aug. 2010. [4] K. Walkowiak and M. Klinkowski, “Joint anycast and unicast routing for elastic optical networks: Modeling and Optimization”, in 3URF��,(((�,QWHUQDWLRQDO�&RQIHUHQFH�RQ�&RPPXQLFDWLRQV��,&&����� , Budapest, Hungary, Jun. 9-13, 2013. [5] K. Christodoulopoulos HW�DO., “Elastic bandwidth allocation in flexible OFDM based optical networks”, ,(((�-��/LJKWZ��7HFKQRO�, vol. 29, no. 9, pp. 1354-1366, May 2011. [6] S. Kirkpatrick, C.D. Gelatt, and M.P. Vecchi, “Optimization by simulated annealing”, 6FLHQFH� vol. 220, pp. 671-680, May 1983. [7] K. Walkowiak, R. *RĞFLHĔ��and M. Klinkowski, “On minimization of the spectrum usage in elastic optical networks with joint unicast and anycast traffic”, in 3URF��$VLD�&RPPXQLFDWLRQV�DQG�3KRWRQLFV�&RQIHUHQFH� �$&3 � Sep. 2013. [8] ILOG AMPL/CPLEX software: www.ilog.com/products/cplex/ [9] L. Velasco HW�DO., “Modeling the routing and spectrum allocation problem for flexgrid optical networks”, 3KRWRQ�1HWZ�&RPPXQ�, vol. 24, pp. 177-186, Dec. 2012.
4