such as the Overhead Monorail Vehicles (OMV) or. Overhead Hoist, can be overly expensive. ... of the product in a carrier now signifies the issue of the queuing ...
SAT
Proceedings of the 2000 Winter Simulation Conference J. A. Joines, R. R. Barton, K. Kang, and P. A. Fishwick, eds.
Simulations- und Automations- Technologie GmbH Gesellschaft für IT-Consulting und Systemintegration
SIMULATION BASED COMPARISON OF SEMICONDUCTOR AMHS ALTERNATIVES: CONTINUOUS FLOW VS. OVERHEAD MONORAIL Igor Paprotny Juin-Yan Shiau Yo Huh Gerald T. Mackulak Department of Industrial Engineering Arizona State University Tempe, AZ 85287-5906, U.S.A
limitations. When wafer carriers were smaller and the value per carrier was less, manufactures could not easily justify the benefits of automated material handling systems (AMHS). The migration to 300 mm has however entirely changed the evaluation criteria. In the 300 mm era, product can no longer be physically carried by an operator, since a typical FOUP weighs approximately 20-25 lbs. It is also probable that manual movement will induce potential damage by inappropriate movement stress. Also, the value of the product in a carrier now signifies the issue of the queuing time. The longer product sits in queues, the greater the expenditures related to WIP. Using our prior adjustment factor, it is conceivable that the same number of FOUPs in a facility will increase the cost of WIP by nearly 200%. Automation that minimizes product availability delays is therefore an essential component of today’s semiconductor fabricators. Traditionally, fab-wide Interbay material handling was conducted using a fleet of Overhead Monorail Vehicles (OMV) produced by industry leaders Daifuku, PRI Automation, and Toshiba. The vehicles were relatively efficient, and occupied little of the expensive clean room floor space as they traveled on tracks suspended above the main fab floor. Scheduling computers could monitor the production equipment status and re-direct in-transit product to the most desirable location. These systems were useful but expensive, costing in the range of $10,000,000 $20,000,000 for a moderately sized fab implementing only interbay automation. The cost of such an AMHS often prevented deployment in smaller factories operating at less than 10K wafer starts per month. A low cost alternative handling approach has been proposed for these low volume manufacturing situations. The real issue is whether this approach could also be used as a low cost approach in higher volume manufacturing. This lower cost approach is called Continuos Flow Transport (CFT). This new system uses conveyor
ABSTRACT Automation is an essential component in today’s semiconductor manufacturing As factories migrate to 300 mm technology, automated handling becomes increasingly important for variety of ergonomic, safety, and yield considerations. Traditional semiconductor AMHS systems, such as the Overhead Monorail Vehicles (OMV) or Overhead Hoist, can be overly expensive. Cost projections for a 300mm inter/intrabay AMHS installation are in the range of $50M - $100M. As an alternative, a lower cost alternative AMHS, called Continuos Flow Transport has been proposed. The CFT system is similar to what has historically been identified as a conveyor based movement system. The CFT system provides cost savings at reduced flexibility and longer delivery time. This study compares the CFT to Overhead Monorail transport, determining a cumulative delivery time distribution. As expected, the CFT system requires a longer average delivery time interval than OMV, but may provide total savings through reduced transport variability. 1
INTRODUCTION
The days of manual material handling systems in semiconductor manufacturing are limited. As wafer sizes increase from 200 mm to 300 mm so too does the density of the product. A 300 mm wafer contains approximately 2.25 times the product of a 200 mm wafer. Since a typical wafer carrier contains 25 wafers regardless of wafer diameter, it is safe to conclude that the value of a standard carrier of product has also increased by the same percentage. It is not uncommon to have a single carrier of 25 wafers with a combined retail value of over $1,000,000. If material handling is conducted manually the potential for damage increases from 1%-3% due to the inexactness of operator handling techniques and physical
1333
Paprotny, Shiau, Huh, and Mackulak The primary metrics used for comparison in this study are the average delivery and transport times. As will be discussed, it is also important to examine the standard deviation of these averages. In this study, we define delivery time as the interval between the request to move and the time of arrival at the necessary destination. Transport time is defined as the time it takes for a lot to move once it has been allocated a transporter device at its current location. Delivery times therefore includes the delay associated with waiting for a vehicle to arrive at the pickup location while transport time is more of a true measure of actual movement time.
technology to perform material transportation between, and within the various process areas. It has been discussed by Arzt and Bulcke (1999), Heinrich et al. (1999), and Jarning and Griessing (1997). The CFT method has a definite cost advantage over OMV, but the performance issues have yet to be resolved. 2
PROBLEM STATEMENT
This paper compares the performance of the OMV and CFT handling methods as applied to a low volume 300 mm wafer fab presented in the literature. The performance metric selected for comparison is the delivery time distribution. Prior studies have indicated that the distribution of delivery time is as important as the average value of the delivery time in an operating factory (SokhanSanj et al. 1999), (Wu et al. 1999). This analysis compares the performance of both systems, and establishes an equivalence point (i.e. the conditions that must occur to make the two paradigms perform equivalently). The results of the study are summarized in a concluding discussion, where the tradeoffs and advantages of implementing one system versus the other are discussed. 3
3.1 OMV Model Specifics The AMHS layout of the OMV model is presented in Figure 1.
THE AMHS MODELS Figure 1: OMV AMHS layout
The operational data, physical constraints, and product routings for the simulation models are extracted from Arzt and Bulcke (1999). The throughput was set at 9000 wafer starts per month, and production was assumed to be running 24 hours a day, 7 days a week. Generic SEMATECH process-flows were used to depict the material-flow patterns throughout the factory. Two ARENA based simulation models were created to compare these approaches. Both models were implemented on an identical factory configuration, differing only in the material handling system implementation. Machine process times, yields, machine buffer storage, and operators were included through the creation of the movement request data as opposed to being explicitly included as components of the model. The ARENA models are designed to model only the transport portion of the AMHS design. All other factors are modeled by the pattern of movement requests. For example, a machine tool that is down 50% more than another tool would request 50% less movement of material. The input data and process flow are transformed into a series of average movement rates that are then fed to the handling system model according to an exponential distribution. These assumptions for modeling handling system has been discussed and accepted as valid by Sokhan-Sanj et al. (1999).
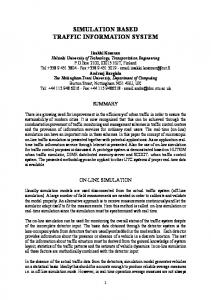
The OMV model was designed according to bestknown practices and state-of-the-art equipment set. The monorail segments were unidirectional. Three track intersections were designed such that the vehicles could shortcut their travel around the main loop. The vehicle speed was set to 60 m/min, (200 ft/min.) and each vehicles could carry one lot of 25 wafers at a time. The lots were transported between ASRS-devices placed at the end of each of the six bays. It was assumed that the ASRS robot interfaced with the interbay handling system and the operators in the bay. Thus, intrabay moves were added to the ASRS robot workload to provide a more realistic estimate of ASRS robot utilization. Initially, pilot runs were performed on the OMV baseline model to determine the number of vehicles to be used in the system. The results of the pilot study are depicted on Figure 2. The optimal vehicle number was determined by identifying the break point, past which adding additional vehicles would yield only marginal improvement to the system delivery time. In the case of the baseline OMVsystem, this break point was identified to be 3 vehicles. Once determined, all future OMV simulation runs were performed using this three vehicle level.
1334
Paprotny, Shiau, Huh, and Mackulak on the correlation analysis, batches of 140 observations were used to build the confidence intervals around the respective means. The delivery and transport time results from the OMV and CFT simulation runs are presented in Tables 1 and Table 2.
Average Delivery Time, OMV System 12 10 Delivery Time
Delivery T
8
Transport T
6
Table 1: Simulation Results from the OMV Base Model Configuration OMV Baseline Average Half Width 3 min 34 sec. 5 sec. Delivery Time 1 min 5 sec. 1 sec. Transport Time
4 2 0 2
3
4
Vehicle Number
Figure 2: Results of the OMV Pilot Study 3.2 The CFT Model Specifics
Table 2: Simulation Results from the CFT Base Model Configuration CFT Baseline Average Half Width 6 min 52 sec. 7 sec. Delivery Time 5 min 49 sec. 6.5 sec. Transport Time
The AMHS layout of the CFT model is presented in Figure 3. As illustrated, this layout does not contain turntable crossovers or loops. However, it does allow bi-directional flow through implementation of two unidirectional conveyor segments. The load/unload robot is also capable of reaching across the physically closer conveyor segment to remove or place product on the further segment. This provides the illusion of a bi-directional conveyor using low-cost unidirectional equipment.
A typical wafer lot was on average delivered in 3.5 minutes using the OMV transporter, and a little under 7 minutes in the case of the CFT system. Based on the average delivery time metric, the OMV outperformed the CFT, with delivery time values being approximately half as large as in the latter case. Any ASRS robot poses the possibility of being over utilized, and hence potentially become the limiting factor of the AMHS. In this implementation, the relatively low throughput rate of the system did not impose any excessively high utilization on the ASRS robot. The ASRS robot was only utilized around 10 % – 14 % for the OMV system and 7 % – 12 % for the CFT, and thus did not impose any real limitations on the performance of both baseline models. The significant difference in delivery times of both models was largely attributed to the significantly slower transportation speed of the CFT-system. However, sheer difference in speed should result in a factor of twelve related to delivery time differences. The results indicate a factor close to six. The OMV system requires the allocation of a free vehicle before the transportation can be initiated. The simulation suggests that approximately two minutes of the total delivery time was attributed to lots waiting for pick up by a vehicle. This account for the additional deviation from what should be expected by the speed differences of the two implementations. As the size of the factory increases, the optimal number of vehicles in general does promote a more effective free vehicle allocation scheme, never the less waiting for transport will always be a reality in an OMV-system. In the CFT implementation, the transportation medium is in general always available, a lot has merely to wait for enough free conveyor space to accommodate its size. Our simulation analysis showed that in the base CFT model, the average wait time for a free conveyor segment was 1.5 sec, and can
Figure 3: CFT AMHS Layout The CFT model was designed as close as possible to the specifications obtained from Arzt and Bulcke (1999). The conveyor speed of both lanes was set to 5 m/min. (16.4 ft/min.) and the wafers were transported in lots of 50. The large lot-size consequently halved the number of transportation moves in the CFT –model, compared with the OMV implementation. A single, robotic loading/offloading device was used to place and retrieve lots to and from the conveyors. The robot placed the lots on a buffer, where they would wait until they could access the conveyor. A pilot study found that on average a lot would wait only approximately 1 second to access the conveyor, therefore the number of buffer location available for loading was not explicitly modeled. 4
SIMULATION RESULTS
Simulation runs were conducted by executing both base models for approximately 7 days of simulated time, with the first 16.5 hours truncated to avoid startup bias. Based
1335
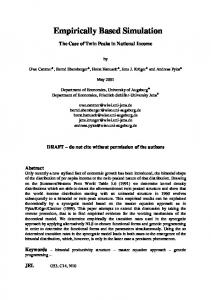
Paprotny, Shiau, Huh, and Mackulak variability is discretely distributed, and in a deterministic system would be visible as discrete breakpoints in the delivery time distribution plot. Figure 4 does not exhibit any discrete delivery time breakpoints, thus the difference in bay-to-bay distances is not a major contributor to the delivery time variability. In our implementation of the OMV system, the analysis dictated that the uncertainty in the location and the availability of a transport unit was the major contributor to the variability of the delivery times. The allocated vehicle could be found located at the same station the request came from, but also might be located on the other side of the facility. Thus, the average time waiting for vehicle arrival could range from virtually zero, to several minutes. Figure 5 depicts the delivery time distribution obtained from the CFT system simulation. It is obvious that the major contributor to the variability of the delivery time is the variability in the distances between all the bay-to-bay combinations. Five discrete breakpoints can be found in the distribution plot, which are attributed to the five distance combinations between the bays. The standard deviations of the delivery time for the two systems, extracted from three distinct stocker-to-stocker distance combinations, are displayed in Figure 6. The standard deviation obtained from the OMV-system is nearly 10 times larger that what was obtained from the CFT-model. The conclusion can thus be drawn that the delivery time in the CFT - system, although slower, is more predictable than in the case of the OMV – implementation.
in reality be disregarded. In contrast with the OMV model, most of the delivery time in the CFT-system is spend on the actual transportation of lots between the bays. The speed of delivery is however not the only important metric. The CFT has an advantage over the OMV implementation, which may not be apparent based on a pure delivery time average comparison. Figure 4 and Figure 5 presents plots of the delivery time distributions from the OMV- and the CFT- models. OMV Delivery Time 1.2
0.15 Frequency
1 0.8
0.1
0.6 0.05
0.4 0.2
0
0 0
1
2
3
4
5
6
7
minutes
8
9
10
Cell Cumulative
Figure 4: Delivery Time Distribution of the OMV – Implementation
Frequency
CFT Delivery Time 1.2
0.16 0.14 0.12 0.1 0.08 0.06 0.04 0.02 0
1 0.8 0.6 0.4
Variability of CFT vs. OMV
0.2 2.5
0 0
3.8 5.3 6.8 8.3 9.8 11.3 12.8 14.3 15.8 17.3 minutes
2
Cell Cumulative
Stdev.
Figure 5: Delivery Time Distribution of the Base CFT – Implementation The delivery time distribution of the OMV-system resembles a slightly skewed normal distribution. This is usually the case in a vehicle based transport system. The individual delivery times display a central tendency towards the average value, however an AMHS composed of distributed vehicles adds inherent uncertainty to the lot delivery times. Central tendencies result from the speed and distance relationships inherent in the facility layout. Little can be done to improve the average transport time if high flow tools are placed distant from one another. Variability occurs from vehicle interference, vehicle availability and dispatching logic, and can be addressed through design considerations. One contributor to delivery time variability in any AMHS system implementation is the differences in distances between the individual bays. The transport time of a lot going to adjacent bay will be much less than a move required to traverse the length of the facility. This
1.5
1
CFT
0.5
OMV 0
Short-range
Med-range
Long-range
Figure 6: The Standard Deviation of the CFT Compared to the OMV-System A second phase of the analysis using the CFT model was performed to determine the conveyor speed at which the delivery times of the two systems would be equivalent. It was found that a conveyor speed of 12.5 m/min (41 ft/min) resulted in an average delivery time of the CFTsystem equal to 3 min and 28 sec., slightly outperforming the OMV system. The delivery time distribution of the 12.5 m/min CFT system is depicted on Figure 7. The discrete breakpoints are still visible, however the variability of the ASRS-robot cycle creeps in, smoothing out the distinctions between individual breakpoints.
1336
Paprotny, Shiau, Huh, and Mackulak the WIP from static storage in the ASRS units to dynamic storage on the transporter unit. In the base CFT implementation an average of 3 lots were found to be in transit at any given time. This represents only a fraction of the total WIP in the system. However, larger distances between the bays, together with higher product throughput values, would lead to a higher concentration of WIP on the CFT system. Additional work needs to be conducted where the role of the CFT system becomes storage as well as a delivery mechanism. The CFT average delivery time became equivalent to that of the OMV at a conveyor speed of 12.5 m/min (41 ft/min). This value is close to one-fifth of the speed of the OMV system. Obtaining the equivalence point despite the remaining difference in velocity of the two systems is attributed largely to the relatively long vehicle wait time in the OMV-implementation. As the distance between bays becomes larger, and more vehicles are introduced into the system, the conveyor speed necessary to maintain equivalence with the OMV system will increase. Consequently, a state-of-the-art OMV system should outperform the CFT system if it contains mechanism that will aim to reduce the time lots wait for transporter pickup. Dynamic free vehicle allocation or free vehicle dispersion heuristics are two techniques that can be used to reduce the lot pickup time. As the pickup time will decrease, so will its variability, making the delivery time more predictable. In this study, stochastic failure of the AMHS components was not included. In the future, the two systems should be compared using realistic failure data. The severity of failure impact on the system performance should be investigated. If an OMV vehicle experiences a failure, it may only be blocking the track segment it is currently on, or may be taken of the track. The remaining vehicles can take alternative routes, still performing the material transport. A conveyor segment that is down may conceivably bring down the entire AMHS system, greatly increasing average delivery time.
12 m/min CFT Delivery Time 0.12
1.2
Frequency
0.1
1
0.08
0.8
0.06
0.6
0.04
0.4
0.02
0.2
0
0 0
1.7
2.45
3.2
3.95
4.7
5.45
minutes
6.2
6.95 Cell Cumulative
Figure 7: Delivery Time Distribution of the 12.5 m/min CFT – Implementation 5
DISCUSSION OF THE RESULTS
The study discovered the base case OMV system performed an average delivery time in half the time of the CFT system. However the OMV system exhibited more inherent variability due to uncertainty in the allocation of free transporter units. Our simulation model was constructed based on the CFT implementation presented in Arzt and Bulcke (1999), representing a relatively small semiconductor facility. Although the comparison results for larger AMHS implementations might differ, the basic factors contributing to the performance of the material handling implementation should remain the same. As facility size increases, the differences in the performances of the two systems are likely to increase due to low speed of the CFT. Thus the advantages/disadvantages of both paradigms should be considered prior to making the decision of the implementation of either one of the two approaches. The material handling system should as seamlessly as possible interface with the other facility operations and the system as a whole should be evaluated during the entire design cycle. Low delivery times are necessary in factories where processing schedules are determined with little or no planning horizon. A fab that implements dispatching of lots based on tool availability will be dependent on the ability of the AMHS to rapidly deliver lots to their destinations. However, lot delivery times seize to be overly important in a factory that schedules the processing of lots within a finite-planning horizon. In fact, such systems will work better if the variability of the delivery time, as opposed to the average value, is reduced. If the estimated time to deliver a lot to its destination can reasonably well be established a priori, such delay time can be incorporated in the scheduler as an indication of how early the transport needs to be initiate in order for the lot to arrive on time. The conveyor exhibits high throughput capacity, with good ability to estimate its bay-to-bay delivery times. This will purposely allow utilizing a slow conveyor-based transporter as the means for transferring some portion of
REFERENCES Arzt, T.and F. Bulcke. 1999. A New Low Cost Approach in 200 mm and 300 mm AMHS. Semiconductor Fabtech, 10: 19-26. Heinrich, H. and A. Pyke. 1999. The Impact of Conveyor Transports on Factory Performance at Infineon’s (Siemens) 200 mm Fab. Semiconductor Fabtech, 10:, 15-18. Jarning, H. and J. Griessing. 1997. Cleanroom ‘sea of lots’ concept. European Semiconductor, 33-35. Sokhan-Sanj, S., G. Gaxiola, G.T. Mackulak, F. Malmgren. 1999. A Comparison of the Exponential and Hyperexponential Distributions for Modeling Move Requests in a Semiconductor Fab, In Proceedings of the 1999 Winter Simulation Conference, 774-778.
1337
Paprotny, Shiau, Huh, and Mackulak Wu, S., S. Sokhan-Sanj, G.T. Mackulak and G. Gaxiola, 1999. Impact of Manufacturing Variability on Automated Material Handling System Performance, In Proceedings of the 1999 International Conference on Semiconductor Manufacturing Operational Modeling and Simulation, 81-85. AUTHOR BIOGRAPHIES IGOR PAPROTNY is a graduate research associate in the Industrial Engineering Department at Arizona State University. He received an Engineering Diploma in Mechatronics from the NKI College of Engineering in Oslo, his B.S.I.E. degree from Arizona State University, and is currently pursuing his M.S.I.E. He is a member of IIE, SCS and INFORMS. His interests include advanced simulation concepts and methodologies, CAD-assisted simulation cycle time reduction, AI, distributed robotic systems and control. His email and web addresses are and . JIUN-YAN SHIAU is a graduate research associate in the Department of Industrial Engineering at Arizona State University. His interests include information systems, simulation, and manufacturing systems analysis. His email address is . YO HUH is a graduate research associate in the Department of Industrial Engineering at Arizona State University. His interests include applied operations research, queuing theory, and modeling of manufacturing systems. His email address is . GERALD T. MACKULAK is the Executive Associate Chair and Director of Undergraduate Studies in the Department of Industrial Engineering at Arizona State University. He received his B.S.I.E., M.S.I.E., and Ph.D. from Purdue University. He is a member of the SCS and IIE. His research interests include simulation methodology, production systems, and AMHS performance in semiconductor manufacturing. His email is .
1338