results integrating this system with a multi-degree of freedom mobile robotic platform, a tactile sensory attention model of action selection to guide exploration, ...
Simultaneous localisation and mapping on a multi-degree of freedom biomimetic whiskered robot Martin J. Pearson1 , Charles Fox2 , J. Charles Sullivan1 , Tony J. Prescott2 , Tony Pipe1 and Ben Mitchinson2 Abstract— A biomimetic mobile robot called “Shrewbot” has been built as part of a neuroethological study of the mammalian facial whisker sensory system. This platform has been used to further evaluate the problem space of whisker based tactile Simultaneous Localisation And Mapping (tSLAM). Shrewbot uses a biomorphic 3-dimensional array of active whiskers and a model of action selection based on tactile sensory attention to explore a circular walled arena sparsely populated with simple geometric shapes. Datasets taken during this exploration have been used to parameterise an approach to localisation and mapping based on probabilistic occupancy grids. We present the results of this work and conclude that simultaneous localisation and mapping is possible given only noisy odometry and tactile information from a 3-dimensional array of active biomimetic whiskers and no prior information of features in the environment. Index Terms— Biomimetic, Tactile SLAM, Whiskered robot
I. INTRODUCTION Many small mammals explore their environment and navigate using the sense of touch through their array of active facial whiskers[1], [2]. This enables such animals to survive and forage effectively in habitats where visual cues are sparse. Similarly, the ability to explore and localise using whisker based touch would allow future autonomous vehicles to operate more effectively in environments where current sensory systems, such as laser, acoustic or machine vision, perform poorly. Confined, dusty or smokefilled spaces such as collapsed buildings, unstructured, perhaps arboreal, environments and even turbid water, are examples of operational domains where a sense of touch could be beneficial for autonomous robot navigation[3]. A recent study of rats has found that tactile encoded locations of reward are represented in hippocampus[4], a structure within the brain that is associated with the consolidation of event memory[5]. Intriguingly, the hippocampal formation has also been demonstrated as instrumental in localisation and navigation within familiar (i.e., previously explored) environments[6]. It has been proposed that the ‘place cells’ of hippocampus region CA1&3[7], in conjunction with the ‘grid cells’ of the entorhinal cortex[8] and the granule cell mossy fibres of the dentate gyrus, encode a metric map of the immediate environment. It has also been suggested that through the integration of self-motion, head orientation and multi-modal sensory cues, the hippocampal formation maintains an estimate of the animal’s location and orientation This work was supported by FET Proactive BIOTACT (ICT-215910) and EPSRC Grant number EP/I032533/1 1 Bristol Robotics Laboratory, Universities of Bristol and of the West of England, Bristol, UK 2 Active Touch Laboratory, Sheffield University, Sheffield, UK
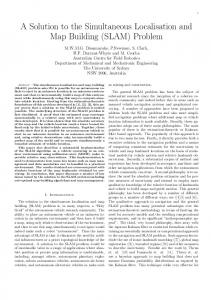
Fig. 1. Photographs of Shrewbot within the test arena (left) and exploring an object using an array of 18 active biomimetic whisker sensors (right)
with respect to an allocentric reference frame (e.g. [9], [10]). Such a systems level description of hippocampal function has been directly compared to navigation algorithms developed for mobile robotic platforms in the past[11], [12], [13], [14], [15] and is particularly relevant when addressing the problem of SLAM[16]. The evidence that whisker-touch stimuli is associated with memory of spatial location is a biological observation that invites further investigation into the role that active tactile sensing could provide to mobile robotics. Here, we build upon our previous work demonstrating the principles of whisker based tactile Simultaneous Localisation and Mapping, or tSLAM[17]. This article summarises new results integrating this system with a multi-degree of freedom mobile robotic platform, a tactile sensory attention model of action selection to guide exploration, and an array of active (i.e. motile) biomimetic whiskers. II. METHOD A. Robot hardware R Shrewbot consists of a omni-drive Robotino (www.festodidactic.com) ‘body’, an Elumotion (www.elumotion.com) 3 DoF ‘neck’ and a custom built end-effector, referred to as the ‘head’ (see photographs in Figure 1). The head was built around 3 disks of decreasing radii (60, 40 & 20mm) mounted at 20mm spacings along a 120mm long central column. Around the periphery of each disk are 6 mounts each holding a whisker module. Briefly, a whisker module consists of an instrumented composite whisker assembly mounted onto the shaft of a brushless dc motor and gearbox (see[18] for more detail). The motor allows ±50◦ of rotation around the whisker resting angle to emulate the active touch ‘whisking’ behaviour observed in mammals[19], one of the functional advantages of which is to increase the spatial coverage of the tactile array[3]. The most forward mounted whiskers were 60mm long, whilst those on the middle and rearward measured 115 & 160mm respectively. Each whisker module
has an embedded micro-controller for marshalling sensory data and updating the closed loop position control of the whisker angle. Desired angular positions of the whisker (as set by rotations of the motor shaft) are relayed to the microcontroller via an SPI bus which returns the sensory state of the whisker (2-dimensional deflections of the whisker shaft measured at the base wx , wy , and actual whisker angle wθ ). The SPI buses to all whisker modules (18 in total) are connected to the FPGA based bridge electronics which, in turn, is connected (via USB) to a MiniITX PC mounted on Shrewbot’s body. Therefore, the nth sample of whisker sensory information from the entire array is denoted as: →1 , − →2 , . . . , − − → Wn = {− w w w−→ 18 }n , where wi refers to the whisker sensory state (wx , wy , wθ ) of whisker i. Communication between the on-board PC and the position controllers for each actuator of the neck is also implemented via USB, whilst the motor drives of the Robotino are controlled across Ethernet. B. Robot behaviour The whisker sensory information, Wn , is geometrically transformed into a 3-dimensional array representing an egocentric map of the volume surrounding the head of Shrewbot. Whereby, when a whisker makes contact with an obstruction in the environment the resulting increase in ||wx , wy || results in a corresponding increase in the ‘tactile salience’ of that point in ego-centric space. Using a winner-takes-all arbitration mechanism across the map reveals the current most salient point, and it is here that the nose of the head of the robot (which we call the fovea) is directed. The arbitration mechanism is synchronised with the whisk rate of the robot (the rate at which the whiskers are moved back and forth), such that the target for foveation is selected at the end of each whisk. The ego-centric target is transformed through a forward model of the robot kinematics and a motor-recruitment based trajectory planner into a sequence of head and body motor actions to bring the fovea to this point. The orient is also coordinated with the whisker motion such that the whiskers will be in mid-protraction at the end of the head placement. When coupled with a non-uniform noise distribution across the saliency map and a simple inhibitionof-return mechanism, this iterative series of orients results in the emergence of more complex behaviour patterns such as exploration, wall following and novelty seeking [20]. This tactile attention model of action selection was used to control the robot during the data capture trials described below. C. Data collection Shrewbot was allowed to freely explore the arena (shown in Figure 1) through a series of short bouts of two or three minutes length. Separation into bouts allowed hardware maintenance when necessary and eased the management of the large time series that were collected. When a bout is started, the neck ‘un-parks’, and the whiskers are autocalibrated. Occasionally, the robot halted in a position such that some whiskers would be in contact with a surface after un-parking, which would have interfered with calibration;
on these occasions, the robot was moved a small amount before being restarted to avoid this interference. Post-hoc, these datasets were deleted or trimmed so that time periods including incorrect hardware operation (such as whisker sensor failure) were eliminated. The remaining trimmed bouts were then stitched together to form the dataset used here, which represents approximately 62 minutes of exploration, or NW = 2857 whisks (samples). In addition to the odometry and whisker sensory data logged on the robot, video footage was also recorded from a camera located 3 metres above the centre of the arena. This was also processed post-hoc to extract the ground truth pose of the robot used to qualify the performance of our localisation and mapping algorithm. A time lapsed sequence of such footage is presented in the supplementary video associated with this article. D. Robot movement estimates The robot pose was defined as the location and orientation of the head projected onto the 2D plane, and is denoted Ψn = [xn , yn , φn ]T , where φn = 0 indicates that the robot head is pointing in the same direction as the +ve y-axis, with x and y being the coordinates of the world frame (and superscript T the transpose operator). The change in this pose between whisks (samples) is denoted ∆Ψn = [∆un , ∆vn , ∆φn ]T , where u and v are the coordinates of the robot head frame, wherein the robot head always points along the +ve v-axis. Then, these two series are related by Ψn = Ψn−1 ⊕ ∆Ψn , where ⊕ is the motion composition operator as defined by [21]. Two estimates of ∆Ψn were measured. The first, denoted ∆ΨGT n (noiseless ground truth) was recovered from the overhead camera tracking the robot1 . 0 The second, denoted ∆ΨOD was recovered from the robot n odometry. The initial position of the robot was recovered from the camera, and is denoted ΨGT 1 . E. Odometry model 0
The odometry estimate recovered from the robot, ∆ΨOD n , was systematically in error in comparison with the true movements of the robot measured by the overhead camera. Therefore, we used simple linear regression (least squares) to fit a linear/Gaussian model between the odometry and ground 0 OD OD truth, given by ∆ΨGT ∆ΨOD +ΓOD is n =G n n , where G a diagonal gain matrix with on-diagonal terms gu , gv and gφ , and ΓOD ∼ [N (0, σu ), N (0, σv ), N (0, σφ )]T is a Gaussian n vector process. Thus, each channel (x, y and φ) has an associated gain and standard deviation. The ‘corrected odometry’ 0 estimate is then defined as ∆ΨOD = GOD ∆ΨOD n n , and has the noise statistic ΓOD . The values of the noise parameters correspond to 9%, 7% and 4% noise on the three channels, respectively. Finally, we define an estimate of ∆Ψn with an adjustable noise magnitude as OD GT ∆ΨIN n = λ∆Ψn + (1 − λ)∆Ψn
(1)
1 This estimate is, in fact, not noiseless but, since the noise includes no integral drift and is in any case small compared with the drift present in the odometry, we treat it as noiseless.
where λ is a value between 0 and 1. It is this estimate, and its associated noise statistic [λσu , λσv , λσφ ], that is used as the input to the particle filter based localisation algorithm. F. Localisation algorithm We used a standard particle filter approach to represent the posterior probability of pose within a 2-D grid based occupancy map as described in [17] and in more detail in [22]. The filter consists of a population of NP particles, each maintaining a current estimate of pose of the robot ˆ Pi , i ∈ (1, NP ) within a local map M Pi . A map head Ψ n n represents 4m2 of space, with each cell representing 12.5mm x 12.5mm, i.e., 102400 cells per map2 . The state of the particle filter was updated at the end of each whisk period, i.e., at approximately 1 second intervals, with the change in odometry ∆ΨIN n (derived from Eqn. 1) and the odometry noise statistic used to update the estimate of pose in each particle. A summary of sensory information from the whisker array gathered during the whisk was used to update each map and to determine the likelihood of each particle. The sensory information taken from the whisker array consists of a discrete representation of the space through which each whisker had travelled during the whisk, projected onto the 2-D plane. If no contact was made by a particular whisker during that whisk then all 10 points representing that whisk arc will be cast onto each map as regions with a lower likelihood of occupancy. If a contact did occur during that whisk then the location of the tip of the whisker at the point of contact will be fused into each map with an increased likelihood of occupancy (placement of a simple Gaussian shaped ‘blob’, similar to description in[17]). A grid cell in each M Pi represents the probability of a contact being sensed if a whisker tip were located at that cell. Thus, the state of each map encodes sensor noise as well as the geometry of the world. Consequently, as the robot explores the environment each particle will develop a map that can be used to determine the likelihood of its current estimate of 1 Pi Pi ˆ Pi i pose, i.e., ΛP n → Z P (M |Ψn ). Λn being the likelihood of the current pose estimate of particle i, based upon the probability of occupancy within the local map, given that it represents a history of all sensory observations including the most recent from the whisker array ( Z1 is a normalising function). For computational efficiency we adopted the lowvariance re-sampling strategy as described in [22]. Ultimately the output from the filter is the pose estimate from the particle that currently has the highest posterior, which we IN denote ΨPF = P (ΨGT n 1 , {∆Ψj , Wn : j ∈ [2, n]}), where P (.) represents the particle filter and Wn is the nth sample of (whisker) sensory data. G. Performance analysis Even where learned maps were apparently of high quality (reflected against ground truth), an unpredictable transform between these maps and the geometry of the world was a clear feature of our results. This makes direct quantitative 2 Note that all maps presented herein show only the central 3.2m square region, since the arena itself has a radius of only 1.5m.
comparison between the absolute pose estimates ΨGT , ΨIN and ΨPF impossible, a problem which has been highlighted recently for SLAM in general [23]. K¨ummerle et al. outlined an approach to comparison between estimates by focusing on changes in each pose estimate, rather than the estimates themselves, noting that the choice of changes to compare must be problem-specific. They described their methodology for manual identification of particular pose estimates; owing to our large trials (thousands of realisations) we could not use a manual approach. Instead, we developed two automatic approaches to performance analysis, as follows, both of which gave similar results. Pose change analysis: We analysed change in pose location according to each estimate over a range of intervals. Pose change for an estimate X at an interval of Tζ is defined as X X ∆ 0 ΨX n (Tζ ) = Ψn+L Ψn , where is the inverse of ⊕ and L = Tζ /T , with T the average sample period across the dataset. The pose change performance metric is then defined as follows, X ζ(Tζ ) = qnPF (Tζ )/qnIN (Tζ ) (2) n∈[1,NW −L]
qnX (Tζ )
0 GT = Q ∆ 0 ΨX n (Tζ ) − ∆ Ψn (Tζ )
�
(3)
where Q(∆0 Ψn ) = |xn , yn | is the operation that measures the magnitude of the location vector in a pose difference, ∆0 Ψn . Thus, ζ(Tζ ) is a measure of the error in the pose change estimate due to the particle filter as a fraction of that due to the odometry, over an interval of Tζ . Where performance is good, this metric is expected to decrease as Tζ increases and odometry drift increases correspondingly. Absolute pose analysis: The second approach is to attempt to identify the transform between the learned map and the ground truth geometry. We cannot, in general, use correlation between the maps to this end, since some of the learned maps are incomplete. Instead, we identify the rotation/translation H PF (.) that minimizes the mean square error between ∗ GT = H PF (ΨPF ΨPF n ) and Ψn , for n ∈ [1, NW ]. Since this n process will (undesirably for this analysis) reduce the impact of any integral drift, as well, we choose a similar transform ∗ for the odometry estimate, to generate ΨIN = H IN (ΨIN n n ). We can then directly compare these transformed estimates as follows, � ∗ � ∗ X GT eX = Q Ψ − Ψ (4) n n n � � ∗ ∗ E X = median {eX (5) n : n ∈ [1, NW ]} ∗
∗
IN ωn = ePF n /en ∗
(6)
∗
Ω = E PF /E IN
X∗ n
(7) ∗
with Q(.) defined as above. That is, e /E X are measures of absolute position error in the estimate X∗ (at sample n, or over the whole dataset), whilst ωn /Ω are measures of position error due to tSLAM as a fraction of that due to the odometry (per sample, per dataset). Since integral drift is expected to be large in the estimate ΨIN n , these metrics will tend to be biased against tSLAM when it performs
Fig. 2. Localisation only. (Top Left) Filtering improves performance (as measured through ζ) at measurement intervals (Tζ ) longer than about one minute, with much of the benefit measurable at an interval of around 30 minutes. (Bottom Left) Improvement due to filtering, as measured by ζ (Tζ = 30mins.), increases as noise level, λ, rises. Mean (solid) and minimum (dashed) over 10 realisations. (Top Middle) Absolute error before (E IN , dashed) and after (E PF , solid) particle filtering, mean over 10 realisations. (Bottom Middle) Improvement due to filtering, as measured by Ω, increases as noise level, λ, rises. Mean (solid) and minimum (dashed) over 10 realisations. (Large panel, Right) The ground truth map, with example pose estimates for λ = 1.0 overlaid (example shown is that realisation returning median Ω). The contact probability for each map cell is shown from white to dark grey. PF IN Ground truth geometry is shown by dashed black lines. Location part of pose estimates ΨGT n , Ψn , and Ψn are shown, respectively, in black, red and blue, for the first and last 100 samples of NW = 2857 in all. At the starting point (square) all three estimates agree (ΨGT = ΨPF = ΨIN 1 1 1 ). Near the end PF (black and red) are in close agreement, but ΨIN (blue) is quite different (n = N (triangles) ΨGT and Ψ − 100). W n n n
well. However, identifying these transforms allows us to plot all pose estimates, and the map itself, in register, which is convenient to our presentation. III. RESULTS
Fig. 3. Mapping only. As Figure 2, but map is that due to particle with maximum posterior after all samples have been presented, and only one pose trace is shown since all three estimates (PF, IN and GT) are identical.
A. Localisation Initially we assume a map that reflects the true layout of the arena during the experiment, disable mapping, and focus on localisation only. As described above, the value at each cell of the map represents the probability that a whisker tip located here at peak protraction will report a contact. Thus, in building a ‘ground truth’ map for this analysis, it is necessary to represent the uncertainty in whisker tip location, so the objects in the map have ‘feathered’ rather than sharp edges. The map resolution we chose of 320 cells per edge was more than sufficient for this simple arena; the width of the feathering (±50mm) was chosen manually and approximately to maximize performance on the localisation task. Localisation performance over 10 realisations, as well as the map used and location traces from one example realisation, are shown in Figure 2. The summary result is that the system is successful in maintaining tracking in all 100 trials, with the median localisation error at the output ∗ of the particle filter, E PF , rising only slowly (15mm to 37mm) as the input noise level (λ) is increased, whilst the ∗ mean localisation error at its input, E IN , rises from 170mm to 1260mm. Both summary error metrics, ζ and Ω, similarly reflect the benefit resulting from filtering. B. Mapping Setting λ = 0 we can observe the generation of the map using the ground truth estimate of robot movement. An example map produced is shown in Figure 3: surfaces are
Fig. 4. SLAM localisation. (Curves, left) Error metrics Ω and ζ (Tζ = 30mins.) against number of particles, NP , or noise level, λ. Each curve is minimum (chained), median (solid) or maximum (dashed) over 100 realisations. When plotted against NP (λ), curve shown is mean over λ (NP ). (Histograms, right) Each panel shows the distribution of relative final PF location error (in the last sample), ωNW , for NP = 468 and a value of λ as annotated. (All) Unity is marked on all plots as thick grey line: values of all three error metrics below unity indicate an improvement due to filtering.
mostly well represented, but sharp concave corners have not been explored (the robots movement strategy means that it does not generally explore into these). Observation of such maps was used to inform the values chosen for some of the model parameters; specifically, the radius of the Gaussian shaped ‘blobs’ used to populate the map rBLOB = 25mm, and the number of such blobs to fuse into the map in the event of a positive contact nBLOB = 4.
C. Parameter search The particle filter model (see Methods) has a number of parameters that are unknown and cannot be derived easily from the available data. Some of these (see above) were set manually informed by observation of the localisationonly and mapping-only conditions, reducing the parameter space substantially. Nonetheless, the parameter space remains large, so we used a Monte Carlo grid-based approach to find appropriate values for some further parameters when performing tSLAM. We varied NP (between 100 and 1000), and the prior probability of occupancy across the maps pPRIOR (between 0.025 and 0.1), across five different noise levels (λ ∈ [0.1, 0.5]) and five realisations. We reviewed the results to find the parameter point at each of the noise levels that gave the minimum-mean and minimum-maximum Ω over the five realisations (ten parameter points in total). These parameter points were not all the same, but we found that larger NP was helpful, at least up to about 300, and that pPRIOR = 0.1 was common in 7 of 10 cases. Hence, we chose the single parameter point given by pPRIOR = 0.1 at which to perform further analysis, and restricted the particle count to a few hundred.
D. Tracking performance We tested the performance of the tSLAM implementation in toto using the parameters determined above, varying only NP ∈ [32, 468] and λ ∈ [0.1, 1], with 100 realisations at each parameter point. The results are summarised in Figure 4. Across all noise levels and all values of NP , the minimum (across realisations) value of both error metrics (Ω and ζ, curves in Figure) was similar and varied little, at around 0.2, whilst the maximum value of both was substantially over unity, indicating that filtering probably degraded the location estimate in some realisations. Increasing the number of particles tended to reduce the median and maximum of the error metrics, as expected, with these relationships apparently beginning to asymptote in the upper end of the tested range of NP . None of the curves indicate that the highest noise level tested (raw odometry from the robot) was high enough to render this approach to filtering impossible. Measures of relative estimate improvement due to filtering at the end of the hour (ωNW , histograms in Figure) told a similar story: the noise level λ had no discernible impact on this error metric. Histogram analysis of ζ (not shown) showed essentially the same picture: 98 of 100 trials at λ = 1.0 showed an improvement in localisation (ζ < 1, Tζ = 30min) due to filtering. Figure 5 displays examples of the maps that were learned at different noise levels; without reviewing all 100 maps for each case, these examples suggest the following. At a low noise level (λ = 0.2), all realisations produced useful maps (maps that appear to be moving towards a representation of the known geometry). At a medium noise level (λ = 0.5), most—if not all—realisations produced useful maps; it is not clear whether the maps in some realisations (such as the ‘worst’ one presented in the Figure) would be stable in
of possible tracking failures (ωNW > 1.0) did not appear to increase with the noise level, λ, suggesting that any tracking failures that did occur may have been due to imprecision of our physical model rather than to a level of noise too high for the system to bootstrap.
Fig. 5. tSLAM example maps. Each panel shows the final map produced by tSLAM after all NW samples have been filtered, with NP = 468. Top/middle/bottom is for λ = 0.2, λ = 0.5 and λ = 0.8, respectively. Left/middle/right is from the realisation at each of those parameter points that scored the lowest, median and highest value of Ω. All maps have been transformed through H PF (.), for ease of comparison (see Methods).
the long-term. In the high noise case (λ = 0.8), it appears that in some realisations, at least, the map is not showing signs of converging on truth after one hour. In summary, at all noise levels, the expected outcome of using the system is a coherent map and thus, presumably, an improvement in location estimate, but the reliability of this outcome appears to suffer increasingly (as expected) as λ increases. The time lapsed graphical reconstruction of map development shown in the supplementary video to this article was generated using the medium noise level, i.e., λ = 0.5. IV. DISCUSSION A. Quantification Given the relatively short data set, meaningful quantification of performance was challenging, as previously noted [23]. Since our implementation generally resulted in improved location estimates, our main error metric, Ω, is likely to be biased against tSLAM (see Methods), though an alternative error metric following the methodology of [23] generated a consistent analysis. Nonetheless, our quantitative results must be treated cautiously. Our main result is qualitative: it was possible to maintain tracking in the majority of cases. The degree of possible improvement in location estimates depends more on the nature of the problem than the characteristics of tSLAM. The current (one hour) dataset was about sufficient for one reasonably thorough exploration of this small arena (the robots exploratory behaviour is unhurried), so that we would expect quantitative benefits to be realised increasingly over longer time periods. One particular characteristic of our results was that the proportion
B. Characteristics of tSLAM A marked characteristic of our results was a small fixed error term (around Ω = 0.2, ζ = 0.2) that was not eliminated at any noise level nor in any realisation (Figure 4). This is characteristic of tSLAM (at least, as described) in that there may be regions of the map wherein the senses provide no information for localisation and odometry must be relied upon exclusively, for a time. An example would be a region of featureless floor. Such regions of ‘sensory deprivation’ need not exist in implementations based on vision or rangefinding. We expect that it is this characteristic that is reflected in the lack of any examples below a threshold from 8,000 realisations contributing to Figure 4. It is worth noting, then, that the size of such regions, along with the time spent in them and the uncertainty in the odometry, probably constitutes a key limiting factor of a tSLAM implementation such as that presented. It seems likely that, in a majority of applications, large time periods of sensory deprivation could be engineered away by behavioural control. For instance, in a novel environment, actively employing a behavioural strategy such as wall-following until a sufficiently developed map is available might tend to reduce the incidence of erroneous correspondences between locations. Rats exploring novel environments do express thigmotaxis [24], as do blindfolded humans [25], interestingly, rats also make repeated returns to a home-base whilst gradually increasing the length of excursions which could play a significant role in correcting path integration errors[26]. C. Computational requirements The computation times of this localisation solution are reasonable. With NP = 100 (NP = 400) the implementation described computes at 40ms (160ms) per cycle on a single domestic processor (2.4GHz). Using a more efficient resampling algorithm (not reported, but returns similar results) gave times of 14ms (55ms). These values compare well with the approximately one second between whisks in the robot, easily allowing online use with these parameters and off-the-shelf hardware. Since the computations are local to the robot’s location, larger grid-based maps would not be expected to impact either processing time or memory bus load. Larger maps would probably benefit from storage optimisation (such as sharing of common data between particles), however, doubling the map extent to cover 8m by 8m at NP = 100 gives an unoptimised memory footprint approaching 160MB. Since the short-term error uncorrected by using tSLAM is larger than the 12.5mm map cell we used, the map resolution could also probably be reduced. V. CONCLUSION AND FUTURE WORK In our previous work we introduced a framework for whisker based tactile SLAM using a simple differential drive
robot and 6 static whiskers in a 1.5m square arena[17]. Here we have extended that work in three ways; Firstly, demonstrating the principle on a mobile robot that has many more degrees of freedom, including an 18 whisker array mounted as the end-effector of a 3 DoF ‘neck’ that it can be positioned within a 3D peri-personal workspace which, in turn, is mounted on an omni-drive mobile platform. Secondly, the whiskers are individually actuated to maximise the coverage of sensory exploration; Thirdly, we have shown, using a more comprehensive statistical analysis, that the tSLAM algorithm can provide a useful improvement in localisation performance even over a relatively short dataset. When a ground truth map estimate was provided, localisation provided very useful improvements in location estimate (and 100% reliability over 100 trials). When such a map was not provided (full tSLAM), an improvement in localisation was evident across realisations in reduced location error both over the course of one hour and at the end of one hour, versus the estimate due to the raw odometry. Furthermore, a large majority of realisations produced maps that reflected the geometry of the arena and in an improved location estimate over using odometry alone; accurate maps were, naturally, more common at lower odometry noise levels. One obvious avenue for further investigation will be to scale up the problem, moving towards quantities appropriate for practical deployment, with larger maps and datasets taken over longer periods of time. Some parameters of the solution, such as map resolution and particle count, may be approximately sufficient as reported. This scaling-up will facilitate the exploration of the practicalities of the representation of usefully-sized regions in tactile maps. A second direction for extension will be to represent more than just occupancy or probability of contact, moving towards the use of feature labels such as texture or shape, as well as pre-assigned landmarks [27]. Moving in both of these directions will pave the way for a practical test of tSLAM as a navigation solution in a realistic environment where electromagneticbased SLAM systems are unreliable, such as in smoke-filled buildings. R EFERENCES [1] S. Vincent, “The function of vibrissae in the behaviour of the white rat,” Behavioural monograph, vol. 1, pp. 1–81, 1912. [2] B. Mitchinson, R. Grant, K. Arkley, V. Rankov, I. Perkon, and T. Prescott, “Active vibrissal sensing in rodents and marsupials,” Phil. Trans. R. Soc. B, vol. 366, pp. 3037–3048, 2011. [3] M. J. Pearson, B. Mitchinson, J. Sullivan, A. Pipe, and T. Prescott, “Biomimetic vibrissal sensing for robots,” Phil. Trans. R. Soc. B, vol. 366, pp. 3085–3096, 2011. [4] P. Itskov, E. Vinnik, and M. Diamond, “Hippocampal representation of touch-guided behavior in rats: Persistent and independent traces of stimulus and reward location,” PLoS ONE, vol. 6, no. 1, January 2011. [5] E. Kandel, I. Kupfermann, and S. Iversen, Principals of neuroscience, 4th ed. McGraw-Hill, 2000, ch. Learning and memory, pp. 1227– 1246.
[6] R. Morris, “Spatial localization does not require the presence of local cues,” Learning and Motivation, vol. 12, no. 2, pp. 239–260, 1981. [7] J. O’Keefe, “Place units in the hippocampus of the freely moving rat,” Exp. Neurol., vol. 51, no. 2, pp. 78–109, 1976. [8] T. Hafting, M. Fyhnand S. Molden, M. Moser, and E. Moser, “Microstructure of a spatial map in the entorhinal cortex,” Nature, vol. 436, no. 11, pp. 801–806, 2005. [9] J. Knierim, H. Kudrimoti, and B. McNaughton, “Place cells, head direction cells, and the learning of landmark stability,” The Journal of Neuroscience, vol. 15, no. 3, pp. 1648–1659, 1995. [10] D. Touretzky and A. Redish, “Theory of rodent navigation based on interacting representations of space,” Hippocampus, vol. 6, pp. 247– 270, 1996. [11] C. Fox and T. Prescott, “Learning in a unitary coherent hippocampus,” in Artificial Neural Networks ICANN 2010, ser. Lecture Notes in Computer Science. Springer Berlin / Heidelberg, 2010, vol. 6352, pp. 388–394. [12] T. Str¨osslin, D. Sheynikhovich, R. Chavarriaga, and W. Gerstner, “Robust self-localisation and navigation based on hippocampal place cells,” Neural Networks, vol. 18, pp. 1125–1140, 2005. [13] V. Hafner, “Cognitive maps in rats and robots,” Adaptive Behavior, vol. 13, no. 2, pp. 87–96, 2005. [14] M. Milford, G. Wyeth, and D. Prasser, “RatSLAM : a hippocampal model for simultaneous localization and mapping,” in International Conference on Robotics and Automation. IEEE, 2004, pp. 403–408. [15] M. Mataric, “Navigating with a rat brain: A neurobiologically-inspired model for robot spatial representation,” in Animals to animats: Simulation of Adaptive Behavior, 1990, pp. 169–175. [16] J. Leonard and H. Durrant-whyte, “Simultaneous map building and localization for an autonomous mobile robot,” in Intelligent Robots and Systems. IEEE/RSJ, 1991, pp. 1442–1447. [17] C. Fox, M. Evans, M. Pearson, and T. Prescott, “Tactile SLAM with a biomimetic whiskered robot,” in International Conference on Robotics and Automation. IEEE, 2012, pp. 4925–4930. [18] J. Sullivan, B. Mitchinson, M. Pearson, M. Evans, N. Lepora, C. Fox, C. Melhuish, and T. Prescott, “Tactile discrimination using active whisker sensors,” IEEE Sensors, vol. 12, no. 2, pp. 350–362, 2012. [19] P. Gao, R. Bermejo, and H. P. Zeigler, “Whisker deafferentation and rodent whisking patterns: Behavioral evidence for a central pattern generator.” J Neurosci, vol. 21, no. 14, pp. 5374–5380, 2001. [20] B. Mitchinson, M. Pearson, A. Pipe, and T. Prescott, “The emergence of action sequences from spatial attention: Insight from rodent-like robots,” in Biomimetic and Biohybrid Systems, ser. Lecture Notes in Computer Science. Springer Berlin / Heidelberg, 2012, vol. 7375, pp. 168–179. [21] F. Lu and E. Milios, “Globally consistent range scan alignment for environment mapping,” Autonomous Robots, vol. 4, no. 4, pp. 333– 349, 1997. [22] S. Thrun, W. Burgard, and D. Fox, Probabilistic robotics. MIT Press, 2006. [23] R. K¨ummerle, B. Steder, C. Dornhege, M. Ruhnke, G. Grisetti, C. Stachniss, and A. Kleiner, “On measuring the accuracy of slam algorithms,” Autonomous Robots, vol. 27, no. 4, pp. 387–407, 2009. [24] S. Barnett, The rat: A study in behaviour. Aldine, 2007. [25] O. Yaski, J. Portugali, and D. Eilam, “The dynamic process of cognitive mapping in the absence of visual cues: human data compared with animal studies,” J. Experimental Biology, vol. 212, no. 16, pp. 2619–2626, 2009. [26] O. Tchernichovski, Y. Benjamini, and I. Golani, “The dynamics of long-term exploration in the rat. part I: A phase-plane analysis of the relationship between location and velocity,” Biol. Cybern., vol. 78, no. 6, pp. 423–432, 1998. [27] C. Fox, M. Evans, M. Pearson, and T. Prescott, “Towards hierarchical blackboard mapping on a whiskered robot,” Robotics and Autonomous Systems, vol. 60, no. 11, pp. 1356–1366, 2012.