2.2.2 Structure of the Kalman filter . . . . . . . . . . . . . . . . . . . . . 14 ... 2.5.2 About landmark parametrisation . ..... laser range finder and evolving in a plane. ..... The sequel of the initialisation step consists in choosing the Gaussian which best approxi-.
Thèse préparée au
Laboratoire d’Analyse et d’Architecture des Systèmes du CNRS en vue de l’obtention du
Doctorat de l’Ecole Nationale Supérieure de l’Aéronautique et de l’Espace Spécialité : Informatique par
Thomas Lemaire
Simultaneous Localisation And Mapping with Monocular Vision Localisation et Cartographie Simultanées avec Vision Monoculaire
Soutenue le 20 décembre 2006 devant le jury composé de : Juan Domingo Tardòs Roland Chapuis Raja Chatila Guy Le Besnerais Delphine Dufourd Francis Martinez Manuel Samuelides Simon Lacroix
LAAS-CNRS 7, Avenue du Colonel Roche 31077 Toulouse Cedex 4
Rapporteur Rapporteur Examinateur Examinateur Examinatrice Examinateur Examinateur Directeur de thèse
Contents 1 Introduction 1.1 Context . . . . . . . . . . . . . . 1.2 Background: SLAM in a nutshell 1.2.1 Problem statement . . . . 1.2.2 Main difficulties . . . . . . 1.2.3 Main solutions . . . . . . 1.3 SLAM with vision . . . . . . . . .
. . . . . .
. . . . . .
. . . . . .
. . . . . .
. . . . . .
. . . . . .
. . . . . .
. . . . . .
. . . . . .
. . . . . .
. . . . . .
. . . . . .
. . . . . .
. . . . . .
. . . . . .
. . . . . .
. . . . . .
. . . . . .
2 boSLAM algorithm 2.1 Related work . . . . . . . . . . . . . . . . . . . . . . . . . . . . . 2.2 Multi-hypotheses initialisation . . . . . . . . . . . . . . . . . . . . 2.2.1 Principle of the approach . . . . . . . . . . . . . . . . . . . 2.2.2 Structure of the Kalman filter . . . . . . . . . . . . . . . . 2.2.3 Feature initialisation . . . . . . . . . . . . . . . . . . . . . 2.2.4 Initial state update . . . . . . . . . . . . . . . . . . . . . . 2.2.5 Map augmentation . . . . . . . . . . . . . . . . . . . . . . 2.3 Parameters definition and evaluations in simulation . . . . . . . . 2.3.1 Simulation environment . . . . . . . . . . . . . . . . . . . 2.3.2 Initial PDF . . . . . . . . . . . . . . . . . . . . . . . . . . 2.3.3 Influence of k . . . . . . . . . . . . . . . . . . . . . . . . . 2.3.4 Comparison with fully observable SLAM . . . . . . . . . . 2.4 Algorithm refinements . . . . . . . . . . . . . . . . . . . . . . . . 2.4.1 Past poses management . . . . . . . . . . . . . . . . . . . 2.4.2 Hypotheses degeneration . . . . . . . . . . . . . . . . . . . 2.4.3 Landmarks at infinity . . . . . . . . . . . . . . . . . . . . . 2.5 Discussion . . . . . . . . . . . . . . . . . . . . . . . . . . . . . . . 2.5.1 Complete list of parameters . . . . . . . . . . . . . . . . . 2.5.2 About landmark parametrisation . . . . . . . . . . . . . . 2.5.3 Bearings-Only SLAM using Inverse Depth parametrisation 2.6 Conclusion . . . . . . . . . . . . . . . . . . . . . . . . . . . . . . .
. . . . . .
. . . . . . . . . . . . . . . . . . . . .
. . . . . .
. . . . . . . . . . . . . . . . . . . . .
. . . . . .
. . . . . . . . . . . . . . . . . . . . .
. . . . . .
. . . . . . . . . . . . . . . . . . . . .
. . . . . .
1 1 2 2 4 5 9
. . . . . . . . . . . . . . . . . . . . .
11 11 13 13 14 15 17 19 20 20 21 22 22 25 25 26 29 31 31 31 32 34 iii
Contents 3 Results on real data 3.1 Introduction . . . . . . . . . . . . . . . . . . . . . . . . 3.2 SLAM for a rover equipped with a perspective camera 3.2.1 Camera model . . . . . . . . . . . . . . . . . . . 3.2.2 Perception: corner point features . . . . . . . . 3.2.3 Ego-motion estimation . . . . . . . . . . . . . . 3.2.4 Features selection and map management . . . . 3.2.5 Loop closing. . . . . . . . . . . . . . . . . . . . 3.3 Results with a perspective camera . . . . . . . . . . . . 3.3.1 On a small trajectory . . . . . . . . . . . . . . . 3.3.2 On a longer trajectory . . . . . . . . . . . . . . 3.4 Vision-based SLAM using a panoramic camera . . . . . 3.4.1 Panoramic camera model . . . . . . . . . . . . . 3.4.2 Ego-motion estimation . . . . . . . . . . . . . . 3.4.3 Loop closing . . . . . . . . . . . . . . . . . . . . 3.4.4 Calibration . . . . . . . . . . . . . . . . . . . . 3.5 Results with a panoramic camera . . . . . . . . . . . . 3.5.1 On a small loop . . . . . . . . . . . . . . . . . . 3.5.2 On a longer trajectory . . . . . . . . . . . . . . 3.6 Results with aerial images . . . . . . . . . . . . . . . . 3.6.1 Building a sparse digital elevation map . . . . . 3.6.2 Closing the loop . . . . . . . . . . . . . . . . . . 3.7 Discussion and conclusion . . . . . . . . . . . . . . . .
. . . . . . . . . . . . . . . . . . . . . .
. . . . . . . . . . . . . . . . . . . . . .
. . . . . . . . . . . . . . . . . . . . . .
. . . . . . . . . . . . . . . . . . . . . .
. . . . . . . . . . . . . . . . . . . . . .
. . . . . . . . . . . . . . . . . . . . . .
. . . . . . . . . . . . . . . . . . . . . .
. . . . . . . . . . . . . . . . . . . . . .
. . . . . . . . . . . . . . . . . . . . . .
. . . . . . . . . . . . . . . . . . . . . .
. . . . . . . . . . . . . . . . . . . . . .
37 37 39 39 39 40 40 41 41 41 42 43 48 48 50 54 54 54 55 60 60 60 63
4 boSLAM with Segments 4.1 Introduction . . . . . . . . . . . . . . . 4.2 3D segments for SLAM . . . . . . . . . 4.2.1 3D line representation . . . . . 4.2.2 About segment extremities . . . 4.3 Line segment initialisation . . . . . . . 4.3.1 Gaussian hypotheses generation 4.4 Estimation process . . . . . . . . . . . 4.4.1 Innovation . . . . . . . . . . . . 4.4.2 Constraints . . . . . . . . . . . 4.5 Simulation tests . . . . . . . . . . . . . 4.5.1 Parameters definition . . . . . . 4.5.2 Consistency check . . . . . . . . 4.6 Experiments with real images . . . . . 4.6.1 Image segments matching . . . 4.6.2 Results . . . . . . . . . . . . . . 4.7 Discussion . . . . . . . . . . . . . . . . 4.8 Conclusion . . . . . . . . . . . . . . . .
. . . . . . . . . . . . . . . . .
. . . . . . . . . . . . . . . . .
. . . . . . . . . . . . . . . . .
. . . . . . . . . . . . . . . . .
. . . . . . . . . . . . . . . . .
. . . . . . . . . . . . . . . . .
. . . . . . . . . . . . . . . . .
. . . . . . . . . . . . . . . . .
. . . . . . . . . . . . . . . . .
. . . . . . . . . . . . . . . . .
. . . . . . . . . . . . . . . . .
65 65 66 66 68 69 69 73 73 74 75 76 77 78 78 78 80 82
iv
. . . . . . . . . . . . . . . . .
. . . . . . . . . . . . . . . . .
. . . . . . . . . . . . . . . . .
. . . . . . . . . . . . . . . . .
. . . . . . . . . . . . . . . . .
. . . . . . . . . . . . . . . . .
. . . . . . . . . . . . . . . . .
. . . . . . . . . . . . . . . . .
. . . . . . . . . . . . . . . . .
Contents 5 Conclusion 5.1 Contributions . . . . . . . . . . . . . . . . . . . . . . . . . . . . . . . . . . 5.2 Discussion . . . . . . . . . . . . . . . . . . . . . . . . . . . . . . . . . . . . 5.3 Future research . . . . . . . . . . . . . . . . . . . . . . . . . . . . . . . . .
83 83 83 84
A Jafar
91
B Visual Motion Estimator B.1 Problem statement and notation . . . . . . . . . . . . . . . . . . . . . . . . B.2 Least-squares minimisation . . . . . . . . . . . . . . . . . . . . . . . . . . . B.3 Uncertainties computation . . . . . . . . . . . . . . . . . . . . . . . . . . .
93 93 93 94
C Real-time implementation
95
D Plücker line representations D.1 3D line representation using euclidian Plücker parameters D.2 Applying transformation (R, t) . . . . . . . . . . . . . . . D.3 Projection through a pinhole camera model . . . . . . . . D.4 2D line representation . . . . . . . . . . . . . . . . . . .
97 97 97 98 99
Bibliography
. . . .
. . . .
. . . .
. . . .
. . . .
. . . .
. . . .
. . . .
. . . .
. . . .
101
v
vi
List of Notation vector are denoted using lower case x matrix are denoted using uppercase A matrix and vector definition (.) matrix and vector block definition [.] matrix and vector size (.)(n×m) or [.](n×m) transposed vector and matrix xt , At unit vector x scalar (or dot) product between x and y x · y or xy t cross product between x and y x∧y the quantity A in the frame F A/F PDF of the variable x p(x) The matrix [x]∧ is defined for the 3-vector x(3) such that [x]∧ y = x ∧ y. 0 −x3 x2 0 −x1 [x]∧ = x3 −x2 x1 0
vii
viii
Chapter 1 Introduction This chapter introduces the basics of the SLAM problem and motivates our work. The different processes which are involved in a SLAM algorithm are depicted. The main difficulties are underlined and the principal solutions found in the literature are presented. Our work is then outlined.
1.1
Context
A mobile robot is designed to carry out different tasks. Several kind of algorithms are typically required by such a system: localisation, trajectory control, wall following, face recognition, environment modelling. . . and many others depending on the actual mission. Localisation is one of the key blocks of such robotic systems, as many other functions depend on a reliable and accurate localisation of the robot. Localisation. The localisation problem can be stated as follow: given an a priori map of the environment, given that the robot is endowed with a relevant sensor so as to comprehend real elements of the map, and given the input commands that drive the robots, a localisation algorithm computes the robot pose in the map frame. A GPS is also a very popular device to localise a platform, even if it does not give the orientation. The GPS receiver processes signals received from several satellites (the observations) and computes its distance to these satellites. Using an ephemeris to compute the absolute positions of the satellite (this is the a priori map), it can compute an estimate of its position on Earth. In the real world, nothing is perfect: the true value of a variable v cannot be known. Mathematicians have developed the theory of probabilities in order to represent the uncertainty on the value of a variable. Rather than representing the knowledge on v with a single value, this knowledge is represented using a Probability Density Function (PDF) denoted p(v). In the localisation problem the observations z, the input commands u, the map m, and the robot pose x are uncertain quantities. The problem, formulated using 1
1.2 Background: SLAM in a nutshell probabilities, is to compute p(xt |xt−1 , ut , zt , m) which reads “the PDF of the robot pose at time t, knowing its previous pose, the current command, the current observation, and the map”. This problem is usually solved with recursive Bayes filters. For instance, p(x) can be represented with a set of particles and updated with a particle filter. A good example of such methods can be found in [TFBD00]. Localisation And Mapping. In many applications a suitable map of the environment is not available. We are left with the command inputs u0:t and with the set of observations z0:t , which are useless without a map. Dead-reckoning 1 techniques such as odometry compute a pose estimate using only u0:t . They are integrative methods and accumulate errors over time: the growth of the pose estimate error is monotonic and unbounded. But observations z0:t can be used to build a map. The kind of map which is built here is dependant on the type of sensors mounted on the robot. The first goal of the map is to enable robot self localisation and its representation can be very different from the map which could be produced by an architect. It is usually a set of simple elements of the environment, the landmarks, which positions are measured by the sensors. Once the environment has been visited and mapped by the robot, if the robot continues to move in the same area it benefits from the map it has just built. Indeed, the landmarks are static states and the uncertainty of their position never increases. Therefore while it is evolving in the same area, the robot pose estimate error is bounded. There, localisation and mapping processes occur simultaneously. As a consequence the position estimate precision is highly dependant on the map errors, and similarly the map is sensitive to localisation errors. Both estimates are correlated and must be estimated jointly: p(xt , m|xt−1 , ut , zt ) In probabilistic terms, these correlations appears when the previous robot pose xt−1 is marginalised out. This problem has been put in light in the seminal work by [MC89, SC87]. Simultaneous Localisation And Mapping, SLAM for short, was born. . .
1.2 1.2.1
Background: SLAM in a nutshell Problem statement
A typical SLAM process, follows these steps to evolve from time (t−1) to time t (figure 1.1): (i) Prediction of the robot pose xt from the previous pose xt−1 and using the input command ut . 1
The etymology of this expression is explained in Wikipedia http://en.wikipedia.org/wiki/Dead_ reckoning
2
Chapter 1. Introduction
A
B
C
D
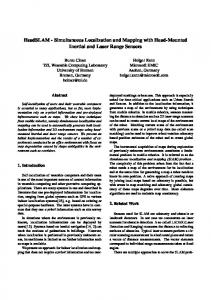
Figure 1.1: With the first observations, the robot builds a map of 3 points (A), then it moves and computes an estimate of its position (B), 3 new observations (blue) are matched with the current map (C), and are fused to update the map and robot pose (D). (ii) Perception of the environment at time t, and data processing so as to extract relevant features observations zt from raw sensor data. (iii) Data association matches the features with landmarks in the map. (iv) These observations are used to update the estimate of the robot pose and the map, new landmarks can be initialised. (i) Prediction. In this step, a dynamic model of the vehicle and proprioceptive data are used to predict the robot position. In the classic case, simple 2D odometry is used, but for more complex systems such as Uninhabited Aerial Vehicles, an Inertial Measurement Unit can for instance provide the prediction inputs [KS03]. (ii) Perception. At the origin of the perception process, there is a sensor which produces raw data. These data can be metric distances, angular measurements, illumination intensities. . . Two different approaches exist to make use of these data: • The raw data is used without any processing, and brute force algorithms such as ICP2 are used. • The raw data is processed in order to extract relevant features: this is landmark based SLAM. Note that a feature refers to an object in the observation space, and a landmark refers to its counterparts in the 3D map. A good feature has the following characteristics: – Salient, it is easily extracted from the raw data, – Precise, it can be accurately measured, 2
Iterative Closest Point
3
1.2 Background: SLAM in a nutshell – Invariant, it can be observed from different point of view, Moreover the reconstructed landmarks can be Meaningful. They may represent something relevant for the robot or the mission (obstacle, target,. . . ) so that the map can be used by higher-level algorithms such as reactive obstacle avoidance or path planning. But this is not the main goal of SLAM. (iii) Data association. It is the process that actually finds in the set of the perceived features the ones which correspond to landmarks previously memorised in the map. The most direct approach consists in computing the predicted or expected feature observations using the current estimates of the robot pose and the landmark. Then, for each observation, the χ2 test (see [BSL93]) is used to find the landmark which most likely produced this observation. The data association process can be divided in two different tasks: • Tracking: the feature is observed at time (t − 1) and also at time t, in this case the expected observation is close to the detected feature, and the view point has not changed too much: data association is easy. • Matching: the feature has not been observed for a long time: the view point may have dramatically changed and the feature could even not be detected, also the predicted observation can be very far from the true feature. In the general case, tracking and matching can be two different algorithms. (iv) Estimation / Optimisation. Any SLAM algorithm requires an estimation (or optimisation) framework in order to fuse the ego-motion data and the observations data. Robotics needs an incremental algorithm which can be implemented for real-time operation on an embedded computer. The estimation process described above is very close to the Bayesian filtering paradigm. Indeed, the first fusion technique which have been applied is the Extended Kalman Filter (EKF) [Kal60, BSL93]. Nice convergence properties of the KF based SLAM which have been theoretically proved in [DNDW+ 01], and an easy implementation have made this solution very popular. The Kalman filter manipulates Gaussian PDFs which usually represent quite well the noise of the real data: p(xt , m) is represented with its two first moments, its mean and its variance.
1.2.2
Main difficulties
A SLAM algorithm which would be computationally efficient and consistent is one Graal of the robotic community: SLAM must run on-line on a robot moving in a large environment. This is one prerequisite for building a truly autonomous mobile robot. 4
Chapter 1. Introduction Computational complexity. For any algorithm, one can categorise its space complexity and its time complexity with respect to the size of the problem. Here, the size of the problem is the number N of landmarks in the map. The well known EKF based SLAM is in O(N 2 ) in space and time. With the computers currently available, the time complexity limits this approach to a few hundreds of landmarks. Loop-closing and consistency. In the short-term, a benefit of SLAM is to reduce the drift in the pose estimate of any dead reckoning method, which accumulates errors. In the long-term, the most interesting feature of SLAM is certainly to eliminate this drift when the robot revisits a place already mapped: this is called a loop-closing. Loop-closing relies on two processes to be successful: data association and data fusion. Both processes are challenged by the loop-closing. The data association algorithm must solve the matching problem, which is harder than the tracking problem. When the matching is successful, the resultant observations usually induce a large correction on the robot position and all the landmark estimates because of the correlations between these states. This has to be correctly handled by the fusion method. If the loop is not closed correctly, the same walls mapped at the beginning and at the end of the loop are not aligned for instance, the map is then inconsistent. Consistency is also a concept of the stochastic estimation discipline: when the estimated value (mean and covariance in the case of a Kalman filter) is too far, in a probabilistic sense, from the true value, the estimate is said to be inconsistent. An inconsistent estimate can badly drive the matching process to do wrong data associations, and lead to dramatic divergence of the estimator. The consistency of the EKF based SLAM is well understood [CNT04, BNG+ 06]: it is mainly caused by errors in the robot heading estimate which induce large linearization errors.
1.2.3
Main solutions
There have been several conferences offering numerous SLAM sessions which have produced a high number of articles. The SLAM community is very active, and already three SLAM Summer Schools have been organised in Stockholm, 2002 [SSSa], in Toulouse, 2004 [SSSb] and in Oxford, 2006 [SSSc]. Also, at the time of writing of this thesis, two SLAM tutorials were published in [DWB06, BDW06]. The purpose of this section is not to give an extensive description of all these works, but rather a short overview of the different solutions to the problems that have been identified in the previous section. Estimation framework. The most popular approach is certainly the Kalman filter, several of its drawbacks have been mentioned just above. Other fusion systems have been proposed by the community. 5
1.2 Background: SLAM in a nutshell The classic Kalman filter has been modified so as to reduce its complexity: the postponement technique [KDR01] consists in delaying the update of a part of the state vector until it is necessary, only the observed states need to be up-to-date. The exact complexity of the algorithm is not stated but is less than the usual Kalman filter. The information filter is the dual of the Kalman filter, the information matrix being the inverse of the covariance matrix. From a theoretical point of view, both algorithms are equivalent. The Sparse Extended Information Filter (SEIF) presented in [TLK+ 04] takes advantage of the special structure of the SLAM problem to enforce sparsity on the information matrix, this approximation reduces the complexity down to O(N ). A particle filter have been used to implement the FastSLAM algorithm [MTW03], its computational complexity is O(M.log(N )), where M is the number of particles. The Probability Distribution Function of the robot pose is represented with a set of particles, each particle encodes a full trajectory of the robot and carries a full map. The map is composed of a list of landmarks, each landmark being estimated with a single low dimension Kalman filter. The strength of this technique lies on the fact that a particle represents a robot pose which is certain, hence the landmarks are not correlated together. Other works propose to use global optimisation tools. In [LM97], each pose of the robot trajectory is estimated. A graph representation of the problem is build: the poses are the vertex, an edge represents a constraint between two poses, these constraints are of two types. Weak constraints are the links between consecutive poses deduced from odometry readings. Strong constraints are the links between arbitrary poses obtained when processing sensor data. Then an energy function is defined: for each edge, this is the stochastic norm (or Mahalanobis distance) between the value of the constraint deduced ¯ and its covariance C from the current estimates of the two vertex D, and the value D given by the observation. Global optimisation methods can be applied to the problem of minimising the energy function of the graph: X ¯ i − Di )t C −1 (D ¯ i − Di ) (D i i
In [ESL05], the same weak and strong constraints are used to compute an estimate of the full trajectory of the robot, the delayed state, using an Information Filter which is exactly sparse. With these methods, the size of the problem to be solved continuously grows as the robot is moving, even if the robot stays in the same place. Also the processing of the raw observations so as to obtain the strong constraints is based on ICP with points acquired by a laser range finder, and is not easily extended to other sensors. Map structure. Previous techniques rely on alternative estimation frameworks adapted for SLAM. Here, the Kalman filter is generally used and the focus is put on techniques which make use of different representations of the stochastic information, in different frames. In [CMNT99] a SLAM framework based on the symmetries and perturbations map (SPMap) proposes a unified representation of any landmarks, and of observations from 6
Chapter 1. Introduction
Figure 1.2: Stochastic vectors stored in different map formats are symbolised with arrows. Left: usual global map. Centre: 3 sub-maps (blue, green, brown). Right: relative map. different sensors. This framework has been extended in [NLNT02] and very successful experiments are presented. An original approach called D-SLAM [WHD05] (D stands for Decoupled) divides the SLAM problem into two concurrent yet separated estimation problems: the estimation of the map (static) and the low-dimensional estimation of the robot pose (dynamic). This algorithm requires a non trivial processing of the measurements for the update of the map. The map is represented in the information space, and the information matrix is exactly sparse thanks to the decoupling: the complexity of the update of the map is thus O(1). As always when working in the information space, the estimate has to be recovered so as to compute the observation function Jacobian: this operation is O(N ). Also, the pose estimation step falls back on the Covariance Intersect [JU97] technique to fuse the robot pose estimate computed using the map and the current pose estimate – these estimates are correlated, but these correlations are unknown. An interesting set of algorithms use different frames to represent the robot pose and the landmarks (see figure 1.2). As the previous algorithms they tackle the computational complexity problem, and the consistency problem is also addressed. In the standard approach, a single global reference frame is used: in this frame the robot pose and the landmark estimates can have arbitrary large errors, which are likely to produce large linearization errors. The main idea here is to adopt a representation where these errors can be bounded. At the opposite of the monolithic absolute map approach, the relative map representation has been proposed in [New99]. Rather than estimating the global transformation of a landmark, relative transformations between neighbour landmarks are estimated. This raises the problems of choosing which relative transformations to put in the map, a problem of consistency for loops of landmarks, and also the problem of retrieving the global coordinates. These issues are addressed in [New99] with the development of the Geometric Projection Filter (GPF). In between the absolute map and the relative maps algorithms, there is the family of local maps, or sub-maps algorithms. The local maps are maintained using a simple 7
1.2 Background: SLAM in a nutshell estimation technique, for instance a Kalman filter. The local maps are controlled so as to maintain: • a bounded map update processing time: when the number of landmarks is too high, a new sub-map is created, • a bounded robot estimate error: when the uncertainty on the robot pose is too large, or when the robot has moved for a given amount of distance, a new sub-map is also created. The Constrained Local Sub-map Filter (CLSF) proposed in [WSH02] maintains a single global map but the robot builds a local map. Periodically the local map is fused into the global one, and a new local map is started. In [NL03], a set of overlapping sub-maps is maintained, common landmarks in the maps are used to estimate relationships between map roots. In the ATLAS framework [BNL+ 03], a graph of the transformations which link the local maps frame forms a topological layer, the local maps being the metric layer. A Dijkstra algorithm is used to compute the coordinate of a local map in the world reference frame. The Hierarchical SLAM approach [ENT05] also adopts this two layer representation, and adds an optimisation step to the upper layer which takes into account loop-closing information. Inshort, the computational complexity is reduced by approximately or exactly breaking correlations between the variables of the problem, and the consistency is achieved using more robust estimation techniques, possibly applying global optimisation methods. Data associations. There are two approaches to solve this problem: • make the estimation process robust to wrong matches, • or improve the reliability of the matching process. The work by [JNN03] falls in the first category: the natural multi-hypotheses ability of the particle filter is used here to maintain multiple data association hypotheses. The second approach is more appropriate when using vision: an image contains a lot of information which can help to match some individual features. For example, active search [Dav05] relies on the predicted observation to define the zone where the feature is searched and on a descriptor of the feature to find it in this zone. It combines the strength of the estimation process and the robustness of the rich image data. Also the matching process can be improved using a multi-sensors architecture as in [NCH06]. A laser range finder is combined with a camera: the LRF produces accurate metric data which are used to build a map, and the images are used to detect loop-closing and if detected, also to compute the transformation between the two images up to a scale factor, and the scale factor is found thanks to the associated metric laser data. 8
Chapter 1. Introduction
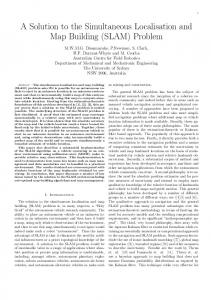
Figure 1.3: Perception of the same environment with a laser-range scanner (left) and a camera (centre). Right: depth image acquired with a Swissranger sensor.
1.3
SLAM with vision
For years in the 90’s, most applications were indoor and based on a robot equipped with a laser range finder and evolving in a plane. The segments extracted from the laser data are the landmarks for SLAM, and, by chance, they correspond to walls i.e. the obstacles and the relevant elements of the map of a building. In this context, the map built by SLAM can also be used for obstacle avoidance for instance. This setup continues to deliver very good results for SLAM: the robot can be precisely localised in a building, while producing an accurate and meaningful map [NLNT02]. In this work we tackle the problem of 3D SLAM, also referred as 6 DoF3 SLAM, in natural or semi-structured environments. There are not many sensors which offer perception of the 3D environment. In [JA04] a millimetre RADAR is used. This sensor is not too much affected by bad weather or varying lighting conditions, as a consequence it is more robust for outdoor operations than vision for instance. But it is difficult to embed a RADAR in a relatively small robot, or in a flying robot. Other sensors, not yet used in SLAM applications, may be of interest. For example the Swissranger4 delivers intensity and depth images with a resolution of 176x144 (figure 1.3-right). This kind of time-of-flight range camera delivers distance data in a limited range, currently up to a few meters, and with a low resolution. On the other hand, vision sensors are low-cost, small and power-saving and are therefore easy to embed on a robotic platform. Also they perceive data with a large field of view, at high frame rates and high resolutions. Moreover, the data produced are very rich and many algorithms from the computer vision community are ready to use and can be directly applied in robotic applications. Vision sensors bring together properties which are of main importance for SLAM. One must differentiate monocular vision and stereo vision. A stereo head is composed of two cameras, with these two images 3D data of the surrounding environment can be recovered. But stereo-vision suffers two main problems: 3 4
Degree of Freedom http://www.swissranger.ch
9
1.3 SLAM with vision • Depending on the baseline of the stereo-bench, 3D information is obtained up to a given depth, this is an intrinsic limit of this sensor. For instance, it is very difficult to endow an aerial robot with a stereo-bench which baseline is large enough to get 3D information on the ground while flying at a reasonable altitude, to our knowledge, this has only been done in [JL03]. • A stereo-bench must be calibrated so as to produce a correct 3D information, and when it is used on a vehicle it is prone to lose its calibration. For these reasons, monocular vision was chosen to develop our SLAM system. Of course monocular vision is not the ideal solution and other problems will have to be solved. The type of features must also be chosen: salient points are very numerous in natural scenes and are the projection of simple geometric objects, 3D points. Also they are very popular in the vision community and many different algorithms exist to detect and march corner points between images. So this work was started with point features. Moreover an optimisation framework is needed: the Kalman filter has many advantages, and its shortcomings can be overcome using a multiple maps approach, which is still based on the Kalman filter. So this work was started with the classic EKF-based SLAM approach. This document is organised as follow: 1. Vision based SLAM raises the problem of landmark initialisation: a single feature observation is not sufficient to initialise it in the stochastic map since its depth is unknown. An initialisation method for the bearings-only EKF SLAM algorithm is developed in chapter 2. 2. Outdoor experiments are conducted and it becomes clear that a simple setup with a perspective camera does not performs well in this environment: an efficient architecture for outdoor 3D SLAM using a panoramic camera is proposed in chapter 3. 3. The semantic of size-less points is very poor, and they are hardly matched when a large viewpoint change occurs: the use of segment features is the next step. The initialisation method presented in chapter 2 is extended and a vision-based SLAM algorithm using 3D line-segments is proposed in chapter 4. It can be noted that this work about Vision based SLAM does not directly address the problems of feature detection and matching for point features and neither for line segments. Rather state of the art algorithms from the computer vision community have been reused.
10
Chapter 2 Landmark initialisation in Bearings-Only SLAM This chapter presents a landmark initialisation method for Bearings-Only SLAM within the Extended Kalman Filter framework. The method is based on a multiple Gaussian hypotheses selection paradigm. Then some extensions to the initial algorithm are proposed. Finally the influence of the parameters is discussed, based on results obtained in simulation.
2.1
Related work
Monocular vision based SLAM is a partially observable SLAM problem, in which the sensor does not give enough information to compute the full state of a landmark from a single observation, thus raising a landmark initialisation problem. An other instance of this problem, with sonar sensors, yield a range-only SLAM problem (a solution has been proposed in [LRNB02]): since a single observation is not enough to estimate all the parameters of a landmark, multiple observations are combined from multiple poses. With vision sensors, we are in the bearings-only case. Initialisation algorithms can be divided into two groups: • In the delayed algorithms, a feature observed at time t is added to the map at a subsequent time step t + k. This delay allows the angular baseline between observations of this landmark to grow, and the triangulation operation to become well conditioned. • On the other hand, the un-delayed algorithms take advantage of the feature observations to localise the robot at time t. But the update of the stochastic map has to be computed carefully. Several contributions propose different solutions for initial state estimation in bearingsonly SLAM (see table 2.1). [JFKC06] maintains a buffer of a constant number of images 11
2.1 Related work
delayed un-delayed limitations
triangulation multi-hypotheses [JFKC06, DH00, SS03] [Dav03], our work [KDH05, SDML05] fixed size buffer complexity
single hypothesis [ED06b] [MCD06] see section 2.5.3
Table 2.1: Overview of different initialisation methods for bearings-only SLAM. and the filter is using the output of this buffer: here the filter itself is delayed. Feature points are tracked in this buffer and 3D point estimates are computed by triangulation. In [Bai03], an estimation is computed using observations from two robot poses, and is determined to be Gaussian using the Kullback distance. The complexity of the sampling method proposed to evaluate this distance is quite high. These two methods explicitly compute the intersection of the 3D lines defined by corner points observations: in the general case this computation is ill-conditioned and should be avoided. In [DH00, SS03], a combination of a global optimisation (Bundle Adjustment) for feature initialisation and a Kalman filter is proposed. The BA is run on a limited number of camera poses and the associated feature observations. The complexity of the initialisation step is greater than a Kalman filter but theoretically gives more accurate results. Also these methods, as well as the one presented in [JFKC06], have a limitation on the baseline with which the features can be initialised. Depending on the camera motion and the landmark location, some feature cannot be initialised. A multi-hypotheses method based on a particle filter to represent the initial depth of a feature is proposed in [Dav03, DCK04]. This work yielded to an effective real-time implementation which gives impressive results1 . However its application in large environments is not straightforward, as it would require a huge number of particles. A first un-delayed feature initialisation method was proposed in [KD04]. It is also a multi-hypotheses method: the initial state is approximated with a sum of Gaussians and is explicitly added to the state of the Kalman filter. The sum of Gaussians is not described and the convergence of the filter when updating a multi Gaussian feature is not proved. This algorithm has been extended in [KDH05] using a Gaussian Sum Filter, here the number of required filters can grow exponentially, this method is closed to what have been propose in [Pea95] for the bearings-only tracking. In [SDML05], a single Kalman filter is necessary: a rigorous method based on the Federate Kalman filtering technique is introduced. Also, the initial Probability Distribution Function (PDF) is defined using a geometric sum of Gaussians, an approximation which is also used in our work. The undelayed techniques are especially well adapted when using a camera looking to the front of the robot: in this case, delayed methods require a long time before the features become observable, or may even fail to initialise some of them. Very recently (in the year 2006) single hypothesis un-delayed methods have been published in [MCD06, ED06b]. These methods are very promising and are presented and discussed in more details in section 2.5.3. 1
12
The software is available at http://www.doc.ic.ac.uk/~ajd along with some videos.
Chapter 2. boSLAM algorithm Bearings-only SLAM using vision is also very similar to the well known Structure From Motion (SFM) problem. SFM methods do usually work only on images, on the contrary to SLAM methods which make use of additional sensors such as odometry. Also robotic applications require an incremental and computationally tractable solution whereas SFM algorithm can run in a time consuming batch process, Nevertheless recent work by [Nis03] shows real-time results on a small problem. Also work by [MLD+ 06] focuses on an incremental and real-time solution to the SFM problem. In SFM, the problem of initialisation is also of a great importance since it conditions the subsequent minimisation process. In [MLD+ 06], the initial 3D coordinates are obtained by triangulation on local part of the image sequence, which limits the opportunity of initialising distant points. SFM relies on a global optimisation process: links between these non linear minimisation algorithms and the standard Extended Kalman Filter used in SLAM are studied in [Kon05].
2.2 2.2.1
Multi-hypotheses initialisation Principle of the approach
The approach presented here is in the delayed multi-hypotheses category. This is a simple initialisation algorithm which does not involve any batch process, and the initialisation baseline is theoretically not limited. Figure 2.1 depicts it: 1. When a new feature is observed, a full Gaussian estimate of its state cannot be computed from the measure, since the bearing-only observation function cannot be inverted. The representation of this feature is initialised with a sum of Gaussians (section 2.2.3). 2. Then, a process updates this initial state representation, bad hypotheses are pruned until a single one remains (section 2.2.4). 3. Finally the landmark can be added to the stochastic map (section 2.2.5) which is managed by the usual EKF. The main characteristics of our approach are the following: • The initial probability density of a feature is approximated with a particular weighted sum of Gaussians. • This initial state is expressed in the robot frame, and not in the global map frame, so that it is de-correlated from the stochastic map, until it is declared as a landmark and added to the map (the benefits of this are further explained). • Many features can enter the initial estimation process at a low computational cost, and the delay can be used to select the best features. 13
2.2 Multi-hypotheses initialisation
observation
kalman
new feature ?
init sum of gaussians using [p_min, p_max]
init
update kalman filter
update likelihoods
past observations
manage gaussians
1 gaussian add to map
0 gaussian delete feature
delete gaussian
Figure 2.1: Our approach to the bearing-only SLAM problem. In order to add the landmark to the map, and to compute its state in the map frame along with the correlations in a consistent way, the pose where the robot was when the feature was first seen has to be estimated in the filter. All observations of the feature are also stored along the corresponding robot poses estimates, so that all available information can be added to the filter when landmark initialisation occurs.
2.2.2
Structure of the Kalman filter
In this work, the Extended Kalman Filter (EKF) is used to fuse the robot ego-motion data and the observations. The state of the EKF is composed of the landmarks estimates, the current robot pose, and as previously pointed out, some past poses of the robot. The state vector X and the covariance matrix P of the filter are the following: 0 PXr0 · · · PXr0 ,Xrk PXr0 ,Xl1 · · · PXr0 ,Xln Xr .. .. .. ... .. . . . . k PX k ,X 0 P P · · · P k k ,X n k ,X 1 Xr X X X r r r r r l l X = 1 P = PX 1 ,X 0 · · · PX 1 ,X k PXl1 PXl1 ,Xln Xl r r l l . .. .. .. . .. . . . . . n Xl PXl1 ,Xrn · · · PXln ,Xrk PXln ,Xl1 · · · PXln Xr0 refers to the current robot pose and Xri to the ith of the k old poses estimated in the filter. Xli refers to the ith of the n landmarks in the map. In the associated covariance 14
Chapter 2. boSLAM algorithm matrix P , PXi refers to covariances of sub-state Xi and PXi ,Xj refers to cross covariance of sub-states Xi and Xj .
2.2.3
Feature initialisation
3D point landmarks represented by their Cartesian coordinates Xl = (x, y, z)t are now considered. • the observation function is z = h(Xl/R ), • the inverse observation function is Xb/R = g(z) Xl/R is the state of the feature expressed in the robot frame, and Xb/R is the bearing of the feature in the robot frame represented by a unit vector. In our notation, the observation model h(), as well as the inverse observation model g() do not include frame composition with the robot frame, instead these transformations are formalised in to() and from() functions: to(f, v) computes vector v in frame f , and from(f, v) computes vector v in frame f −1 . This eases the following developments, and is general with respect to the underlying representation of a 3D pose (using Euler angles, quaternions,. . . ). This also makes the implementation more modular, and observation functions and their Jacobian matrix easier to write. Also, the same formalism can be used to take into account other frame transformations such as robot to sensor transformation. For the sake of clarity, the sensor frame is here supposed to be the same as the robot frame. Given the first observation z of the feature with covariance Pz , the probability density of Xb/R is already jointly Gaussian since the measure z is considered to be Gaussian. The measure itself does not give any information about the depth, but we generally have an a priori knowledge. For indoor robots, the maximal depth can for instance be bounded to several meters. For outdoor robots the maximal range is theoretically infinity, but in general this infinity can be bounded. This gives us for the depth ρ an a priori uniform distribution in the range [ρmin , ρmax ]. This a priori PDF is approximated with a sum of n Gaussians Γi . On one hand, it is a convenient way to approximate a PDF, and on the other hand, once a single hypothesis is selected, it is straightforward to incorporate this Gaussian in the Kalman filter. p(Xb/R , ρ) ≈ Γ(Xb/R , PXb/R ).p(ρ) ≈ Γ(Xb/R , PXb/R ).
n−1 X
wi Γ(ρi , σρi )
(2.1)
i=0
As shown in [Pea95], the stability of a Extended Kalman filter initialised with the Gaussian Γ(ρi , σρi ) is governed by the ratio α = σρi /ρi . If α is properly chosen the linearisation of a bearings-only observation function around ρi is valid for this Gaussian. This gives us the definition of σρi . 15
2.2 Multi-hypotheses initialisation The means ρi of the Gaussians are now defined. The distance between two consecutive means ρi and ρi+1 is set to be proportional to σρi + σρi+1 : ρi+1 − ρi = kσ (σi + σi+1 ) It comes from the fact that each Gaussian fills up a depth interval which is proportional to the standard deviation of this Gaussian (see figure 2.2). In fact these formula define a geometric progression for the means of the Gaussians, with the common ratio β = ρi+1 : ρi ρi+1 − ρi = kσ (σρi + σρi+1 ) σρi σρi+1 ρi+1 ρi+1 − 1 = kσ ( + ) ρi ρi ρi+1 ρi β − 1 = kσ α + kσ αβ β(1 − kσ α) = 1 + kσ α 1 + kσ α β= 1 − kσ α The sum of Gaussians which approximates the PDF of the depth ρ is controlled by two parameters α and kσ or equivalently by α and β: ρmin ρ0 = (1 − kσ α) i ρi = β .ρ0 σρi = α.ρi wi = 1/n ρmax ρmax ρn−1 ≥ ρn−2 < (1 + kσ α) (1 + kσ α) Figure 2.2 shows a plot of individual Gaussian members and the resultant sum for α = 0.2 and kσ = 1.0. The numerical value of α and kσ are discussed later in section 2.3. Now, let’s rewrite equation (2.1) under the form of a compact sum of Gaussians: X r p(Xb/R , ρ) = wi Γ(Xb/R , PXb/R ).Γi (ρi , σρi ) i
=
X
i i wi Γ(Xl/R , PXl/R )
i
where: i = ρi Xb/R Xl/R i PXl/R = ρi 2 PXb/R + Xb/R σρi Xb/R T
PXb/R = GPz GT G = ∂g/∂z|z i i Each Γ(Xl/R , PXl/R ) represent a Gaussian hypothesis for the landmark state. Since it is kept in the robot frame, the distribution is uncorrelated with the current map. As a consequence the sum of Gaussians is not added to the state of the Kalman filter and this step of our algorithm is done at a low computational cost.
16
Chapter 2. boSLAM algorithm
kσ.(σρ1 + σρ2)
σρ1
σρ2
0 0.5
1
1.5
2
2.5
20
40
60
3
80
100
120
140
depth (m)
Figure 2.2: Left: definition of kσ . Right: example of a Gaussian sum with α = 0.2 and kσ = 1.0.
2.2.4
Initial state update
The sequel of the initialisation step consists in choosing the Gaussian which best approximates the feature pose – the feature being thrown away if no consistent Gaussian is found. This process is illustrated in figure 2.3. Hypothesis likelihood. Subsequent observations are used to compute the likelihood of each Gaussian Γi given observation zt with covariance Rt at time t. The likelihood of Γi to be an estimation of the observed feature is: µ ¶ 1 1 t T −1 Li = n /2 p exp − (zt − zˆi ) Si (zt − zˆi ) 2 2π z |Si | where nz is the dimension of the observation vector and Si is the covariance of the innovation zt − zˆi . For each hypothesis, zˆi and Si have to be computed. Since the feature was first seen t at time tref , the Gaussians are expressed in the past robot frame Xrref , they first need to be expressed into the map frame. For clarity, let H() be the full observation function, we have: ˆ 0 , from(X ˆ rtref , X ˆ i ))) zˆi = h(to(X r
l/R
ˆ 0, X ˆ rtref , X ˆi ) = H(X r l/R Si = H1 PXr0 H1T + H2 PX tref H2T r
+ H1 PX 0 ,X tref H2T + H2 P T 0 r
t
Xr ,Xrref
r
H1T
i + H3 PXl/R H3T + Rt
where
¯ H1 = ∂H/∂Xr0 ¯Xˆ 0 ,Xˆ tref ,X i r
r
l/R
¯ t ¯ H2 = ∂H/∂Xrf ¯
ˆ 0 ,X ˆ rtref ,X i X r l/R
¯ i ¯ H3 = ∂H/∂Xl/R ˆ 0 ,X ˆ tref ,X i X r
r
l/R
17
2.2 Multi-hypotheses initialisation
Figure 2.3: From an observed feature to a landmark in the map. From left to right: the sum of Gaussians is initialised in the robot frame; some Gaussians are pruned based on their likelihood after additional observations of the feature; when a single hypothesis remains, the feature is declared as a landmark and it is projected into the map frame; and finally past observations are used to update the landmark estimate. A χ2 test is performed on (zt − zˆi )T Si−1 (zt − zˆi ): bad hypotheses are thrown away as soon as possible . Hypothesis selection. Then the bad hypotheses are selected and the associated Gaussian is pruned. Bad hypotheses are those whose likelihood Λi is low. Two different tests can be used here: • as in [Pea95, LLS05], bad hypotheses are pruned when their likelihood is below a given threshold, • or, as in [KD04], the Sequential Probabilistic Ratio Test (SPRT) can be used. The SPRT was chosen because this test is statistically well founded and avoids the choice of an arbitrary threshold. The SPRT is presented in [BSL93]: a likelihood ratio is computed between two hypotheses, the null hypothesis H0 and the alternate hypothesis H1 . Such a test is computed for each Gaussian i: SP RTi =
Y · p(zi |H1 ) ¸ t
p(zi |H0 )
t
• the null hypothesis being “this Gaussian is not an estimate of the landmark”, • the alternate hypothesis being “this Gaussian is an estimate of the landmark”. 18
Chapter 2. boSLAM algorithm
step 0 step 1 step 2 step 3 step 4 step 5 step 6
0
5
10
15
20
Figure 2.4: Evolution of the weighted sum of Gaussians through initialisation steps. Only the weights of the gaussians are modified, no correction is applied. p(zi |H1 ) is simply the likelihood Li , and, as proposed in [KD04], p(zi |H0 ) is set to the likelihood of the most likely Gaussian without considering the current one. p(zi |H1 ) = Li p(zi |H0 ) = max Lj j,j6=i
Then a bad hypothesis is pruned if its SPRT falls below a threshold defined by the false alarm probability Pf a and the missed detection probability Pmd . When only a single Gaussian remains, the feature is added to the map. An example of such a convergence is plotted step by step in figure 2.4.
2.2.5
Map augmentation
i i When a Gaussian Γ(Xl/R , PXl/R ) is chosen, the corresponding feature j is declared as a landmark, and is added to the stochastic map: ! Ã µ − ¶ − j P P − X X ,Xl X+ = P+ = PX j PX j ,X − Xlj l
l
i ˆ j = from(X ˆ rtref , Xl/R X ) l i F2T PX j = F1 PX tref F1T + F2 PXl/R l
PX j ,X − = F2 P
r
−
l
where F1 = ∂from/∂f |Xˆ tref ,X i r
l/R
and F2 = ∂from/∂v|Xˆ tref ,X i r
l/R
Remember that for some steps since the feature was first seen, the feature observations were kept, and the corresponding poses of the robot have been estimated by the filter. Up 19
2.3 Parameters definition and evaluations in simulation to now the observations were used only to compute the likelihood of the hypotheses, now this information is used to update the filter state: once a feature is added as a landmark, all available information regarding it is fused in the stochastic map. Section 2.4.1 explains that in practice some of this information can be discarded.
2.3
Parameters definition and evaluations in simulation
This algorithm requires several parameters to be properly set (table 2.2). The main problem is to isolate the influence of each individual parameter, this is a tricky problem which cannot completely be solved. Our approach is to use a simulation we have developed so as to study the influence of the parameters on the performance of the algorithm. parameter α kσ k
description ratio between mean and standard-deviation of each Gaussian defines the density of Gaussians the maximum number of robot poses estimated in the filter
default value 0.2 1.0 10
Table 2.2: This table presents the parameters evaluated in simulation.
2.3.1
Simulation environment
The simulation environment is a 80 × 80 × 2 m parallelepiped. It contains 40 3D points randomly defined once and for all. The robot is following a circular trajectory with a radius of 10 m, centred in (0, 0), in the plane z = 0. The robot moves with the constant speed of s˙ = 0.2 m/s and θ˙ = 0.2 rad/s, the time-step of the simulation is 1 s. The robot odometry gives classic (ds, dθ) measures, a Gaussian noise is added to these data with (σds /ds = 5%, σdθ /dθ = 5%). Also the robot is endowed with a bearings sensor which has a 360◦ field of view and a maximum range of 20 m. It provides (θ, φ) measures of the 3D points to which a Gaussian noise is added with (σθ = σφ = 0.2◦ ). With this setup, a total of 22 landmarks are visible along the trajectory. Figure 2.5 presents the robot trajectory and the environment. Since the quality of the Gaussian noise is important to get sensible results, it is carefully generated using the Boost Random Number Library 2 . 2
20
http://www.boost.org/libs/random/index.html
Chapter 2. boSLAM algorithm
15
truth odometry
10
y (m)
5
0
-5
-10
-15 -15
-10
-5
0
5
10
15
x (m)
Figure 2.5: Left: true trajectory and trajectory obtained by integration of odometry. Right: 3D view of the simulated environment. α=0.10 α=0.15 α=0.20 α=0.25 α=0.30
kσ=0.5 kσ=1.0 kσ=1.5 kσ=2.0
0
20
40
60
80
100
120
depth (m)
140
0
20
40
60
80
100
120
140
160
depth (m)
Figure 2.6: Left: α = 0.2, PDFs for different values of kσ . Right: kσ = 1.0, PDFs for different values of α (for clarity, curves are shifted).
2.3.2
Initial PDF (α and kσ )
The definition of the initial PDF is an important point since it greatly influences the consistency of the algorithm. The value of kσ controls the distance between each Gaussian, and is set so as to reduce the “waves” of the PDF: it is a good approximation of the uniform distribution. Figure 2.6 also shows that α does not influence the wavy aspect of the distribution, the influence of the two parameters is not correlated. Even if kσ = 0.5 could seem better at this point, kσ = 1.0 is chosen for the following tests (see later in this section). The ratio α must be chosen so that the linearisation errors of the observation function are small enough. In [Pea95], α is set to 0.2, and in [Dav03], α is set to 0.3. In both works, α is empirically chosen. Here, we have run several single run simulations with different 21
2.3 Parameters definition and evaluations in simulation values of α, and the consistency of the robot pose is verified by computing its NEES3 . Figure 2.7-top shows that α ≥ 0.2 gives inconsistent results. Moreover, an intuitive result would have been to obtain a better robot localisation when α is smaller, since the initial feature state has less uncertainty. Figure 2.7-bottom shows that it is wrong. The reason is, when α is smaller, the initial state contains more smaller hypotheses, and the algorithm needs more information to select the good one. As a consequence, at the beginning of the simulation, the robot is moving with an empty map (process noise is added at each time-step), and landmarks are added later to the map, with, in the global reference frame, a larger uncertainty. But all in all, these differences are small and do not significantly modify the performance. The parameter kσ has a greater influence on the speed of landmark initialisation. When kσ gets smaller, the overlap between the Gaussians increases, and the different hypotheses cannot be rapidly distinguished. Figure 2.8 shows the results of the simulations: for kσ = 0.3, some landmarks are never initialised.
2.3.3
Influence of k
The maximum number of positions of the trajectory estimated in the filter (k) limits the number of past observations that can be used for landmark initialisation. Moreover, it limits the number of past poses which can be used to start new features initialisation. In order to bring to light the influence of k during simultaneous initialisation of multiple features, the environment described in section 2.3.1 is used, but the robot is moving along a longer circular trajectory with a radius of 20m. Figure 2.9 shows that robot uncertainty is significantly reduced when k increases from 1 to 5, while increasing k further does improve the results significantly. One can see that the effective size of the trajectory is quite different for all k. But, as shown on figure 2.9, most of the poses are used to store past observations and the difference between k = 1 and k = 5 comes from the higher number of features that can enter the initialisation process simultaneously with k = 5. As a conclusion, it is not very useful to increase k a lot, the information loss which occurs when some past observations are deleted is not crucial.
2.3.4
Comparison with fully observable SLAM
Pose uncertainty. We were naturally curious to know how the performance of the SLAM is affected when the range measure is not available. In simulation, it is possible to compare the result of boSLAM with range-and-bearings SLAM, fullSLAM for short. Using the simulation described in section 2.3.1, we modify the simulated sensor so that it returns also the range ρ of the points, a Gaussian noise with σρ /ρ2 ∈ {0.01, 0.02} is added to this measure. Figure 2.10-left shows a plot of the robot pose uncertainty: as expected fullSLAM performs better than boSLAM but the difference is not so large. 3
22
Normalised Estimation Error Squared, [BSL93]
Chapter 2. boSLAM algorithm
50
α=0.30 α=0.20 α=0.15 α=0.10 99% bound
40
NEES
30
20
10
0 0
50
100
150
200
250
300
350
400
time (s) 8e-06
12
α=0.30 α=0.20 α=0.15 α=0.10
7e-06
α=0.30 α=0.20 α=0.15 α=0.10
10
number of landmarks
pose uncertainty (m3)
6e-06 5e-06 4e-06 3e-06
8
6
4
2e-06 2 1e-06 0
0 0
200
400
600
800
1000
0
20
40
time (s)
60
80
100
time (s)
Figure 2.7: Top: evaluation of the robot pose NEES for several values of α, the 99% probability region bound is also plotted. Bottom: pose uncertainty and map size are plotted. 1e-05
25
kσ=0.3 kσ=0.5 kσ=1.0
20 number of landmarks
pose uncertainty (m3)
8e-06
6e-06
4e-06
2e-06
15
10
5
0
kσ=0.3 kσ=0.5 kσ=1.0
0 0
200
400
600 time (s)
800
1000
0
50
100
150
200
250
300
350
400
time (s)
Figure 2.8: Robot pose uncertainty and map size are plotted for several values of kσ . 23
2.3 Parameters definition and evaluations in simulation
0.0003
k=20 k=10 k=5 k=1
pose uncertainty (m3)
0.00025
0.0002
0.00015
0.0001
5e-05
0 0
100
200
300
400
500
600
700
800
time (s) 7
k=20 k=10 k=5 k=1
k=20 k=10 k=5 k=1
6
15 number of init features
effective size of trajectory
20
10
5
5 4 3 2 1
0
0 0
100
200
300
400 time (s)
500
600
700
800
0
100
200
300
400
500
600
700
800
time (s)
Figure 2.9: Influence of the value of k. Top: pose uncertainty. Bottom-left: number of utilised past robot poses. Bottom-right: number of features in the initialisation process.
24
Chapter 2. boSLAM algorithm 6e-06
80
0.01 0.02 boSLAM
boSLAM - bias=0 boSLAM - bias=0.004 SLAM - bias=0 SLAM - bias=0.004 SLAM - bias=0.02 99% bound
70
5e-06
50 NEES
pose uncertainty (m3)
60 4e-06
3e-06
40 30
2e-06 20 1e-06 10 0
0 0
100
200
300
400
500
600
0
100
200
300
time (s)
400
500
600
700
time (s)
Figure 2.10: Left: Uncertainty on the robot pose for boSLAM and fullSLAM with different noise on the range measure. Right: consistency of boSLAM and fullSLAM with different odometry bias. Influence of odometry bias. Odometry data is often corrupted by additive noise. Odometry is the only metric information which fixes the scale of the estimated map and robot poses in boSLAM. It is interesting to understand how much bias can be tolerated by boSLAM. The simulated odometry is now written: µ ¶ µ ¶ µ ¶ v wv b + + v ω wω 0 where w is the Gaussian noise described in section 2.3.1, and b is an additive bias. Bias is added only to the linear speed component, since this is the only metric component (the rotation speed does not give a metric information). Simulations with bv ∈ {0, 0.004, 0.02} m/s were run on both boSLAM and fullSLAM (v = 0.2 m/s). Figure 2.10-right shows that boSLAM is already inconsistent with a very small bv = 0.004 while fullSLAM is still consistent. This really underlines the sensitivity of boSLAM to the input command data.
2.4 2.4.1
Algorithm refinements Past poses management
In the ideal case, all the robot past poses where an observation of an initialisation feature has been made should be kept in the filter state. This would lead to store an unbounded number of poses in the map and consequently increase the computation time. In our implementation, the number of sub-state of the filter containing past robot pose estimates is limited to k, as a consequence the problem of choosing the best k poses has to be solved. For that purpose, each pose is given the following relevant attributes: • f rameIndex: the index of the frame attached to that pose, 25
2.4 Algorithm refinements • nbInitF eatures: the number of features added for initialisation at that frame, • nbInitObs: the number of observations corresponding to features in initialisation, • distT oP rev: the distance to the previous pose in the trajectory, which can be a metric or an index distance. Before applying the prediction step to the current robot pose (Xr0 ), a procedure is applied to choose whether or not Xr0 is memorised. The goal is to keep in the filter state the k most interesting poses. Algorithm 2.1 describes this process, and algorithm 2.2 defines how to compare two robot poses and choose the most important one. Figure 2.11 gives an example of some poses estimated in the filter. The backup copy of the stochastic pose Xr0 must be done carefully: ∀j PXrw ,X j ← PXr0 ,X j Xrw ← Xr0 PXrw ← PXr0 f f ∀i, i 6= 0, i 6= 1, PXrw ,Xri ← PXr0 ,Xri PXrw ,Xr0 ← PXr0 Discussion on operator ≺. Past poses which corresponds to a feature initial pose are really important: if such a pose is deleted, all the associated features must be thrown away. This is the reason why such poses are preferred. Also, the priority is given to older poses: if a feature has been observed during many frames, it means it is very stable and is a very good feature for SLAM. Finally the poses which distance to the previous one is larger are preferred in order to spread the estimated poses. Updating features. When a past robot pose is thrown away, the features which were initialised at that frame are lost. Also, the observations of features made at that frame are now useless since it will not be possible to update the map at the time of feature initialisation. These observations are also thrown away. Updating robot poses history. When a feature is initialised in the map, or when it is lost by the tracking system, the attributes of the robot poses are updated accordingly.
2.4.2
Hypotheses degeneration
The problem. During the initialisation process of a feature, the observations are used to update the weights of the different Gaussian hypotheses. Depending on the camera trajectory with respect to the feature position, a new observation does not necessarily brings more information on the depth of this feature. In this case, the likelihoods of the hypotheses are updated according to the observation noise, and their value may become completely erroneous4 . This can lead to the selection of a wrong hypothesis (for example when a feature is detected near the image center and the robot moves along the camera optical axis). Such an inconsistent initialisation is illustrated figure 2.12. These wrong initialisations can lead to filter divergence and must be eliminated. 4
26
A theoretical demonstration can be found in [Sol07]
Chapter 2. boSLAM algorithm
Algorithm 2.1 Current pose management if Xr0 .nbInitF eatures > 0 or Xr0 .nbInitObs > 0 then if there is a free sub-state in the filter then backup Xr0 in this sub-vector else i Xrw ← min≺ i {Xr } {find the worse pose} if w = 0 then do nothing else backup Xr0 at Xrw location in the filter state end if end if else do nothing end if
Algorithm 2.2 operator ≺ (Xri , Xrj ) if Xri .nbInitF eatures = 0 and Xrj .nbInitF eatures = 0 then if Xri .nbInitObs = Xrj .nbInitObs then return Xri .distT oP rev < Xrj .distT oP rev else return Xri .nbInitObs < Xrj .nbInitObs end if else if Xri .nbInitF eatures > 0 and Xrj .nbInitF eatures > 0 then return Xri .f rameIndex > Xrj .f rameIndex else if Xri .initF eatures = 0 then return true else return false end if
27
2.4 Algorithm refinements
10
number of past poses
8
6
4
2
0 0
50
100
150
200
250
300
350
400
time (s)
Figure 2.11: Left: the red frames show the ten past poses estimated in the filter. Right: the number of past poses estimated in the filter during a simulation run.
Figure 2.12: From left to right: feature initial hypotheses, hypotheses pruning, and landmark initialisation with a wrong hypothesis.
28
Chapter 2. boSLAM algorithm
1
2
t1
t2
Figure 2.13: Predicted observation of the closest hypothesis for two different features. Proposed solution. The solution consists in filtering the observations which will be used to update the feature depth hypotheses. Only observations which convey a new information on the depth of the landmark are to be considered. Suppose that feature i is observed and its initial state is updated at time t1 . Feature i is observed again a time t2 , the decision of whether updating or not its initial state has to be taken. The information gained thanks to this new observation depends on (i) the translation of the robot between t1 and t2 , (ii) the actual depth of the landmark, and (iii) the observation model and the noise covariance R. The observation of the closest remaining hypothesis X0i is computed for both t1 and t2 : z1 = H1 (X0i )
z2 = H2 (X0i )
d = (z2 − z1 )R−1 (z2 − z1 )t
Where H2 only takes into account the translation between t1 and t2 , not the rotation. This is illustrated figure 2.13. If the Mahalanobis distance d is above a predetermined threshold, it means that from the robot pose at t2 new information on the depth of feature i can be obtained with the considered sensor. This method has the advantage of being generic with respect to the feature observation z: it can be a point but also a segment as presented in section 4.7 on page 80. Also the method properly takes into account the observation noise.
2.4.3
Landmarks at infinity
Motivations. Landmarks located at infinity are very interesting for SLAM: even if no information on the robot translation can be inferred, they provide a reliable measure of the orientation of the robot. Large errors on the orientation of the robot are precisely the main cause of linearisation errors of the observation model. In [MD06], a purely rotating camera is localised using a SLAM approach based on points at infinity. In the un-delayed single hypothesis bearings-only SLAM algorithm proposed in [MCD06] the unique Gaussian 29
2.4 Algorithm refinements t1 t0 t2
t3
Figure 2.14: The feature is discovered at t0 , its initial state (in red) and the true landmark (in green) are represented. The baselines (in blue) are incrementally computed for the successive observations. Here the maximal baseline is achieved between t1 and t3 . theoretically represents landmarks possibly at infinity. Whereas in triangulation methods, the recovered depth is intrinsically limited. With multi hypotheses algorithms, a special infinity hypothesis or a special decision process must be introduced to take into consideration landmarks at infinity. Proposed approach. The concept of infinity is a relative concept: for a man travelling on Earth, the stars can be considered as being at infinity. It means that they define a fixed direction. For a robot moving in a given area, the infinity is not so far. How far is the infinity depends on two elements: • The area where the robot can move, or in other words the maximum baseline with which the feature can be observed. • And also the precision of the sensor which is used to measure the angular direction of the feature: the more accurate is the sensor, the farther is the infinity. The size of the area where the robot moves can be defined according to its task, or more naturally according to the size of the local maps when a sub-maps based SLAM approach is implemented. The precision of the angular measures is already encoded in the error model of the sensor. With our algorithm, when a feature has been observed with a large enough baseline without being initialised, it means that the depth information for this feature cannot be retrieved. Then it is naturally added into the map as a feature at infinity which direction is represented by a 3D unit vector. Figure 2.14 illustrates the incremental computation of the maximal baseline with which a landmark has been observed. Of course, it means that the robot has to travel at least this baseline before a remote feature could be initialised. In order to improve the process, the threshold on the baseline is set smaller than the maximal dimension of the area, and to balance this approximation, the observation noise of the landmarks at infinity is increased. 30
Chapter 2. boSLAM algorithm This process requires a bound on the maximal depth that can be recovered by the robot, this defines the ρmax of the Gaussian Sum. It also needs a threshold on the baseline, along with an increased observation noise, the latter is set empirically.
2.5 2.5.1
Discussion Complete list of parameters parameter α kσ k doU pdateT h
eraseHypothesisT h Pf a Pmd ρmax baselineT h
description ratio between mean and standard-deviation of each Gaussian defines the density of Gaussians the maximum number of robot poses estimated in the filter threshold to decide whether the initial state is updated or not threshold to decide whether a hypothesis is deleted or not SPRT false alarm probability SPRT missed detection probability maximal depth of the initial hypotheses threshold to decide whether a feature is at infinity
default value 0.2 1.0 10 10 20 5% 5% in metres in metres
Table 2.3: This table presents all the parameters used in the boSLAM algorithm with their typical value. Table 2.3 presents a complete list of the parameters of boSLAM. Some of them were not discussed because they correspond to statistically well founded threshold. doU pdateT h and eraseHypothesisT h are set according to the desired χ2 test confidence. The same goes for Pf a and Pmd which are used in the Sequential Probabilistic Ratio Test. ρmax and baselineT h are set according to the size of the area where the robot is moving.
2.5.2
About landmark parametrisation
In our algorithm, the landmark (or tentative landmark) states are manipulated in two different stages: (i) during the initialisation process and (ii) in the stochastic map. There is no specific problem for these two representations to use a different parametrisation. When a hypothesis is selected, its representation just has to be converted to the map parametrisation. We have chosen the Cartesian representation of the 3D points for the initialisation procedure. This representation has the advantage of being the one which is used in the global 31
2.5 Discussion map. Other representations could have been used (see table 2.4). The polar representation is the natural representation for bearings sensors: the bearing measurements being directly mapped to [θ, φ]. The modified polar or inverse depth parametrisation is, for the same reason, very natural. It has also the advantage of reducing the non-linearity in the observation function. This representation has been already used in the past in algorithms to solve the bearings-only tracking (BOT) problem, for example in [Pea95, AH83]. Provided that the EKF linearisation constraints are met, all the representations must perform equally. Since the polar and the modified polar are meaningful only in the sensor reference frame, one must add the origin [xref , yref , zref ] of this frame to the representation. Cartesian polar modified polar
[x, y, z]t [xref , yref , zref , ρ, θ, φ]t [xref , yref , zref , 1/ρ, θ, φ]t
Table 2.4: Different representations for a 3D point. With our algorithm, no update can occur during the initialisation steps, so there is no consistency problem here, and thus we do not see any advantage of using a different parametrisation for stage (i) and (ii). Nevertheless, the use of the modified polar parametrisation for both steps would have the following benefit: the linearisation of the observation function around the mean of each hypothesis would be valid in a larger interval, so the value of α could be increased. And, while keeping the algorithm consistent, the number of hypotheses could be reduced. The main drawback of this parametrisation is that it needs a 6-dimension vector. Since our algorithm does not suffer from a large number of initial hypotheses, we prefer to keep the Cartesian representation.
2.5.3
Bearings-Only SLAM using Inverse Depth parametrisation
Recent work. Very recently, the inverse depth parametrisation has been used to solve the bearings-only SLAM problem with un-delayed algorithms [MCD06, ED06b]. The estimation process benefits from the quasi-linearity of the observation function under the condition that the motion of the camera along the depth axis is small relatively to the depth of the point [ED06b]. Using this property, [MCD06, ED06b] can use a standard Kalman filter to estimate a landmark represented with the inverse depth parametrisation. In [MCD06] the standard EKF based SLAM is applied, each landmark being represented by [xref , yref , zref , 1/ρ, θ, φ]t . A new landmark is immediately initialised in the stochastic map with 1/ρ = 0.5 and σ1/ρ = 0.5. In [ED06b] a FastSLAM2.0 based approach is proposed. Here, the landmark is not immediately added to the map when it is detected for the first time, it enters a “partially initialised” state, and is stored using the inverse-depth parametrisation. While in this state, new observations of this feature are used to update (i) its depth estimate, and (ii) the current estimate of the camera pose using the epipolar constraint. Once the uncertainty 32
Chapter 2. boSLAM algorithm over the depth is small enough, an unscented transformation is applied to transform the landmark to the Cartesian representation and to add it in the filter. This method is not a pure un-delayed method, but has the advantage that the observations are directly used to update the camera pose estimate. Comparing with our algorithm. Since our boSLAM algorithm is based on the Kalman filter, it was easy to implement a version of [MCD06], here referred as idSLAM. Comparative simulations with the setup described in section 2.3.1 have been run. The results are shown in figure 2.15. The uncertainty on the robot pose is nearly the same for both approaches, with a noticeable exception at the beginning of the run. Because of the delay, boSLAM does not benefit from the map to improve the robot pose estimate, until some landmarks are initialised. Then the previous observations are fused and the robot pose estimate updated accordingly. One can also verify that the landmarks are initialised faster with idSLAM. The consistency on the robot pose is also very similar: in our simulation setup the observation function linearity hypothesis of idSLAM is verified, even with a low frame rate of one every second which corresponds to an observation every 0.2 meter. In order to evaluate the limit of idSLAM when the frame rate decreases, simulations with different frame rate were run. Figure 2.15-bottom-left shows that with observations every 0.4 meter, idSLAM is already inconsistent, whereas boSLAM is consistent. Of course it also depends on the real depth of the landmarks: if the landmarks are closer to the camera, the bound on the frame rate will be lower. We were quite surprised to observe that idSLAM works also with low frame rates, it makes this algorithm a good candidate for a bearings-only SLAM implementation for robotics. Comparative simulations can be viewed on the following video: http://www.laas.fr/ ~tlemaire/download/boIdSlam.mp4. Small issue with idSLAM. Nevertheless we encountered an issue with the idSLAM algorithm. With our simulation setup it often happens that the inverse depth becomes negative after a Kalman update. In this case, the next predicted observation for this landmark is 180◦ off the observation and is completely inconsistent. It causes the divergence of the Kalman filter. This difficulty is not mentioned in the original paper [MCD06]. In our implementation, the Kalman filter is protected against such wrong updates by a χ2 test: the observation is ignored. Therefore good results could be obtained. The origin of the problem is to update the depth of the landmark with an observation which does not carry any information on this dimension. Then the observation noise predominates in the update of the depth: the landmark can get behind the camera. Such observations are numerous when the camera points to the direction of the trajectory, which is unavoidable with a panoramic sensor for instance. We had to cope with the same problem, see section 2.4.2. This solution could be adapted here, but the rejected observations would be definitely lost. A sanity check can also be applied on the inverse depth and set it to an arbitrary positive value when it gets 33
2.6 Conclusion 8e-06
25
boSLAM idSLAM
boSLAM idSLAM
7e-06 20 number of landmarks
pose uncertainty (m3)
6e-06 5e-06 4e-06 3e-06
15
10
2e-06 5 1e-06 0
0 0
100
200
300
400
500
600
0
100
200
time (s)
300
400
500
600
400
500
600
time (s)
16
70
boSLAM idSLAM 99% bound
14
boSLAM dt=1 boSLAM dt=2 boSLAM dt=3 idSLAM dt=1 idSLAM dt=2 idSLAM dt=3 99% bound
60
12
50
NEES
NEES
10 8
40 30
6 20
4
10
2 0
0 0
100
200
300 time (s)
400
500
600
0
100
200
300 time (s)
Figure 2.15: Comparing of our Bearings-Only SLAM algorithm (boSLAM) and the InverseDepth SLAM algorithm (idSLAM). Top-left: uncertainty of the robot pose estimate. Topright: size of the map. Bottom-left: consistency of the robot pose estimate. Bottom-right: consistency of idSLAM for different frame rate. negative. The same issue should also appear with the algorithm presented in [ED06b]. In this case the two relevant components of the observation are well separated: the epipolar update can always be applied and the update on the depth of the feature could be filtered without loss of information.
2.6
Conclusion
In this chapter, a method for landmark initialisation in Bearings-Only SLAM has been proposed. This algorithm has a low complexity with respect to the initial state update. In practice this is of a great advantage: many features can enter the initialisation, and if during the delay a feature is found to be of poor quality or is lost by the perception algorithm, it is simply erased and has not consumed computational resources. Also our algorithm has a low complexity with respect to the number of hypotheses 34
Chapter 2. boSLAM algorithm at initialisation. More complex landmark states, with more unobservable parameters can easily be considered: chapter 4 presents an extension of this method for line segments. Only a few parameters are used by this method, simulations were run so as to understand their influence, and also to evaluate the performance of the method. In the next chapter, experiments with real images data are analysed. A video illustrating the boSLAM algorithm and presenting some results on real images can be downloaded at http://www.laas.fr/~tlemaire/publications/lemaireBoSLAMVideo. mp4
35
36
Chapter 3 Results with perspective and panoramic cameras In this chapter, the boSLAM algorithm is run on realdata acquired with our robots: the obtained results are presented. These real world experiments bring up some problems which were not addressed in chapter 2 but are nevertheless of main importance. This chapter describes how these issues were solved, and under the light of the results obtained with a perspective camera, an original setup using a panoramic camera is proposed.
3.1
Introduction
Experiments on real data are of essential importance in robotics. While simulations are useful to check if the implementation is correct and to analyse some properties of the algorithms, experiments on real data do usually raise unexpected problems and really demonstrate the feasibility of the approach. The SLAM process described in chapter 2 requires several kinds of input data for the experiments: • Perception produces feature observations: – features are detected in the images, – some features are tracked in consecutive images, – the observation model is defined: z = h(Xl ) + w. • The robot pose is predicted: – ego-motion data are available, 37
3.1 Introduction
Figure 3.1: The ATRV rover Dala and the 10m long blimp Karma. – the dynamic model of the robot is defined: Xrt+1 = f (Xrt , ut ) + w.
• Loop-closing mechanism:
– possible loop-closing are detected, – current detected features are matched with landmarks in the map.
In particular, the loop-closing mechanism is very important and is the main goal of SLAM. Section 3.2 proposes such a setup for a rover equipped with a single perspective camera and odometry, the results which were obtained are presented and discussed section 3.3. Then a new setup for a rover endowed with a stereo bench and a panoramic camera is proposed section 3.4 and results are given section 3.5. Finally some preliminary results obtained with a blimp are shown in section 3.6. These experiments have been performed with the robots Dala and Karma (figure 3.1). Dala is an iRobot ATRV model, equipped with a 0.35 metre wide stereo-vision bench mounted on a pan-tilt unit (the images are down-sampled to a resolution of 512 × 384), a panoramic camera and a 6-axis inertial measurement unit. Karma is an airship equipped with a 2.4 meter wide stereo-vision bench, a differential GPS that provides position and speed information, a magnetic compass and a 2-axis inclinometre. 38
Chapter 3. Results on real data
Figure 3.2: Results of the matching algorithm. The red crosses shows the interest points, the green squares indicate successful matches. There was 194 matches for a total computanional time of 201ms (including 116ms for the Harris points detection and 85ms for the matching) from [LBJL06].
3.2 3.2.1
SLAM for a rover equipped with a perspective camera Camera model
The classic pinhole camera model is used here. A 3D point (x, y, z)t is projected in the image plane according to the following equation: µ ¶ µ ¶ µ ¶ 1 x u αu 0 u0 p = 2 2 2 v 0 α v v0 x +y +z y The cameras of Dala are equipped with short focal lens and therefore the raw images present distortion. A second order radial distortion model is used to compute images without distortion. The parameters u0 , v0 , αu , αv as well as the two distortion parameters are obtained after a calibration process. A tool developed in the laboratory was used to do the calibration work, as well as a Matlab calibration toolbox written by Jean-Yves Bouguet1 .
3.2.2
Perception: corner point features
Point features must first be detected in the images, and then tracked in consecutive images. Also, during the loop-closing, features have to be matched. Feature tracking is easier than feature matching: the viewpoint has not changed too much, and also in SLAM a good predicted observation is available to guide the search. 1
http://www.vision.caltech.edu/bouguetj/calib_doc/
39
3.2 SLAM for a rover equipped with a perspective camera In all our experiments, the algorithm developed at LAAS in [JL01] and recently modified in [LBJL06] is used. It is based on the modified Harris detector to extract features. Then the features are matched based on a combination of the signal information around the point and of the geometric constraints between detected points. Given two images, the algorithm returns the numerous detected corners and the matches between the two images (see figure 3.2). For SLAM, this algorithm is used for the tracking with input images acquired at time t and t + 1, and also for the matching with arbitrary images.
3.2.3
Ego-motion estimation
3D odometry. With a robot equipped with an inertial measurement unit, an estimate of the 3D elementary motions u(k + 1) can be provided by integrating the odometry data on the plane defined by the pitch and roll angles of the robot. An actual error model on odometry is difficult to establish: since the rover Dala experiences important slippage and is equipped with a cheap inertial measurement unit, we defined the following conservative error model: • The standard deviation on the translation parameters ∆tx , ∆ty , ∆tz is set to 8% of the travelled distance, • The standard deviation on ∆Φ (yaw) is set to 1.0 degree per travelled meter, and to 1.0 degree for each measure on ∆Θ, ∆Ψ (pitch and roll).
3.2.4
Features selection and map management
One of the advantages of using interest points as features is that they are very numerous. However, keeping many landmarks in the map is costly, the filter update stage having a quadratic complexity with the size of the state vector. It is therefore desirable to actively select among all the interest points the ones that will be kept as landmarks. Feature selection. A good landmark should easily be observable (matched), and landmarks should be regularly dispatched in the environment. The strategy to select the landmarks is the following: the image is regularly sampled in cells (figure 3.3). If there is at least one mapped landmark in a cell, no new landmark is selected; if not, the point that has the highest Harris low eigenvalue λ2 is selected as a landmark. This ensures a quite good regularity in the observation space (the image plane). Map management. In a first stage, all the landmarks are integrated in the map. The corresponding observations are helpful to estimate the pose of the robot in the short-term. Once a feature is not matched anymore (either because it is out of the field of view or is not tracked), the associated landmark is only valuable for a future loop closing: in the meantime it only consumes computational resources. A successful loop closing does not 40
Chapter 3. Results on real data
Figure 3.3: Selection of the points that will be kept as landmarks (green squares) require many landmarks, only a few good ones are necessary: our strategy is to keep the landmark density under a given threshold (one landmark per 0.83 m3 in the experiments), the least observed landmarks being simply thrown away.
3.2.5
Loop closing.
Since no appearance model of the landmarks is memorised, an image database is built to achieve loop-closings: single images are stored every time the robot travels a given distance, along with the corresponding estimated robot pose and feature IDs. This database is periodically searched for a possible loop-closing on the basis of the current estimate of the robot position. For that purpose, a loose test between the current robot pose and the stored images positions is sufficient: one of the strengths of the matching algorithm is that it is able to match points with no knowledge of the relative transformation between the images. When a loop-closing detection occurs, the corresponding image found in the database and the current image are fed to the matching algorithm, and successful matches are used to update the stochastic map.
3.3
Results with a perspective camera
This section presents results obtained using data acquired with Dala. For the bearings-only SLAM, only the left images of the stereo pairs are used.
3.3.1
On a small trajectory
Data acquired along a simple 3-loops circular trajectory with a diameter of 6 meters provide insights on the behaviour of the algorithms. Two sets of data are compared here: one with the camera heading forward, and one with the camera heading sidewards. 41
3.3 Results with a perspective camera 0.16
200
camera sidewards camera frontward
160 0.12 number of landmarks
sum of translation std. dev. (m)
boSLAM sidewards boSLAM frontward
180
0.14
0.1 0.08 0.06
140 120 100 80 60
0.04 40 0.02
20
0
0 0
100
200
300
400
frame index
500
0
100
200
300
400
500
frame index
Figure 3.4: Comparison of the estimated uncertainty on the robot pose (left) and on the map size (right) with the camera looking forward and sidewards. Figure 3.4 illustrate the evolution of the estimated robot pose standard deviations and number of mapped landmarks. They exhibit the usual loop-closing effects of SLAM: the uncertainty on the robot pose dramatically drops after the first lap, and the number of mapped landmarks stops growing once the first loop is closed. Figure 3.5-left shows the correct behaviour of our simple loop-closing procedure: the loop-closing is correctly detected, and landmarks from the map are matched against the current image. The plots also exhibit a better performance with the sidewards setup than with the forward setup. Indeed, when the cameras are looking sidewards, the features are tracked on more frames: the mapped landmarks are more often observed, and fewer landmarks are selected. And in the bearings-only case, the sidewards setup yields a greater baseline between consecutive images, the landmarks are therefore initialised faster. Finally, figure 3.5-right illustrates the good performance of the interest point matching algorithm: more than 700 points are tracked in consecutive images. For the loop-closing, the algorithm also performs very well, but this is an easy case since images are acquired from very close positions.
3.3.2
On a longer trajectory
Results are now presented on data acquired on a 100 meters long trajectory during which two loop closures occur, the cameras are oriented sidewards. The trajectory of the robot is presented on figure 3.6-left. The results of boSLAM on this dataset are included in the following video: http://www.laas.fr/~tlemaire/publications/lemaireBoSLAMVideo. mp4 Qualitative results. Figure 3.8 presents an overview of the map obtained with bearingsonly SLAM at different points of the trajectory. The landmarks uncertainties obviously drop after the loop-closing process has successfully matched already mapped features: 42
Chapter 3. Results on real data 12
900
loop closing detection loop closing landmarks
consecutive images loop-closing images
800 number of matched features
number of landmarks
10
8
6
4
700 600 500 400 300 200
2 100 0
0 0
100
200 frame index
300
400
500
0
100
200
300
400
500
frame index
Figure 3.5: Left: loop-closing detection and number of landmarks in the map detected in the database image. Right: performance of the interest point matching algorithm on consecutive images and on loop-closing pairs. figure 3.6-right shows when a loop-closing event is detected and the number of landmarks successfully matched. Figure 3.7 shows in images the features used by boSLAM, after the second loop has been closed. Blue features are the ones that have been mapped during the beginning of the trajectory and that are “recovered” by the loop-closing process: note that the predicted observations are consistent with the real observations, the detected features lie in the ellipses that represent their 3σ prediction. Loop-closing errors. The ground truth of the pose of the natural landmarks which are introduced in our map is difficult to obtain. No ground truth of the robot pose is available either. Instead, a precise measure of the robot pose can be obtained when the robot closes a loop, applying a visual motion estimate algorithm on stereo images. The technique is presented later in section 3.4.2. √ Table 3.1 gives the SLAM errors on the robot pose estimate. The translation error of 0.252 + 0.142 + 0.032 = 0.29 meter corresponds to an error of less than 0.5% of the travelled distance for this 100 meters trajectory. Nevertheless, one can notice that these errors are not consistent with the covariance estimated by the filter, some errors exceed the 3σ bound. As shown in section 2.3.4, bearings-only SLAM is very sensitive to the prediction input: this is the only metric data in the system which therefore sets the scale of the robot trajectory and of the estimated map. On the ATRV Dala, the non-suspensed non-orientable wheels are often slipping, which yields poor odometry motion estimates (figure 3.6). A Gaussian error model for this odometry is not well-adapted: this is certainly the main source of inconsistency here.
3.4
Vision-based SLAM using a panoramic camera
Thanks to their 360◦ field of view, panoramic cameras have various advantages over perspective cameras for the SLAM problem. Features can be tracked over long distances and 43
3.4 Vision-based SLAM using a panoramic camera
8
16
odometry only boSLAM
6 4
12 number of matches
2 y (m)
loop closing detection (y/n) boSLAM
14
0 -2 -4
10 8 6 4
-6
2
-8 -10 -5
0
5
10 x (m)
15
20
25
0 400
450
500
550
600
650
700
frame index
Figure 3.6: Left: trajectories obtained by odometry integration and estimated with boSLAM. Right: loop-closing detection and number of landmarks in the map detected in the database image.
Figure 3.7: Loop closing: matched features between the current image (left) and the image from database (right) are indicated in blue.
44
Chapter 3. Results on real data
Figure 3.8: Orthogonal projection of the landmarks (3σ ellipses) just before closing the first loop (top-left), just after the first loop (top-right), in the middle of the second loop (bottom-left) and at the end of the trajectory (bottom-right). The yellow grid has a step of 1 meter.
45
3.4 Vision-based SLAM using a panoramic camera Loop 70/463 x y z yaw pitch roll
odometry error 3.71 1.55 0.16 43.2 1.7 0.03
boSLAM error std. dev. 0.25 0.01 0.14 0.03 0.03 0.02 2.3 0.2 0.4 0.3 0.08 0.2
Table 3.1: Errors made by boSLAM between frames 70 and 463 (distances in meter, angles in degree). therefore the estimation process is very well conditioned by numerous observations of the same landmark. It also gives the possibility to map distant landmarks as they can be observed from distant robot positions. In spite of these advantages, very few bearings-only SLAM algorithms have been applied with a panoramic camera. The initialisation method based on a bundle adjustment presented in [DH00] has been tested with panoramic images: results on a short sequence (91 images) acquired with a robot moving on a plane are presented in [Dea02]. Some articles on metric localisation using panoramic images have been published. In [CSS04] a visual odometry algorithm is developed, making the assumption that the ground is flat. Nice results with a rover moving in a desert are presented. A global localisation algorithm based on a particle filter is proposed in [ATD05]. A map of SIFT features extracted from panoramic images is first build based on a standard 2D SLAM which exploits a laser range finder. Then successful localisation is demonstrated using panoramic images only. The domain where panoramic images are the most popular in robotic is certainly qualitative localisation. In the vision community, a large number of well founded approaches to image indexing have recently been proposed2 . Many of them have been exploited with panoramic images in robotics to tackle the place recognition problem, a problem often associated with qualitative or topological localisation, for example in [GL02, LTG+ 03, CLIM05]. Some elements from the previous section are used almost unchanged: • The same Harris corners with the same tracking and matching algorithm is used. Although it has been developed for perspective images, it works in a satisfactory way on panoramic images (see figure 3.9). • The feature management process and the map management process described in 3.2.4 are also used here. The geometry of image cells is adapted to panoramic images as illustrated in figure 3.9. The other parts of the whole system are described in the following sections: 2
46
Progress in this area is mainly driven by image database management applications.
Chapter 3. Results on real data
Figure 3.9: Results of the interest point matching algorithm applied on panoramic images in the case of consecutive images (top), and in the case of significantly different points of view (middle). Bottom: Selection of the features that enters the boSLAM process. 47
3.4 Vision-based SLAM using a panoramic camera • The analytical model we used for the panoramic camera is given in section 3.4.1. • Section 3.4.2 describes the stereo-vision based ego-motion estimation algorithm which have been implemented. • The crucial loop closing mechanism adopted here is described in section 3.4.3. • Calibration issues which are often taken for granted are discussed in section 3.4.4.
3.4.1
Panoramic camera model
EKF based SLAM requires the observation model h() and its inverse g() of the panoramic camera, as well as the Jacobian matrix of these functions. Only Analytical expressions of these functions are given in the following, the Jacobian matrix being computed using classic calculus methods. The “general central projection systems model” proposed by Barreto in [Bar03a] is used in this work. A non-linear transformation depending on the mirror of the catadioptric system is first applied on the incoming rays, followed by a standard perspective projection3 : √ x2 +¯ y2 ) −¯ z ξ− z¯2 +(1−ξ 2 )(¯ √ x x¯ µ ¶ x2 +y 2 +z 2 x √x¯22 +¯y2 +¯z22 2 2 √ y u )(¯ x +¯ y ) h y = P Mc g = −¯zξ− z¯ 2+(1−ξ y ¯ x2 +y 2 +z 2 2 +¯ 2 x ¯ +¯ y z v √2 z z 2 2 2 √ x +¯ y ) −¯ z ξ− z¯ +(1−ξ )(¯ −ξ 2 2 2 z¯ + ξ x +y +z x ¯2 +¯ y 2 +¯ z2 with (x, y, z)T a 3D point in the camera frame, (u, v)T a 2D point in the image plane, and: αu 0 u0 ξ−φ 0 0 x¯ u y¯ = Mc−1 P −1 v ξ − φ 0 P = 0 α v v0 Mc = 0 0 0 1 0 0 1 z¯ 1 p Our mirror is a parabola with equation x2 + y 2 + z 2 = z +2p, in this case the Barreto model gives ξ = 1 and φ = 1 + 2p. The parameters p, u0 , v0 , αu , αv are obtained after a calibration process (See section 3.4.4).
3.4.2
Ego-motion estimation
Visual Motion Estimation. With a stereo-vision bench, the motion between two consecutive frames can easily be estimated using the interest point matching algorithm [MLG00, OMSM00]. Indeed, the interest points matched between the image provided by one camera at times t and t + 1 can also be matched with the points detected in the other image (figure 3.10): this produces a set of 3D point matches between time t and t + 1, from which an estimate of the 6 displacement parameters can be obtained (we use the least square fitting technique presented in [AHB87] for that purpose). A more detailed description of the mathematical basis can be found in appendix B. 3
48
Camera lens distortions are omitted here.
Chapter 3. Results on real data
left (t)
right (t)
left (t + 1)
right (t + 1)
Figure 3.10: Illustration of the matches used to estimate robot motion with stereo-vision images, on a parking lot scene. The points matched between the stereo images are surrounded by green rectangles. The robot moved about half a meter forward between t and t + 1, and the matches obtained between the two left images are represented by blue segments.
49
3.4 Vision-based SLAM using a panoramic camera The important point here is to get rid of the wrong matches, as they considerably corrupt the minimisation result. Since the interest point matching algorithm generates only very scarce false matches, we do not need to use a robust statistic approach, and the outliers are therefore simply eliminated as follows: 1. A 3D transformation is determined by least-square minimisation. The mean and standard deviation of the residual errors are computed. 2. A threshold is defined as k times the residual error standard deviation (k should be at least greater than 3). 3. The 3D matches whose error is over the threshold are eliminated. 4. k is set to k − 1 and the procedure is re-iterated until k = 3. This approach to estimate motions yields precise results: with the rover Dala, the mean estimated standard deviations on the rotations and translations are of the order of 0.3◦ and 0.01m for about half-meter motions (the error covariance on the computed motion parameters is determined using a first order approximation of the Jacobian of the minimised function [HJL+ 89]). In the scarce cases where VME fails to provide a motion estimate (e.g. when the perceived area is not textured enough to provide enough point matches), the 3D odometry estimate is used. Ground truth. In the absence of precise devices that provide a reference position (such as a centimetre accuracy differential GPS), it is difficult to obtain a ground truth for the robot position along a whole trajectory. However, one can have a fairly precise estimate of the true rover position with respect to the starting position when it comes back near the starting position at time t, using the VME technique applied to the stereo pairs acquired at the starting and current positions. VME then provides the current position with respect to the starting point, independently from the achieved trajectory: this position estimate can be used as a “ground truth” to estimate SLAM errors at time t.
3.4.3
Loop closing
The loop closing is one of the weakness of our previous approach: it is detected on the basis of the current robot pose estimate. Because large scale SLAM is prone to yield inconsistent position estimates, it is of crucial importance to have means to detect loop closing situations that is independent from the position estimates. In [NCH06] a similarity measure between two images is defined. A sequence of monocular images acquired by the robot is registered and a similarity matrix is built to detect loop closures. Panoramic images are very well suited for this detection, as they easily allow the application of any image indexing technique to solve this problem. In this work, we use an indexing technique which was previously developed at LAAS in [GL02]. The principle of 50
Chapter 3. Results on real data 0.8
Index Distance
0.7
0.6
0.5
0.4
0.3
0.2
0.1
0
0
0.5
1
1.5
2
2.5
3
3.5
4
4.5
5
Distance [metres]
Figure 3.11: Evolution of the distance in the images index space as a function of the Euclidean distance between their viewpoints (mean and standard deviation, computed on thousands of panoramic image pairs) in [GL02]. this approach is the following: as it navigates, the rover continuously collects panoramic views of its environment and builds a database of image indexes, i.e. a set of characteristics computed on the images (learning phase). The characteristics computed are statistics (sets of histograms) of the local characteristics defined by the first and second Gaussian derivatives responses of the images, that prove to have good invariance properties. After a long traverse, when the rover arrives nearby an already crossed area, a newly perceived image is matched with the stored ones using a distance in the index space (query phase – the distance is based on χ2 statistics between the sets of histograms, considered as probability density functions). To reduce both the storage memory and the recognition computation time, it is worthwhile to reduce the number of stored images: a simple way to achieve this is to discard the images that are similar, using the distance between image index as a criterion. Also, when used in a SLAM context, the search process can be focused on the basis of the current robot pose estimate – even if it is a coarse one. The algorithm can efficiently find among a database of hundreds of images the closest image, “closest” being defined here in the index space. It happens that for Euclidean distances on the order of a few meters, there is a quite strong correlation between the index distance and the point of view distance. Figure 3.11 presents statistics obtained with thousands of image pairs that exhibit this fact, which is exploited here to determine whether a loop has been closed or not. Figure 3.12 summarises the processes that are applied to each panoramic image every time they are acquired: the Harris interest points are extracted, and the histograms that index the image database are computed. Of course, the fact that both computations rely on the determination of Gaussian derivatives computed on the image allows efficient processing of the images. The rest of the algorithm is presented in figure 3.13: first, feature points detected at 51
3.4 Vision-based SLAM using a panoramic camera
Raw image
Apply mask
Compute Gaussian derivatives
Detect Harris points
Compute histograms
Figure 3.12: Processes involved every time a panoramic image is acquired.
52
Chapter 3. Results on real data Histograms (t)
Harris corners (t)
Features (t-1)
Track features
Query DB
Update DB
(k,d) d>dl
Loop ?
DataBase
d