Sound Source Localization on a Fast Rotating Fan Using Rotational Beamforming Michael KERSCHER1; Gunnar HEILMANN1; Dr. Christof PUHLE2; Dr. Ralph KRAUSE3; Christian FRIEBE3 1
gfai tech GmbH, Germany 2
3
GFaI e.V., Germany
Institut für Luft- und Kältetechnik Dresden gGmbH, Germany
ABSTRACT Delay and sum beamforming with spaced microphone arrays is a common and well-known method for sound source localization. Nevertheless, sound sources on fast rotating fans, rotors, blades and wheels are difficult to be identified due to the high rotational speed. Furthermore, optical cameras with very high speed shutters have to be used in order to have a chance to optically resolve the acoustic image. Fans have a mayor contribution to the overall sound emission in air flow systems. Therefore, it is of utmost interest to understand their acoustical behavior as a starting point for sound design and noise minimization. This paper introduces a rotational beamforming method employing a microphone array with virtual rotation corresponding to the rotation speed of the source. It works as a filter on the temporal data and therefore allows for the utilization of all known beamforming algorithms in both the time and frequency domain. Its usage is demonstrated and evaluated on a fan test stand. The objective is to minimize the noise emission while the energy efficiency remains as good as it is. Measurements with a multi-channel ring array were performed. They prove that this method is capable of resolving various sound sources on the fan at different frequencies and at different locations on the blades. Keywords: Beamforming, Rotational Beamforming, Fan Noise, Sound Source Localization, Microphone Array, Axial Fan
1. INTRODUCTION Spaced microphone arrays – so-called Acoustic Cameras – use the delay of sound from the source to the different microphone positions on the array for calculating the sound pressure level on reference points on the source. Using a delay stage sound arriving at the microphones is shifted according to the corresponding delays. The signals are summed up and divided by the number of channels in order to obtain the sound pressure level at the reference point. The method is therefore called “Delay-and-Sum-Beamforming”. The reference picture points are colored according to the sound pressure level. The process is repeated for all reference points and thus the so -called acoustic image or acoustic map is created which depicts the main sound sources on the measurement object. This technique is well known and Acoustic Cameras have been providing outstanding results with localizing sound sources for many years. Heilmann, Boeck and Doebler (1) describe the basic technique and provide details on limits and expectation of sound source localization. Comprehensive research on array design has been carried out by Schulze, Sarradj and Zeibig (2) and Sarradj (3). Acoustic Cameras have a huge field of applications and they are well documented in literature (see, e.g., (4–6) for recent work). Calculation methods and algorithms are constantly evolving. Recent work can be found in (7) and (8). 1 2 3
[email protected];
[email protected] [email protected] [email protected];
[email protected]
Fast rotating fans, rotors and blades induce noise by different aero-acoustical mechanisms. These mechanisms are dived into primary, secondary and tertiary sources. While primary sources are the results of instabilities in the moving fluid, secondary sources belong to structural sources and tertiary sources are results of electronical devices or bearing ball movements (12, 13). The object ive of the current project is the detection of primary sources with significant influence on the measurement. The noise spread is characterized by a broad band noise behavior with single peaks according to the rotational speed. In general, this noise is constant over time and depends upon the rotational speed. Thus, a long integration interval is desired for a high resolution in the space and frequency domain. Nevertheless, when evaluating and visualizing the sound field of rotating sources, the integration interval has to be chosen very narrow in order to be able to resolve the acoustic sources at the correct positions. Otherwise, the source will be strongly distorted and be depicted as a circle after one complete rotation latest. Furthermore, this leads to a poor resolution in the frequency domain. An additional high speed camera has to be employed in order to obtain a suitable optical image of the rotating device. This paper introduces a method to avoid these issues, the so called rotational beamforming. It provides a highly increased accuracy of both the acoustic and optical images of rotating sources and therefore allows for a higher resolution in the space and frequency domain. The technique – which is implemented as a temporal filter – uses a virtual array rotation corresponding to the rotational speed and is described in section 2. The challenging task of a fan in air duct systems is driving a designed air flow rate against an occurring pressure drop. This task has to be carried out with a high efficiency while having low sound emissions. Contra-rotating fans are, due to the working principle, promising with respect of their efficiency and power density. However, they are prone to higher noise emissions (10, 11). A contra-rotating fan consists of two different blades rotating in opposite directions with differen t rotational speeds and different number of impeller vanes (9). A test stand at ILK Dresden helps to evaluate different influencing factors. Different rotors, tubes and end pieces can be mounted in order to test their influence on the performance. Section 3 provides an overview of the test stand and the basic measurements on a single stage fan are conducted. An Acoustic Camera was employed at the test stand in order to evaluate the rotational beamforming filter. Measurements with different settings were car ried out. The array must be placed centric and parallel to the rotor for a correct application. Measurement setup and results are presented in section 4.
2. Rotational Beamforming 2.1
Functional Beamforming
Let M be the number of microphones of a phased array and C C MxM the corresponding matrix of auto- and cross-spectra resulting from an averaged short-time FFT of a measurement. Then, in the frequency domain formulation of delay-and-sum beamforming (FDBF), the map value at a point xi R 3 is given by Bxi h H xi Chxi ,
(1)
where the superscript H denotes the conjugate transpose and hxi C is the steering vector of type M
I of xi (see (23)). The auto-spectra in the diagonal of C do not contain any information about phase differences between the signals. Consequently, they are often removed in order to reduce the error introduced by uncorrelated background noise. Caused by fundamental properties of the beamforming approach and the chosen array geometry, the map B is a convolution of the actual source distribution with a point spread function leading to high side-lobe levels and limiting the dynamic range of the acoustic map. To overcome this problem deconvolution methods have been proposed to decompose C into parts representing individual sources (see (21), (22) and (24)). Among them, functional beamforming (FB) is particularly useful to increase the dynamic range. In addition, it allows for a combination with the decomposition approach of orthogonal beamforming (OB).
Since C is self-adjoint by definition, there exist 1,...,M R and an orthogonal basis u1,...,uM C M such that
C
M
mumumH .
(2)
m 1
Each summand mumumH C MxM is called component of C. Suppose that C is positive definite. Then 1,...,M 0 and 1
C v :
M
1
v mumumH
(3)
m 1
is well defined for v N , v 1 . Now the value of the functional beamforming map of order v at x i can be defined as v
1 H B xi : h xi C v hxi . v
(4)
In many cases throughout this article we assume 1 ... M and consider only the first
N , 1 components, i.e. we use the reduced functional beamforming map Bv of order v: v
1 1 1 H v v B xi : h xi C hxi , C : v m u m u mH . m1 v
(5)
2.2 Rotating Virtual Array The methods of the previous section are based on the assumption that the phased array and the measured object are fixed spatially to each other. Since this is obviously not the case when measuring a rotating fan, we determine the signals of a virtual microphone array that is fixed in the coordinate v system of the fan. For each point in time t let p1v (t ),....,pM (t ) R3 denote the microphone positions of the virtual array in the coordinate system of the array measurement at p1,...., pM R3 . The signal value siv (t0 ) of the i-th virtual microphone at t0 is determined as follows. We compute the two nearest
neighbors p k, pl of piv (t0 ) among the measurement positions and set
s t0 v i
pk piv t0 2 sl t0 pl piv t0 2 sk t0 pk piv t0 2 pl piv t0
(6) 2
where s j (t0 ) denotes the signal value of the j-th measurement microphone at t0.
3. The Test Stand 3.1
Design parameters of the fan rotors As this project aims to the detection of acoustical sources on a contra-rotating fan, a single stage fan is measured in the first step. There are three different design samples under examination. The first one is a “standard” vane with a sweep at the leading edge in forward direction. The second sample uses the same vanes but with serrations at the trailing edge (13, 14). The last sample has the same vane s profile as the first and second ones but with sinusoidal modification at the leading edge (15 –19). The parameters are presented in Table 1. Fan characteristic performance measurements were carried out on a separate test stand according to –ISO –5801 (20).
Parameter
Sample 1
Sample 2
Sample 3
Hub Diameter [mm]
114
114
114
Fan Diameter [mm]
299
299
299
Number of Vanes [--]
5
5
5
Rotation Speed [s-1]
32
32
32
Volume flow [m s ]
0.5083
0.4861
0.4889
Static pressure rise [Pa]
98
94
96
3 -1
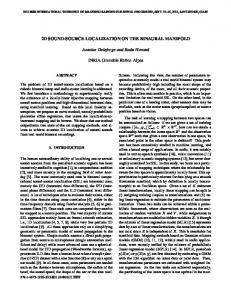
Table 1 – Parameters of the examined rotor blade (design studies) Fig. 1 shows pictures of these different blades.
Figure 1 – Design studies under examination, always viewed from the pressure side (a.) Sample 1 with “standard” vanes, b.) Sample 2 with serrations at the trailing edge and c.) Sample 3 with a sinusoidal leading edge) 3.2 Description of the test stand The measurements were carried out at a test stand according to ISO –5081. Category –B as mode of installation was selected, implying that there is a pipe at the suction side and a free outlet at the pressure side of the fan. A schematically drawing of the test stand is presented in figure 2. To meet the design point of fan operation the pressure drop is adjustable by means of a throttle valve. The flow rate was measured by means of the inlet nozzle and the static pressure rise utilizing the static pressure difference at the suction side of the fan against the environment. The rectifier was installed to achieve a constant and equal velocity profile. The silencer is employed for reducing disturbances by reflection of noise towards the suction side of the fan. The fan was hold by a 4-arm hub.
Figure 2 – schematically drawing of the test stand
4. Results The method as described in section –2 was evaluated on the test stand as introduced in section –3. An Acoustic Camera was placed at a distance of 0.75 m looking directly towards the pressure side of the fan (see figures –2 and –3). In order to receive precise results an accurate positioning of the array is needed. A concentric relationship between the microphone ring and the air duct as well as parallel relationship between the plane of the fan outlet and the plane of the microphones had been established by measuring and adjusting the distances between the hub center and the microphones. As the rotational beamforming algorithm uses a virtual microphone rotation symmetric array geometries shall be preferred. A 48-channel ring-array with a diameter of 0.75 m was used here. The rotation speed of the fan was recorded with a laser rpm-meter.
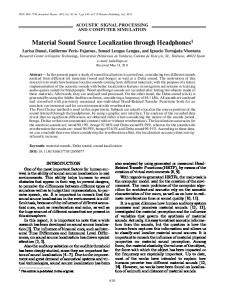
Figure 3 – Acoustic Camera measurements on the test stand Measurements were taken at constant speeds of 32 s-1 with a measurement time of 64 seconds. Evaluations have been done in the frequency domain applying the rotational filter on the temporal data in advance. This document shows results for fan sample 1 exemplarily. Figure –4 compares standard beamforming without the rotational filter, with rotational filter and FDBF and with rotational filter and functional beamforming for the 5 kHz third octave band. Figure –5 compares the results for various third octave bands applying functional beamforming.
Figure 4 – acoustic map of the rotating fan for the 5 kHz third octave band; left: without rot. BF; middle: with rot. BF and FDBF; right: with rot. BF, OBF and FB
2,5 kHz
3,15 kHz
4 kHz
5 kHz
8 kHz 6,3 kHz Figure 5 – acoustic map of the rotating fan for various third octave bands with the rot. Filter using OBF and FB
5. CONCLUSIONS The introduced rotational beamforming algorithm solves the problem of sound source localization on fast rotating sources. Measurements on a fan test stand prove its usability and accuracy. For proper results concentric and parallel positioning of the array is urgently needed. Therefore this method is not usable yet for measurement situations where such an alignment is not realizable, like for huge wind turbines. Acoustic images of the measured fan show various sources on the blades. Thus it is the basis for the evaluation and optimization of the sound characteristics of different blade designs . This is the objective of future work on the test stand as well as on contra-rotating fans and the adaptation of the algorithm for oblique measurements.
ACKNOWLEDGEMENTS The authors would like to thank Mr. Sven Rossol for his contributions to the measurements. The research project is funded by the German Federal Ministry of Economic Affairs and Energy (BMWi) under the title “Primary noise reduction on a contra-rotating axial fan” (MF150166)
REFERENCES 1. Heilmann G., Doebler D., Boeck M.: Exploring the limitations and expectations of sound source localization and visualization techniques; INTER.NOISE 2014; 16-19 November 2014, Melbourne, Australia 2. Schulze C., Sarradj E., Zeibig A.: Unterschiedliche Mikrofonanordnungen bei praktischen Arraymessungen; DAGA 2005; 14-17 March 2006, Munich, Germany 3. Sarradj E.: A Generic Approach to Synthesize Optimal Array Microphone Arrangements; BeBeC 2016; Berlin, Germany 4. Boeck M., Vonrhein B., Mehlhaff M., Meyer U.: The Acoustic Camera as a tool for machinery maintenance; INTER.NOISE 2015; 9-12 August 2015, San Francisco, USA 5. Kerscher M., Vonrhein B., Heilmann G., Barré S., Weigel P.: Measurement and Visualization of Room Impulse Responses with Spherical Microphone Arrays; Tonmeistertagung 2016; 17-20 November 2016, Cologne, Germany 6. Bradley S., Kerscher M., Mikkelsen T.: Use of the Acoustic Camera to accuratelty localise wind turbine noise sources and determine their Doppler shift; 7th International Conferenc on Wind Turbine Noise; 2-5 May 2017, Rotterdam, Netherlands 7. Doebler D., Puhle C., Heilmann G.: Correlation of high channel count beamforming measurement of a car in a wind tunnel using CLEAN-SC; INTER.NOISE 2015; 9-12 August 2015, San Francisco, USA 8. Schmidt S., Doebler d.: Visualization of small design modifications using differential beamforming; INTER.NOISE 2015; 9-12 August 2015, San Francisco, USA 9. Heinrich M., Friebe C., Schwarze R.: Experimental and numerical investigation of a gearless one-motor contra-rotating fan, Proceedings of the Institution of Mechanical Engineers, Part A: Journal of Power and Energy, Vol 230, Issue 5, pp. 467 - 476, 2016, doi: 10.1177/0957650916633014 10. Krause, R., & Friebe, C.: Axial-Kompaktlüfter mit hoher Leistungsdichte. Conference: 22nd International Scientific Conference Mittweida, 2014, doi: 10.13140/2.1.1127.1366
11. Wang J, Ravelet F and Bakir F. Experimental comparison between a counter-rotating axial-flow fan and a conventional rotor-stator stage. In: 10th European turbomachinery conference, Lappeenranta, Finland, 2013. 12. Bommes, L. at al: Ventilatoren, Vulkan-Verlag Essen, 1994, ISBN 3-8027-2170-5 13. Carolus, Th.: Ventilatoren – Aerodynamischer Entwurf, Schallvorhersage, Konstruktion. 3. Auflage, Springer Vieweg, 2013, ISBN 978-3-8348-2471-4 14. Catalano, F.M.: Airfoil self Noise Reduction by Application of different Types of Trailing Edge Serrations, 28th International Congress of the Aeronautical Sciences, 2012 15. Corsini, A. and Delibra, G: Leading Edge Bumps in Ventilation Fans, Paper No. GT2013-94853, pp. V004T10A007, 2013, doi:10.1115/GT2013-94853 16. Hansen, K. et al: Reduction of Flow Induced Airfoil Tonal Noise using leading edge sinusoidal modifications, Acoustics Australia 172 - Vol. 40, No. 3, December 2012 17. Hersh, Alan S. et al: Investigation of Acoustic Effects of Leading-Edge Serrations on Airfoils, Journal of Aircraft 1974 11:4, 197-202, doi: 10.2514/3.59219 18. Polacsek, C. et al: Turbulence-airfoil interaction noise reduction using wavy leading edge: An experimental and numerical study, Internoise 2011, Osaka, Japan 19. Soderman, P.T: Aerodynamic effect of leading edge serrations a two-dimensional airfoil, NASA TM X-2643, 1972 20. ISO 5801:2011-11: Industrial fans - Performance testing using standardized airways (ISO 5801:2007, including Cor 1:2008) 21. R.P. Dougherty, Functional beamforming, Berlin Beamforming Conference 2014 (2014), 25 pages. 22. E. Sarradj, A fast signal subspace approach for the determination of absolute levels from phased microphone array measurements, Journal of Sound and Vibration 329 (2010), 1553-1569. "1 23. E. Sarradj, Three-Dimensional Acoustic Source Mapping with Different Beamforming Steering Vector Formulations, Advances in Acoustics and Vibration 2012 (2012), 12 pages. "1 24. P. Sijtsma, CLEAN based on spatial source coherence, International Journal of Aeroacoustics 6 (2007), 357-374. "1