... concentrated with respect to the signal and noise parameters. This results in that the DML DOA estimator is given by [Böh84, Wax85]. Ëθ = arg min θ. VDML(θ),.
Space-Time Parameter Estimation in Radar Array Processing FREDRIK ATHLEY Department of Signals and Systems School of Electrical Engineering chalmers university of technology G¨oteborg, Sweden 2003
Thesis for the degree of Doctor of Philosophy
Technical Report No. 452
Space-Time Parameter Estimation in Radar Array Processing by
Fredrik Athley
Department of Signals and Systems School of Electrical Engineering Chalmers University of Technology G¨oteborg, Sweden 2003
Space-Time Parameter Estimation in Radar Array Processing Fredrik Athley ISBN 91-7291-300-2 This thesis has been prepared using LATEX. c Fredrik Athley, 2003. Copyright � All rights reserved. Doktorsavhandlingar vid Chalmers tekniska h¨ogskola Ny serie nr 1982 ISSN 0346-718X Technical Report No. 452 School of Electrical Engineering Chalmers University of Technology ISSN 1651-498X Signal Processing Group Department of Signals and Systems School of Electrical Engineering Chalmers University of Technology SE-412 96 G¨oteborg, Sweden Telephone: + 46 (0)31-772 1000
Front cover : The surface is the asymptotic maximum likelihood criterion function for the problem of finding the directions of arrival with a sensor array. The highest peak in this function is at the true directions. The other peaks are sidelobes due to near-ambiguities in the spatial transfer function. For a finite number of measured data samples, noise may cause one of these sidelobes to become the global maximum, resulting in a large estimation error. The estimates obtained by finding the global maximum in a noisecorrupted version of this function are plotted as red dots. Most estimates are around the mainlobe but there are also clusters around the sidelobe peaks. See Chapter 10 in this thesis for further details. Printed by Vasastadens Bokbinderi G¨oteborg, Sweden, May 2003
To Johanna, Jonathan, and Emelie
Abstract This thesis is about estimating parameters using an array of spatially distributed sensors. The material is presented in the context of radar array processing, but the analysis could be of interest in a wide range of applications such as communications, sonar, radio astronomy, seismology, and medical diagnosis. The main theme of the thesis is to analyze the fundamental limitations on estimation performance in sensor array signal processing. To this end, lower bounds on the estimation accuracy as well as the performance of the maximum likelihood (ML) and weighted least-squares (WLS) estimators are studied. The focus in the first part of the thesis is on asymptotic analyses. It deals with the problem of estimating the directions of arrival (DOAs) and Doppler frequencies with a sensor array. This problem can also be viewed as a two-dimensional (2-D) frequency estimation problem. The ML and WLS estimators for this problem amount to multidimensional, highly nonlinear optimization problems which would be expensive to solve in real-time in a radar system. Therefore, simplifications of this problem are of great interest. It is shown in this thesis that, under some circumstances, the 2-D problem decouples into 1-D problems. This means a dramatic reduction in computational complexity with insignificant loss of accuracy. The second part contains a performance analysis of the ML DOA estimator under conditions of low signal-to-noise ratio (SNR) and a small number of data samples. It is well known that the ML estimator exhibits a threshold effect, i.e. a rapid deterioration of estimation accuracy below a certain SNR. This effect is caused by outliers and is not captured by standard analysis tools. In this thesis, approximations to the mean square estimation error and probability of outlier are derived that can be used to predict the threshold region performance of the ML estimator with high accuracy. Moreover, these approximations alleviate the need for time-consuming computer simulations when evaluating the ML performance. Keywords: Sensor arrays, direction of arrival, Doppler frequency, two-dimensional frequency estimation, radar, lower bounds, sparse arrays, threshold effect, maximum likelihood, weighted least squares.
i
Contents
Abstract
i
Contents
iii
Acknowledgments
vii
Abbreviations and Acronyms
ix
Notation
xi
1 General Introduction 1.1 Background . . . . . . . . . . . . 1.2 Pulsed Doppler Radar . . . . . . 1.3 Sensor Arrays . . . . . . . . . . . 1.3.1 Spatial Data Model . . . . 1.3.2 Sparse Arrays . . . . . . . 1.3.3 Signal and Noise Models . 1.4 The Estimation Problem . . . . . 1.4.1 Estimation Accuracy . . . 1.4.2 Estimation Methods . . . 1.5 Motivation and Aim of the Thesis 1.6 Outline and Contributions . . . . 1.6.1 Publications . . . . . . . . 1.7 Topics for Future Research . . . .
iii
. . . . . . . . . . . . .
. . . . . . . . . . . . .
. . . . . . . . . . . . .
. . . . . . . . . . . . .
. . . . . . . . . . . . .
. . . . . . . . . . . . .
. . . . . . . . . . . . .
. . . . . . . . . . . . .
. . . . . . . . . . . . .
. . . . . . . . . . . . .
. . . . . . . . . . . . .
. . . . . . . . . . . . .
. . . . . . . . . . . . .
. . . . . . . . . . . . .
. . . . . . . . . . . . .
. . . . . . . . . . . . .
1 1 2 5 5 11 12 14 15 18 24 25 30 31
Part I: Asymptotically Decoupled Angle-Frequency Estimation with Sensor Arrays 34 2 Introduction 35 2.1 Background and Overview . . . . . . . . . . . . . . . . . . . . 35 2.2 Literature . . . . . . . . . . . . . . . . . . . . . . . . . . . . . 36 2.3 Problem Formulation . . . . . . . . . . . . . . . . . . . . . . . 38 3 Estimation Using the 2-D Model 3.1 General CRB for Parameterized Signals . 3.2 CRB for the 2-D Model . . . . . . . . . 3.3 Asymptotic CRB for the 2-D Model . . . 3.4 2-D Maximum Likelihood Estimation . . 3.5 2-D Weighted Least Squares . . . . . . . 3.6 Performance . . . . . . . . . . . . . . . . 3A Derivation of the 2-D CRB . . . . . . . . 3B Derivation of the Asymptotic 2-D CRBs
. . . . . . . .
. . . . . . . .
. . . . . . . .
. . . . . . . .
4 Estimation Using a Decoupled 1-D/1-D Model 4.1 CRB for the 1-D Models . . . . . . . . . . . . . 4.2 Asymptotic CRB for the 1-D Models . . . . . . 4.3 1-D/1-D Weighted Least Squares . . . . . . . . 4A Asymptotic Analysis of the 1-D/1-D Estimator
. . . . . . . .
. . . .
. . . . . . . .
. . . .
. . . . . . . .
. . . .
. . . . . . . .
. . . .
. . . . . . . .
. . . .
. . . . . . . .
. . . .
. . . . . . . .
. . . .
. . . . . . . .
45 45 47 48 51 54 56 57 60
. . . .
65 65 67 68 77
5 Computing the Estimates 87 5.1 Local Optimization . . . . . . . . . . . . . . . . . . . . . . . . 87 5.2 Computing Initial Estimates . . . . . . . . . . . . . . . . . . . 88 6 Numerical Examples and Simulations 91 6.1 Cram´er-Rao Bounds . . . . . . . . . . . . . . . . . . . . . . . 91 6.2 Performance of the WLS Estimators . . . . . . . . . . . . . . 93 7 Conclusions
97
Part II: Performance Analysis of DOA Estimation in the Threshold Region 100 8 Introduction 101 8.1 The Threshold Effect . . . . . . . . . . . . . . . . . . . . . . . 102 8.2 Performance Bounds . . . . . . . . . . . . . . . . . . . . . . . 104 8.3 Outline and Contributions . . . . . . . . . . . . . . . . . . . . 106 iv
9 ML 9.1 9.2 9.3
DOA Estimation of a Single Source Data Model And Problem Formulation . Approximation of the MSE . . . . . . . . Probability of Outlier . . . . . . . . . . . 9.3.1 Deterministic Signal Model . . . 9.3.2 Stochastic signal model . . . . . . 9.4 Simulation Results . . . . . . . . . . . . 9.4.1 Deterministic signal model . . . . 9.4.2 Stochastic signal model . . . . . .
. . . . . . . .
. . . . . . . .
. . . . . . . .
. . . . . . . .
. . . . . . . .
. . . . . . . .
. . . . . . . .
10 ML 10.1 10.2 10.3
DOA Estimation of Multiple Sources Data Model and Problem Formulation . . . . . . . . Approximation of the MSE and Probability of Outlier Deterministic Maximum Likelihood . . . . . . . . . . 10.3.1 Pairwise Error Probability . . . . . . . . . . . 10.3.2 Simulations . . . . . . . . . . . . . . . . . . . 10.4 Stochastic Maximum Likelihood . . . . . . . . . . . . 10.4.1 Pairwise Error Probability . . . . . . . . . . . 10.4.2 MSE Approximation . . . . . . . . . . . . . . 10.4.3 Simulation Results . . . . . . . . . . . . . . . 10A Proof of Theorem 10.2 . . . . . . . . . . . . . . . . .
11 Application Examples 11.1 DOA Estimation Using Separated Subarrays . . . . 11.1.1 Introduction . . . . . . . . . . . . . . . . . . 11.1.2 Data Model and Problem Formulation . . . 11.1.3 Performance Bounds . . . . . . . . . . . . . 11.1.4 Performance of Estimators . . . . . . . . . . 11.1.5 Conclusions . . . . . . . . . . . . . . . . . . 11A Derivation of CRB for separated sub-arrays . . . . 11.2 Optimization of Element Positions in Sparse Arrays 11.2.1 Introduction . . . . . . . . . . . . . . . . . . 11.2.2 Problem Formulation . . . . . . . . . . . . . 11.2.3 Optimization Method . . . . . . . . . . . . . 11.2.4 Comparison with other arrays . . . . . . . . 11.2.5 Conclusions . . . . . . . . . . . . . . . . . .
. . . . . . . . . . . . .
. . . . . . . .
. . . . . . . .
. . . . . . . .
. . . . . . . .
. . . . . . . .
111 111 113 116 119 121 122 123 130
. . . . . . . . . .
. . . . . . . . . .
. . . . . . . . . .
. . . . . . . . . .
135 . 135 . 136 . 137 . 138 . 143 . 150 . 152 . 156 . 159 . 167
. . . . . . . . . . . . .
. . . . . . . . . . . . .
. . . . . . . . . . . . .
. . . . . . . . . . . . .
. . . . . . . . . . . . .
171 171 172 175 176 183 191 192 195 195 196 197 201 203
12 Conclusions
205
Bibliography
221
v
Acknowledgments
This part of the thesis is probably the one that is read by most people. Unfortunately, since procrastination has been a salient feature of my work as a PhD student and this section is the last thing to write, there is not much time left before I need to run to the printing office. Nevertheless, I would like to seize this opportunity to thank some of the people who have meant a lot to me during my graduate studies; financially, intellectually, or emotionally. My work has been funded by Ericsson Microwave Systems under the Intelligent Antenna Systems research programme. I would like to thank Ericsson for so generously sponsoring my graduate studies. Special thanks to Dr. Ragnar Arvidsson and Ingmar Karlsson who enrolled me in the research programme. I would also like to thank Prof. Anders Derneryd for coordinating the project and Dr. Christer Engdahl for fruitful discussions related to Part II of this thesis. Next, my thanks go to my supervisor Prof. Mats Viberg for his encouragement and for sharing some of his brilliant expertise in signal processing. When you sometimes get stuck in problems that seem more or less hopeless, some people have the ability to lift you to a higher level and make everything seem so easy. Mats is certainly one of them. He has also the important ability of putting together a research group consisting of people that, in addition to being excellent researchers, you can have great fun with. I would like to thank all the people in the Signal Processing, Image Analysis, Circuit Design, and Medical Electronics groups for enjoyable coffee/tea breaks, lunches, and various after-work activities. I will really miss the nice and relaxed atmosphere we have in our corridor. Special thanks to Prof. Mats Viberg, Dr. Chris Brown, Patrik Bohlin, and Mikael Tapio for proofreading the thesis. Having my manuscript pass this eye of the needle feels safe for the defense. Finally, and most importantly, I would like to thank my family for love and inspiration. In particular, I thank my wife, Johanna, for an immense vii
amount of support and patience in the course of writing this thesis, and our children, Jonathan and Emelie, for just simply being the most important part of my life. I hope that all the effort behind this thesis has not just been for my own good, but that it will give, in one way or the other, something in return to you.
viii
Abbreviations and Acronyms
1-D 2-D AP BB CPI CRB DFT DML DOA EXIP FIM FFT LS MAP ML MLE MMSE MRA MSE MTI PDF PRI Radar RCS RMS RMSE SML SNR
One-Dimensional Two-Dimensional Alternating Projection Barankin Bound Coherent Processing Interval Cram´er-Rao Bound Discrete Fourier Transform Deterministic Maximum Likelihood Direction Of Arrival Extended Invariance Principle Fisher Information Matrix Fast Fourier Transform Least Squares Maximum A Posteriori Maximum Likelihood Maximum Likelihood Estimator Minimum Mean Square Error Minimum Redundancy Array Mean Square Error Moving Target Indication Probability Density Function Pulse Repetition Interval Radio Detection and Ranging Radar Cross Section Root Mean Square Root Mean Square Error Stochastic Maximum Likelihood Signal to Noise Ratio ix
STAP SVD ULA WLS WWB
Space-Time Adaptive Processing Singular Value Decomposition Uniform Linear Array Weighted Least Squares Weiss-Weinstein Bound
x
Notation
In the thesis, matrices and vectors are set in boldface, with upper-case letters used for matrices and lower-case letters for vectors. The meaning of the following symbols are, if nothing else is explicitly stated: AT
Transpose operator.
A∗
Complex conjugate.
AH
Hermitian transpose, i.e. complex conjugate transpose.
A†
The pseudo-inverse of A, i.e. A† = � H Moore-Penrose �−1 H A A A .
⊥ P⊥ A or ΠA
Orthogonal projection matrix onto the null space of ⊥ † AH , i.e. P⊥ A = ΠA = I − AA .
A1/2
Hermitian (i.e. (A1/2 )H = A1/2 ) square-root factor, i.e. A = A1/2 A1/2 .
Tr {A}
Trace operator.
|A|
Matrix determinant.
vec (A)
The column vector that is obtained by stacking the columns of A.
{A}ij �A�F
or aij
The (i, j)-th element of the matrix A. The Frobenius � norm, defined as � matrix �A�2F = Tr AAH . xi
A⊗B
The Kronecker product. For an N × M matrix A and a K ×L matrix B it is defined as the N K ×M L matrix a11 B · · · a1M B .. ... A ⊗ B � ... . aN 1 B · · ·
aN M B
A�B
The Khatri-Rao product, or column-wise Kronecker product. For an N ×M matrix A and a K ×M matrix B it is defined as the N K × M matrix � A � B � a1 ⊗ b1 . . . aN ⊗ bN where ak denotes the k-th column of the matrix A.
A�B
The Hadamard or Schur product, i.e. element-wise multiplication.
A>B
The matrix A − B is positive definite. Furthermore, A ≥ B means that A − B is positive semidefinite.
diag (a1 , . . . , aK )
A K × K diagonal matrix with diagonal elements a1 through aK .
Diag {A}
A column vector containing the diagonal elements of the matrix A.
Im
The m × m identity matrix. Frequently, the subscript m is omitted when there is no risk of confusion.
θˆ
An estimate of the parameter θ.
θ0
The true value of the parameter θ.
Re[·]
The real part of a complex quantity.
Im[·]
The imaginary part of a complex quantity.
E[·]
The expectation of a random variable.
an = o(gn )
an is of smaller order than gn , i.e. limn→∞ gn−1 an = 0.
an = O(gn )
an is at most of order gn , i.e. there exists a real number M such that gn−1 |an | ≤ M for all n.
an = op (gn )
The random variable an is of smaller order in probability than gn , i.e. for every � > 0 limn→∞ P (gn−1 |an | > �) = 0 xii
an = Op (gn )
The random variable an is at most of order in probability gn , i.e. for every � > 0 there exists a real number M such that P (|an | ≥ M gn ) ≤ � for all n.
x ∈ N (µ, C)
The random vector x is distributed as a normal random vector with mean µ and covariance matrix C.
x ∈ As N (µ, C)
The random vector x is asymptotically distributed as a normal random vector with mean µ and covariance matrix C.
1 t=s The Kronecker delta; δt,s = 0 t = s
δt,s arg min f (x)
The minimizing argument of the function f (x).
arg max f (x)
The maximizing argument of the function f (x).
log(x)
The natural logarithm of x.
x
x
N �
An
Union of the events An , n = 1, . . . , N .
An
Intersection of the events An , n = 1, . . . , N .
n=1 N � n=1
xiii
xiv
Chapter
1
General Introduction 1.1
Background
This thesis is about estimating unknown parameters using an array of spatially distributed sensors. Sensor arrays are used in a wide range of applications such as radar, passive sensors, sonar, communications, seismology, radio astronomy, medical diagnosis and chemical analysis. Sensor array signal processing has received tremendous interest in the literature over the past few decades, see e.g. [Far92, Hay95, HLE93, HRKV92, JD93, KV96, MM80, Nic87, Tre02] and the references therein. The motivation behind the work presented in this thesis stems from radar applications, but the models and techniques treated could be applicable to a wide range of applications. More specifically, this thesis deals with the problem of estimating the spatial and temporal frequencies of plane waves impinging on an array of antenna elements. This may also be viewed as a two-dimensional (2-D) frequency estimation problem. In radar applications the spatial frequency is related to the direction of arrival (DOA) from an object that is backscattering a fraction of the transmitted electromagnetic energy. The temporal frequency, or the Doppler frequency, is related to the relative speed between the object and the radar platform via the well known Doppler effect. In this chapter, a brief introduction to radar systems is first given. A parameterized mathematical model for the output of a sensor array is then derived. Further, we discuss different signal and noise models that are pertinent to the problems considered in this thesis. We also give a concise overview of the basic estimation methods used in sensor array signal processing and lower bounds on the estimation accuracy. The outline and the contributions of the thesis are then summarized. Finally, some suggestions for future research are provided. 1
CHAPTER 1. GENERAL INTRODUCTION
1.2
Pulsed Doppler Radar
In this section, a brief introduction to radar systems is given, with particular emphasis on the aspects that are important for reading this thesis. The interested reader is referred to [Bar88, NRC91, Sko86, Sko89] for a more comprehensive treatment. Radar systems are used for detecting objects and estimating their positions by transmitting electromagnetic signals and analyzing the backscattered signals from the objects. Estimation of a object’s range is enabled by transmitting short pulses and/or coded waveforms. A pulsed Doppler radar transmits a coherent burst of short pulses of a certain carrier frequency. The electromagnetic energy is concentrated to a particular spatial sector by transmitting with a focused beam. The beam can be created by a continuous aperture, e.g. a parabolic reflector, or an array of antenna elements. An object in the radar’s field of view backscatters a fraction of the transmitted energy, which is related to the object’s radar cross section (RCS) and the distance between the radar and the object. If the object or the radar platform is in motion, there will be a Doppler shift of the carrier frequency, proportional to the radial velocity between the object and the radar. An object’s DOA is traditionally determined by scanning a narrow beam over the search volume and monitoring the received signal energy. If the energy exceeds a certain threshold value, an object is detected and the DOA is given by the pointing direction of the beam. The distance to the object can be determined from the round trip delay of the transmitted pulse and the Doppler frequency may be estimated from the phase shift between successive pulses. Beam scanning can be achieved either mechanically by a rotating reflector antenna or electronically by a phased array. A phased array consists of many small antenna elements with a phase shifter behind each element. By progressively shifting the phase from one array element to the next, a beam is formed in a direction determined by the size of the phase shift. The main advantage with electronic beam steering is that it provides high agility and flexibility. Phased arrays have been used in radar systems since the 1950s. More recently, radar systems employing digital arrays have emerged. In a digital array, there is a receiver and an A/D converter behind each antenna element. Figure 1.1 depicts a signal processing view of the receiving part of a phased array and digital array system, respectively. For more details on phased arrays, the interested reader is referred to [Mai94]. In a digital array the beam steering can be performed by digital signal processors by simply multiplying the signal from each antenna element by a complex weight and then summing. Digital arrays provide even more 2
1.2. PULSED DOPPLER RADAR
Phased array
Digital array
Antenna elements
Antenna elements
Phase shifters
Phase shifters
Rx A/D
Rx A/D
Rx A/D
Rx A/D
Rx A/D
Rx A/D
Analog feed Signal Processing
Rx A/D
Signal Processing
Figure 1.1: Phased and digital arrays. flexibility than phased arrays since the complex weights need not produce simple, progressive phase shifts. For instance, directional interference can be rejected by computing weights such that the array beampattern has a null in the interference direction. More generally, a digital array provides the signal processors with spatial samples that can be used in more advanced parameter estimation methods. In this thesis, radar systems employing multiple receive antenna elements are considered. It is assumed that several digital outputs are available from the antenna array, either from analog subarrays or from each antenna element. Thus, the receive antenna performs spatial sampling of impinging electromagnetic wavefronts. This enables digital signal processing in the spatial dimension. The received signals are down-converted to baseband, matched filtered on a pulse-to-pulse basis and sampled by means of A/D converters. The samples thus obtained correspond to different distances to potential objects and are often referred to as range bins. This multidimensional data set can be visualized as a data cube, see Figure 1.2. Usually, we focus on a particular range bin and thus consider a 2-D space-time slice in the data cube, as illustrated in Figure 1.2. This slice consists of the spatial samples for all pulses at the current range bin. Within this 2-D subset we can perform spatial processing over the antenna elements and temporal processing over the pulses. The processing can be performed by joint 2-D methods or decoupled 1-D methods. Once residing in the 2-D space-time slice, the first problem is to decide if one or several objects are present in the selected range bin. If a detection is declared, different signal parameter estimates are produced that carry information about the objects. Such parameters include DOA, range, RCS, 3
CHAPTER 1. GENERAL INTRODUCTION
space-time slice
antenna element
range bin
pulse
Figure 1.2: The radar data cube. Doppler frequency, etc. Object parameter estimates are then fed to a Kalman filter bank used for tracking of the detected objects. In this thesis only the estimation problem is considered. More specifically we are interested in finding estimates of the DOAs and Doppler frequencies. Thus, we assume that the number of objects within a particular range bin has been estimated by some method, see e.g. [VOK91, WK85, Eri02]. The Doppler frequencies and DOAs are traditionally determined by performing temporal and spatial Fourier transforms respectively. In effect, a parabolic reflector antenna can be viewed as an analog spatial Fourier transform. The estimates are obtained from the peak in the corresponding periodograms. In radar terminology these processing stages are termed Doppler filter bank and beamformer respectively. However, it is well known that Fourier methods have a resolution that is limited to the inverse of the data length. For the problem at hand, this translates to a Doppler resolution limited to the filter width in the Doppler filter bank, and angular resolution limited to the antenna beamwidth. The limited resolution of Fourier based estimation methods is essentially due to that they are designed to estimate the parameters of one object at a time. Therefore, these methods will have poor resolution in a multiple object scenario. By utilizing a properly parameterized mathematical model of the multiple object scenario, the resolution can be improved dramatically (at least in theory). Estimation methods based on these more refined models are often referred to as model-based signal processing 1 . Although model-based methods can also be applied to phased arrays and reflector antennas [DL97], a digital array is required to take full advantage of the potential of these methods. It is of great interest to study model-based signal processing methods that do not suffer from the resolution limitations 1
One may think of the Fourier methods as model-based methods for single object scenarios.
4
1.3. SENSOR ARRAYS
of the traditional methods used in radar systems.
1.3
Sensor Arrays
In this section, a brief description of the data model used for the sensor array processing problem is given. A more detailed account can be found in ,e.g., [JD93, MM80, SM97, Tre02]. First we will present the basic spatial data model. This is a fairly general model that can be used in many applications. We then turn our attention to signal and noise models which are more application specific.
1.3.1
Spatial Data Model
Consider the scenario in Figure 1.3, in which K sensors receive waveforms from M point sources that are emitting, or backscattering, electromagnetic energy. The sources are assumed to be in the far field of the array, so that the Source 2 Source 1
Source M
…
…
Sensor K
Sensor 1
Sensor 2
Figure 1.3: A sensor array receiving plane wavefronts. wavefronts at the array can be considered to be planar. The sensors could be arranged arbitrarily in 3-dimensional space, but for ease of exposition it is assumed that the array and the sources are coplanar. This means that the directions to the sources can be characterized by the azimuthal angle 5
CHAPTER 1. GENERAL INTRODUCTION
only. Furthermore, it is assumed that the signal waveforms are narrowband around a known carrier frequency. We now derive a parameterized mathematical model of the sensor array outputs. To this end, consider an emitter signal x¯r (t) and express it as a modulated carrier according to x¯r (t) = α(t) cos[ωc t + φ(t)],
(1.1)
where α(t) is the amplitude, ωc the carrier frequency and φ(t) the phase. By narrowband we mean that α(t) and φ(t) vary slowly relative to the propagation time τ across the array, i.e. α(t − τ ) ≈ α(t) and φ(t − τ ) ≈ φ(t).
(1.2)
The analytic signal representation of x¯r (t) is given by x¯(t) = α(t)ejφ(t) ejωc t .
(1.3)
The information about the direction to an emitter is contained in the timedelays of the propagating wave between the different sensors. The narrowband assumption implies that x¯(t − τ ) = α(t − τ )ejφ(t−τ ) ejωc (t−τ ) ≈ α(t)ejφ(t) e−jωc τ ejωc t = e−jωc τ x¯(t).
(1.4)
This means that the narrowband assumption allows a time-delay of the signal to be modeled as a simple phase-shift of the carrier frequency. In each individual sensor, the received signal is demodulated by multiplying x¯(t) with e−jωc t . The signal x(t) = α(t)ejφ(t)
(1.5)
thus obtained, is referred to as the complex baseband signal. Now, let x(t) be the continuous-time complex baseband signal at some reference point. Without loss of generality, this reference point is assigned to the position of the first sensor. The noise-free output from the k-th sensor is modeled by yk (t) = hk ∗ x(t − τk ),
(1.6)
where hk is the impulse response of the k-th sensor, (∗) denotes convolution and τk is the travel time of the wavefront from the reference point to the k-th sensor. This travel time is a function of the DOA, θ, of the wavefront, i.e. 6
1.3. SENSOR ARRAYS
τk = τk (θ). The narrowband assumption implies that the Fourier transform, Hk , of hk is constant over the signal bandwidth. Under this assumption we get yk (t) = Hk (θ)e−jωc τk (θ) x(t),
(1.7)
where the argument θ in Hk (θ) accounts for a possible variation of the amplitude and phase response with the DOA θ. The sensor outputs are collected in the complex K × 1 vector y1 (t) .. y(t) = = a(θ)x(t), . yK (t)
(1.8)
H1 (θ)e−jωc τ1 (θ) .. a(θ) = . . −jωc τK (θ) HK (θ)e
(1.9)
where
The complex K × 1 vector a(θ) is referred to as the steering vector. It represents the array response to a unit wavefront from the DOA θ. The collection of vectors a(θ) as θ varies over the parameter space of interest is termed the array manifold. The array manifold is assumed to be known. In practice, this means that the array has to be calibrated. The array manifold is said to be unambiguous if, for any collection of K distinct DOAs, the corresponding steering vectors are linearly independent. This property is important for guaranteeing unique estimates. The sensors are assumed to be linear systems. Therefore, the above model for a single signal is readily extended to the case of M signals using superposition: y(t) =
M �
a(θm )xm (t) = A(θ)x(t),
(1.10)
m=1
where x1 (t) .. and x = . . xM (t)
A(θ) =
�
a(θ1 ) . . .
a(θM )
7
(1.11)
CHAPTER 1. GENERAL INTRODUCTION
Due to noise, modeling errors, etc, the model in (1.10) can never explain the observed data exactly. To account for these effects, we include an additive noise term n(t) in the array output model: y(t) = A(θ)x(t) + n(t).
(1.12)
Via suitable receiver equipment and A/D converters, a set of N temporal samples of the K-vector y(t) is assumed to be available. Similar to the antenna characteristics, the effect of receiver filters etc. can be included in the steering vectors, as long as the model is still linear. The temporal samples are denoted (with some abuse of notation) y(n), and are taken at discrete time instants tn , n = 1, . . . , N . In the case of uniform sampling, tn = (n − 1)Ts , where Ts is the sampling time. The samples collected at a particular time instant in the vector y(n) are often referred to as a snapshot. To illustrate the parameterization of the array manifold, consider a uniform linear array (ULA) with K identical sensors and uniform spacing, d. The DOA, θ, is defined as the angle relative the normal of the array axis. The normal of the array axis is also referred to as boresight or broadside. From Figure 1.4 it is readily seen that the propagation delay, τk , between the first and the k-th sensor is given by τk =
(k − 1)d sin θ , k = 1, . . . , K, c
(1.13)
where c is the propagation speed. If we assume that the individual sensors are isotropic and have unity gain, i.e. Hk (θ) = 1, k = 1, . . . , K, the steering vector is given by � a(θ) =
d
1 e−j2π λ sin θ . . .
d
e−j2π(K−1) λ sin θ
�T
,
(1.14)
where (·)T denotes transpose and λ = 2πc/ωc is the wavelength. The simplest attempt to find the DOA of a source is through conventional beamforming. In this approach, a beam is steered in one direction at a time by applying progressive phase shifts to the sensors outputs in order to compensate for the propagation delays of the incident wavefront. The array beampattern, B(θ1 , θ2 ), is defined as the complex gain of a beamformer, when steered in a direction θ1 , to an input plane wave from direction θ2 , i.e. B(θ1 , θ2 ) = aH (θ1 )a(θ2 ),
(1.15)
where (·)H denotes complex conjugate transpose. Note that for a ULA, (1.15) corresponds to the Discrete Fourier Transform (DFT) of the sequence ak (θ2 ), 8
1.3. SENSOR ARRAYS
q
pla
ne
ve wa
fro
nt
(k 1)d sin q
q
y1(t)
yk(t) (k 1)d
Figure 1.4: A plane wavefront impinging on a ULA. evaluated at the spatial frequency φ1 = 2π λd sin θ1 . As an example, Figure 1.5 shows the magnitude of the beampattern for a ULA with 12 sensors when the array is steered to boresight. Apart from the sin θ-dependence, the plot resembles the periodogram for estimating a temporal frequency from time series data. The beampattern exhibits a mainlobe at boresight and multiple sidelobes. The width of the mainlobe provides a measure of the ability of the array to resolve two different planewaves. Actually, the beampattern has a profound impact on the achievable performance of any DOA estimation algorithm, see [Mes92]. A common definition of resolution is that the mainlobe peak of one source falls at or outside the first null in the beampattern of the other source. This is referred to as the Rayleigh resolution limit, and is thus given by half the null-to-null beamwidth. This resolution limit is with respect to conventional beamforming. This does not mean that two point sources within a beamwidth cannot be resolved with model-based techniques. DOA estimation algorithms that are able to resolve point sources within a beamwidth are therefore sometimes called superresolution techniques. Another common definition of beamwidth is the half-power or 3 dB beamwidth, which is defined as the width between the points where the squared magnitude of the beampattern has dropped to one half of its maximum value. For a ULA to be unambiguous, it can be shown that the sensor spacing 9
CHAPTER 1. GENERAL INTRODUCTION
25
20
15
|B| [dB]
10
5
0
−5
−10
−80
−60
−40
−20
0 angle [°]
20
40
60
80
Figure 1.5: Magnitude in dB of the array beampattern for a ULA with 12 sensors, d = λ/2. d must be less than λ/2 if θ ∈ [−π/2, π/2]. If d ≥ λ/2 spatial aliasing will occur. This will manifest as additional lobes with the same height as the main lobe. These lobes are called grating lobes, and they introduce ambiguities in terms of the position of the maximum peak in the beampattern. Figure 1.6 shows the beampattern for a ULA when the sensor spacing is d = 2λ. Clearly, even in this noise-free case, it is impossible to tell if the true DOA is −90◦ , −30◦ , 0◦ , 30◦ or 90◦ . However, by employing nonuniform sampling the grating lobes can be suppressed. This is the topic of the next section. 25 20
|B| [dB]
15 10 5 0 −5 −10
−80
−60
−40
−20
0 20 angle [°]
40
60
80
Figure 1.6: Magnitude in dB of the array beampattern for a ULA with 12 sensors, d = 2λ.
10
1.3. SENSOR ARRAYS
1.3.2
Sparse Arrays
The achievable DOA estimation accuracy depends to a great extent on the array aperture. Large arrays can provide very accurate estimates. However, a large fully populated array is expensive to implement, both in terms of receiver hardware and computational complexity. A way to reduce the cost while maintaining accurate DOA estimates is to reduce the number of antenna elements without decreasing the array size. Such arrays are referred to as sparse arrays. The price paid for the reduction of the number of elements is near-ambiguities in the array beampattern, which may lead to large estimation errors. By using nonuniform spacing the ambiguity problems can be reduced. The challenge in sparse array design is then to devise methods for finding array structures that yield high accuracy and yet are robust to ambiguity errors. The research on sparse arrays has been active since the 1950’s. See [LL66] for a summary of the early work in this area. Sparse arrays may be classified into thinned arrays and random arrays. When designing thinned arrays, the array elements are first placed on a regular grid e.g. a ULA. The sparse array is then obtained by removing a certain number of the elements. In random arrays, the element positions are more or less random. The randomness can be a part of the design procedure or it can be the reality of the application. An example of the latter is when sonobuoys are dropped into the water from an airplane with little control over where they land. A particular class of thinned arrays that has received a lot of attention in the literature is the so called minimum redundancy array (MRA) [Mof68]. Most estimation algorithms are based on exploiting the structure of the spatial covariance matrix. For a ULA with λ/2 element spacing this matrix contains the spatial covariance lags of all multiples (i.e. 0, 1, . . . , K − 1) of λ/2. However, some lags occur many times in the covariance matrix. For instance, the lag λ/2 is obtained from the element pairs 0 · 1, 1 · 2, . . . , (K − 2) · (K − 1). The idea behind the minimum redundancy array is to minimize the number of element pairs that have the same spatial covariance lag. In order to be able to estimate all lags in the covariance matrix of the corresponding ULA, there must be at least one element pair for each lag. It has been shown in [Bra62] that zero redundancy is possible only for arrays with K ≤ 4 elements. For larger arrays one has to search for minimum redundancy with some numerical method. For large arrays this becomes very computationally demanding. The element spacings of MRAs for K ≤ 17 elements have been tabulated in [LST93]. Another class of thinned arrays are the so called non-redundant arrays. In these arrays, zero redundancy is obtained by accepting that some spatial covariance lags are missing. This means that the number of element 11
CHAPTER 1. GENERAL INTRODUCTION
pairs that equals a particular lag is either one or zero. In Figure 1.7 we show the normalized beampatterns, i.e. |B(θ1 , 0)|/K, for a 10 element ULA and MRA respectively. The ULA has a λ/2 element spacing and the element positions of the MRA are given by {0 · 1 · 3 · 6 · 13 · 20 · 27 · 31 · 35 · 36} × λ/2. Clearly, the MRA has a narrower mainlobe but higher sidelobes than the ULA. These properties of the MRA suggest a high estimation accuracy at high SNR, but a risk of ambiguity errors at low SNR. More examples of MRAs are given in Part II of the thesis. MRA 0
−5
−5
Normalized beampattern [dB]
Normalized beampattern [dB]
ULA 0
−10
−15
−20
−25
−30
−10
−15
−20
−25
−80
−60
−40
−20
0 20 angle [°]
40
60
−30
80
−80
−60
−40
−20
0 20 angle [°]
40
60
80
Figure 1.7: Magnitude in dB of the normalized array beampatterns for a ULA (left) and an MRA (right) with 10 elements
1.3.3
Signal and Noise Models
The sensor array model derived so far has been quite general. We will now be more radar specific. The spatial model a(θ) will not be discussed in more detail at this stage. Instead, we turn our attention to the temporal model x(t). Two commonly employed models for x(t) in the sensor array processing literature are the stochastic and deterministic models. In the stochastic signal model, x(t) is modeled as the realization of a stationary, zero mean (usually Gaussian) stochastic process. If the process is modeled as Gaussian, the parameters that need to be determined are the elements in the signal covariance matrix. In the deterministic signal model, each sample of x(t) is regarded as an unknown, deterministic parameter that needs to be estimated. One may also think of the deterministic model as having conditioned on a particular realization of a random x(t). Therefore, the models are sometimes also referred to as unconditional and conditional models. A third model, 12
1.3. SENSOR ARRAYS
that will be extensively studied herein, is a parameterized deterministic signal model. In this model, each sample x(t) needs not to be estimated, but the signal is instead described by a relatively small number of parameters. It is sufficient to estimate these parameters in order to completely determine the signal. An example of a parameterized signal model is a known signal waveform with unknown amplitude and phase. In radar systems modeling, a stochastic signal model is suitable for objects with rapidly fluctuating RCS and for modeling noise jammers. Commonly used models for the statistical distribution of radar objects’ RCS are the so called Swerling cases, see e.g. [NRC91]. If the RCS is constant during a coherent processing interval, a suitable model is the parameterized deterministic signal model since the complex baseband signal will then be a complex sinusoid. This is due to that when a moving object is illuminated by a radar, the reflected signal return experiences a Doppler shift which is proportional to the relative radial speed between the object and the radar platform. The Doppler shift implies that the complex envelope of the received object signal after matched filtering is a phasor that rotates from pulse to pulse at a rate given by the Doppler frequency. Thus, a suitable model for the return signal at baseband, xm (t), of the m-th object is a cisoid, xm (t) = bm ejωm t , with unknown complex amplitude, bm , (alternatively, real amplitude and phase) and frequency, ωm . The different time samples t = t1 , . . . , tN then correspond to the different pulses for a particular range bin. We now turn our attention to noise models. There are a number of noise sources in a radar system, e.g. thermal noise generated in the receivers and external noise such as sky noise. Another effect that could be accounted for in the noise term is unwanted echoes from the ground, sea, rain, buildings, etc. This is called clutter. The noise will also include any other unmodeled signals, such as intentional jamming. Whereas the thermal noise can be assumed temporally and spatially white, this is not the case for clutter and jamming. If the radar platform is not moving, the clutter return signal will be centered around zero Doppler frequency. It can then be removed relatively easily by a bandstop filter, often called MTI (Moving Target Indication) filter. If the radar platform is moving, the situation is considerably more difficult. The Doppler frequency of the ground echoes will then be different in different directions. One way to deal with this problem is to apply a spacetime filter, that removes the clutter. The technique of adaptively suppressing clutter in moving radar systems is often called STAP (Space-Time Adaptive Processing), and has been an intense research area the last decade, see e.g. [War94, Kle98] and the references therein. One way to deal with colored noise is to use so called secondary data to estimate the color. Secondary data are samples which are free from target 13
CHAPTER 1. GENERAL INTRODUCTION
signals and only contain noise and interference. The data set which is used in the estimation of the target parameters is referred to as primary data. If the secondary data contain noise and interference with the same statistics as the primary data, they can be used to pre-whiten the primary data. This will then bring back the estimation problem to the white noise case. For such a scheme to be successful, a large amount of secondary data may be necessary. In a pulsed Doppler radar, secondary data may be obtained from range bins adjacent to the primary bin under consideration. In some applications the amount of secondary data may not be sufficient for a successful pre-whitening. For example, due to spatial inhomogeneity of the clutter, there may not be sufficiently many range bins available to obtain an accurate estimate of the spatial covariance matrix. One could then resort to a model of the primary data that accommodates colored noise. The noise parameters then need to be estimated along with the signal parameters, explicitly or implicitly. Sometimes, some structure must be imposed on the correlation of the noise for the estimation problem to be identifiable, see e.g. [SS92]. In this thesis we will adopt the Gaussian model for the noise. While this model is reasonable for thermal noise and some jammers, it is at most only approximately true for clutter. Clutter is often modeled with more heavy-tailed distributions than the Gaussian, such as the Weibull, log-normal and K-distributions (see e.g. [NRC91]). The main reason for using the Gaussian model is simplicity. However, an estimator can also be applied to non-Gaussian data even if it was derived under the Gaussian assumption. Actually, it often turns out that the asymptotic variance of the estimation error depends only on the second order properties (powers and correlations) of the noise, see e.g. [Eri02].
1.4
The Estimation Problem
We now return to the model of the discrete-time received signal vector from a sensor array as given in (1.12): y(n) = A(θ)x(n) + n(n),
n = 1, . . . , N.
(1.16)
It is sometimes convenient to put this model in matrix form according to Y = A(θ)X + N, 14
(1.17)
1.4. THE ESTIMATION PROBLEM
where
� y(1) . . . y(N ) Y = � x(1) . . . x(N ) X = � n(1) . . . n(N ) . N =
(1.18) (1.19) (1.20)
The problem of primary interest in this thesis is, given the noisy observations Y, to estimate the DOAs θ. The first part of the thesis is also concerned with estimating the Doppler frequencies, ω, when x(n) is parameterized according to x(n) = Bs(ω, n), where B is a diagonal matrix containing the complex amplitudes, and s(ω, n) is vector of complex exponentials. However, for ease of exposition, we do not consider this case here in the general introduction. An immense amount of research literature devoted to this and related problems has been published over the last 30 years. However, it has not been until recently that a textbook that covers most of this area has been published [Tre02]. A more concise overview can be found in [KV96]. Herein, we will only give a brief presentation of the issues that are important for reading this thesis. The interested reader is referred to the above cited references for more details. Before we present some different methods for DOA estimation, we will provide the reader with some basic estimation theory. More details can be found in textbooks on estimation theory and statistical signal processing such as [Tre68, Leh83, Kay93].
1.4.1
Estimation Accuracy
The fundamental question addressed herein is: given the data model in (1.16), how accurately can we estimate θ ? For ease of notation, we consider θ to be a scalar parameter at this stage. A desirable property of an ˆ of θ is that it is unbiased, i.e. that E[θ] ˆ = θ. This is usually estimator, θ, a very tough requirement. A weaker property is consistency which means that θˆ → θ as N → ∞. If the convergence is “with probability one”, the estimator is said to be strongly consistent. If the convergence is “in probability”, the estimator is said to be weakly consistent. It can be shown that if an estimator is strongly consistent, it is asymptotically unbiased. A natural definition of the estimation accuracy is the mean square error (MSE) defined as � � ˆ = E (θˆ − θ)2 , (1.21) MSE(θ) where E [·] denotes expectation. The MSE can be divided into bias and variance according to ˆ = Var[ θˆ ] + Bias2 [ θˆ ]. MSE(θ) (1.22) 15
CHAPTER 1. GENERAL INTRODUCTION
Unfortunately, the bias usually depends on the unknown parameter that is to be estimated, rendering an estimator based on minimization of the MSE usually unrealizable. A way to study the fundamental limitations in an estimation problem is to study lower bounds on the estimation accuracy. Lower bounds are useful tools for system feasibility studies and evaluation of estimation algorithms. They put fundamental limits on the ultimate estimation performance that can be achieved by any algorithm. In radar and sensor array system design there are many different design parameters that interact with one another. In addition, there are many different criteria to take into account when designing these complex systems, such as cost, accuracy, robustness, etc. These interactions will inevitably lead to trade-offs when designing estimation algorithms. Using performance bounds, an understanding of how different design parameters affect the achievable estimation accuracy can be obtained without having to resort to extensive, time-consuming computer simulations. At best, the dependence of the attainable estimation accuracy upon pertinent design parameters are readily seen by direct inspection of mathematical formulae. In order to arrive at such simple solutions, one often has to make a number of simplifying assumptions. Although these assumptions are not always fulfilled in practice, the bounds can still be expected to lower bound actual performance. For a lower bound to be useful, it should be as tight as possible, i.e. there should exist an estimation algorithm whose accuracy is reasonably close to the bound. If an estimator has been found that achieves a lower bound, there is no use in putting more work trying to find an estimator with better accuracy. If, on the other hand, there is a gap between the performance of an estimator and the lower bound, the situation is more difficult. Then, we cannot tell if there exists a better estimator, we just have not found it, or if a tighter bound can be found. By far the most used bound is the Cram´er-Rao bound (CRB) [Fis22, ˆ Rao45, Cra46]. The CRB states that for any unbiased estimator θ, Var[ θˆ ] ≥
1 �, ∂ log p(Y; θ) −E ∂θ2 �
2
(1.23)
where p(Y; θ) is the likelihood function of the observed data, and the derivative is evaluated at the true value of θ. The likelihood function is the probability density function (PDF) of Y, when it is viewed as a function of θ for a fixed Y. It is a measure of how likely it is that the observed data Y were generated by the model with parameter value θ. For the CRB to hold, the PDF must satisfy some regularity conditions, see e.g. [Tre68, Leh83, Kay93]. 16
1.4. THE ESTIMATION PROBLEM
The denominator in (1.23) is referred to as the Fisher information of the data. For a vector parameter, θ, the CRB is given by � � (1.24) E (θˆ − θ)(θˆ − θ)T ≥ J−1 , where
�
{J(θ)}mn
∂ 2 log p(Y; θ) = −E ∂θm ∂θn
� (1.25)
and the notation A ≥ B means that A − B is positive semidefinite. The matrix J(θ) is called the Fisher information matrix (FIM). An estimator that has an error variance equal to the CRB is called efficient. In general, it is hard to find such an estimator. However, it is often possible to find an estimator that attains the CRB asymptotically as N → ∞. Such as estimator is said to be asymptotically efficient. An estimator that is closely related to the CRB is the maximum likelihood (ML) estimator. As the name suggests, this estimator is obtained by finding the maximizing argument of the likelihood function, p(Y; θ). An interpretation of this method is then that it finds the parameter value that most likely generated the observed data. It can be shown that if an efficient estimator exists, this estimator is the ML estimator. Furthermore, it can be shown that under certain regularity conditions (see e.g. [Tre68, Leh83, Kay93]), the ML estimator is consistent and asymptotically efficient. The main reasons for the widespread use of the CRB are that it is relatively easy to compute, and that there exists an estimator that (normally) attains it asymptotically. The CRB is thus an asymptotically tight lower bound. However, for finite samples there is usually no guarantee that the CRB is tight. Actually, it is well known that the ML estimator usually exhibits a so called threshold effect. For few samples, or low SNR, the estimation error at some point starts to increase vary rapidly. This effect is not visible in the CRB. Hence, below this threshold, the estimation error variance of the ML estimator is much higher than the CRB. The reason for this behavior of the ML estimator is that in nonlinear estimation problems, the likelihood function is often multimodal. In the asymptotic region, the estimates are close to the true value of the unknown parameter. This means that they are within the “mainlobe” of the likelihood function. Below the threshold, noise may cause “ambiguity” or “sidelobe” peaks to have higher magnitude than the “mainlobe” peak. This results in a dramatic increase of the estimation error. According to (1.23), the CRB is related to the curvature of the likelihood function at the true parameter 17
CHAPTER 1. GENERAL INTRODUCTION
value. An ambiguity peak in the likelihood function far away from the true parameter value has no influence on the CRB. Therefore, the threshold effect is not captured by the CRB. A natural question to ask is then: do better estimators than the ML estimator exist, or do better bounds than the CRB exist? To the first question there is no general answer, at least to the author’s knowledge. The answer to the second question is yes. A number of bounds have been developed over the years that are tighter than the CRB below the threshold. The most popular among these bounds are the Barankin [Bar49], Ziv-Zakai [ZZ69], and Weiss-Weinstein bounds [WW85]. Although these bounds do capture the threshold effect, they do not perfectly predict the estimation error of the ML DOA estimator. In Part II of this thesis, we present an extensive study of the threshold region performance of the ML estimator.
1.4.2
Estimation Methods
In this section, we give a brief overview of different DOA estimation algorithms. More details can be found in e.g. [Tre02]. Beamforming Methods As mentioned previously, a natural approach to find the DOA of a single source is to scan a beam over the search volume and monitor the received output power. The DOA estimate is then taken as the pointing direction that corresponds to the peak output power. The beam is formed by compensating for the time delay between different sensors that a plane wave experiences as it travels across the array. If the source signal is narrowband, the time delay amounts to a simple phase shift. Mathematically, the beamforming can be expressed as a multiplication of the received signal vector with a weight vector w according to z(t) = wH (θ)y(t),
t = 1, . . . , N.
(1.26)
The output power, averaged over the N snapshots, is then given by N 1 � H ˆ P (θ) = |w (θ)y(t)|2 = wH (θ)Rw(θ), N t=1
(1.27)
where ˆ = R
N 1 � y(t)yH (t) N t=1
18
(1.28)
1.4. THE ESTIMATION PROBLEM
is the sample covariance matrix. Depending on how the weight vector w is determined, different beamforming methods result. Here, we will present two commonly used methods: the conventional and the Capon beamformers. A more extensive treatment of various beamforming methods can be found in [VB88]. Conventional Beamformer In the conventional beamforming method, the weight vector is chosen so as to maximize the output power when the beam is steered to the true direction, θ. This is a spatially matched filter, for which the solution in spatially white noise is given by wBF (θ) =
a(θ) . |a(θ)|
(1.29)
Since the true direction is unknown, a number of hypothesized directions are evaluated, and the one for which the output power is the maximum is taken as the DOA estimate. This scheme amounts to finding the maximum in the beamformer spectrum, PBF , which is obtained by inserting (1.29) into (1.27) ˆ aH (θ)Ra(θ) . PBF (θ) = aH (θ)a(θ)
(1.30)
This spectrum is a spatial analog of the Fourier based spectral methods used in times series analysis [SM97]. In the case of a ULA with a steering vector according to (1.14) the beamformer spectrum in (1.30), when viewed as a function of φ = 2πd sin(θ)/λ, is equivalent to the classical periodogram. This means that the conventional beamformer also suffers from the limited resolution of Fourier methods. For the DOA estimation problem, this means that the resolution of the conventional beamformer cannot be better than the array beamwidth, no matter how many snapshots we collect or how high the SNR is. Capon’s Beamformer The limited resolution of the conventional beamformer is essentially due to spectral leakage between closely spaced sources. A way to alleviate this problem was proposed by Capon in [Cap69]. The idea behind this approach is to minimize the output power from the beamformer, while protecting the gain in the look direction, i.e. min P (w) w
subject to wH a(θ) = 1.
(1.31)
This method is also frequently referred to as the minimum variance distortionless response (MVDR) beamformer. The solution to the constrained 19
CHAPTER 1. GENERAL INTRODUCTION
optimization problem in (1.31) is readily obtained using the method of Lagrange multipliers. The result is wCAP
ˆ −1 a(θ) R = , ˆ −1 a(θ) aH (θ)R
(1.32)
which yields the Capon spectrum according to PCAP (θ) =
1 . ˆ −1 a(θ) aH (θ)R
(1.33)
The Capon beamformer tries to null any source that is not in the look direction. This results in an improved resolution as compared to the conventional beamformer. The resolution depends on SNR, but not (much) on the number of snapshots. However, the resolution capability of the Capon beamformer is still rather poor. Maximum Likelihood Methods The ML method is a standard technique in statistical estimation theory. In order to apply the maximum likelihood method, the likelihood function of the observed data needs to be determined. Depending on how the source signals are modeled, two main ML methods have been developed for the DOA estimation problem. If the source signals are modeled as Gaussian stochastic processes, we obtain the stochastic ML (SML) method. If the signals are considered as deterministic parameters that need to be estimated along with the DOAs, the so-called deterministic ML (DML) estimator results. The Stochastic Maximum Likelihood Method This method is based on the assumption that the source signals are zero-mean, complex Gaussian stochastic processes. The information about the source parameters is then contained in the covariance matrix of the received data. More specifically, the signals, x(n), and noise, n(n), are assumed to be independent, zero-mean, complex Gaussian random processes with second-order moments � � E n(m)nH (n) = σ 2 Iδmn E x(m)xH (n) = Pδmn � � E x(m)xT (n) = 0 E n(m)nT (n) = 0, (1.34) where P is the unknown signal covariance matrix and δmn represents the Kronecker delta. Thus, the signals are assumed to be temporally white, and the noise is assumed to be spatially and temporally white. From (1.16) and 20
1.4. THE ESTIMATION PROBLEM
the assumptions stated above we obtain the data covariance matrix according to � � � E y(m)yH (n) = R δmn = A(θ)PAH (θ) + σ 2 I δmn (1.35) � T (1.36) E y(m)y (n) = 0. The unknown parameters in this model are the DOAs in θ, the elements in the signal covariance matrix, P, and the noise variance, σ 2 . With the assumptions above, the likelihood function of the observed data will be that of the complex K-variate Gaussian distribution, see e.g. [Goo63]. The likelihood function of a single snapshot is then given by p(y; θ, P, σ 2 ) =
� H −1 1 exp −y R y , π K |R|
(1.37)
where | · | denotes the determinant of a matrix. Since the snapshots are independent and identically distributed, the likelihood function of all snapshots in Y is given by 2
p(Y; θ, P, σ ) =
N �
� H 1 −1 (n)R y(n) . exp −y π K |R| n=1
(1.38)
Maximizing the likelihood function is equivalent to minimizing the negative log-likelihood function, given by 2
− log[p(Y; θ, P, σ )] = KN log π + N log |R| +
N �
yH (n)R−1 y(n).
n=1
(1.39) The stochastic ML estimator is then obtained solving the following optimization problem (ignoring the constant term and normalizing by N ) ˆ σ ˆ P, [θ, ˆ 2 ] = arg min2 VSML (θ, P, σ 2 ), θ,P, σ
(1.40)
where N 1 � H y (n)R−1 y(n) VSML (θ, P, σ ) = log |R| + N n=1 � � −1 ˆ = log |R| + Tr R R . 2
(1.41)
If no other structure is imposed on P than being Hermitian, the total number of parameters to estimate in this problem is M 2 + M + 1. Since this 21
CHAPTER 1. GENERAL INTRODUCTION
optimization problem is highly nonlinear, it becomes computationally very demanding when M > 1. The problem can be simplified by concentrating the ML criterion function with respect to P and σ 2 . This means that only a search over the unknown DOA parameters is necessary; thereby reducing the dimension of the optimization problem to M . The concentrated form is given by [B¨oh86, SN95] � � � � H ˆ (θ) + σ ˆ 2 (θ)I� , VSML (θ) = log �A(θ)P(θ)A
(1.42)
where � ˆ ˆ −σ P(θ) = A† (θ) R ˆ 2 (θ)I A†H (θ), � � 1 2 ⊥ ˆ σ ˆ (θ) = Tr PA (θ)R . K −M
(1.43) (1.44)
Here, A† is the pseudo-inverse of A and P⊥ A is the orthogonal projection onto the null space of AH , i.e. A† = (AH A)−1 AH † P⊥ A = I − AA .
(1.45) (1.46)
Even though the SML method was derived under the assumption of Gaussian data, it can certainly be applied to non-Gaussian data as well. An interesting property is that the asymptotic accuracy of the SML estimator depends only on the second-order (powers and correlations) of the signals, irrespective of their actual distribution [SN90b, OVK92].
The Deterministic Maximum Likelihood Method In the DML method, no assumptions on the distribution of the signals are made. Each sample of the signals is instead considered as an unknown parameter that needs to be estimated. The noise is still considered to be a zero-mean, complex Gaussian random process. The information about the source parameters is then contained in the mean of the received data. The first- and second-order moments are in this case given by E [y(n)] = A(θ)x(n) � E (y(m) − E [y(m)])(y(n) − E [y(n)])H = σ 2 Iδmn � E (y(m) − E [y(m)])(y(n) − E [y(n)])T = 0. 22
(1.47) (1.48) (1.49)
1.4. THE ESTIMATION PROBLEM
The unknown parameters in this model are the DOAs, θ, the signal samples in X, and the noise variance, σ 2 . The PDF of the N snapshots is given by p(Y; θ, X, σ 2 ) = N � � 1 exp −σ −2 {y(n) − A(θ)x(n)}H {y(n) − A(θ)x(n)} . 2 |πσ I| n=1 (1.50) The negative log-likelihood function then takes the form − log[p(Y; θ, X, σ 2 )] = KN log(πσ 2 ) +
1 �Y − A(θ)X�2F , (1.51) σ2
where � · �F is the Frobenius norm of a matrix. The DML criterion function can also be concentrated with respect to the signal and noise parameters. This results in that the DML DOA estimator is given by [B¨oh84, Wax85] θˆ = arg min VDML (θ),
(1.52)
� � ˆ VDML (θ) = Tr P⊥ (θ) R . A
(1.53)
θ
where
Hence, the ML estimator under the deterministic signal model is also obtained by finding the minimum of a multidimensional, nonlinear function. Both the SML and DML estimators have excellent performance, but they are computationally demanding. This motivates the need for estimators having performance and computational complexity between those of the beamforming and ML methods. One such class of estimators is briefly described in the following. Subspace Methods A class of estimators that has become very popular are the so-called subspace methods. These methods have very good performance at a reasonable computational cost. The great interest was sparked by the introduction of the MUSIC (Multiple Signal Classification) algorithm in [Sch79]. The subspace methods rest on a geometrical interpretation of the data model in (1.16). If the number of signals is less than the number of sensors, the signal part will reside in subspace of the full complex K-dimensional vector space. In the MUSIC algorithm, a pseudo-spectrum is formed that is a measure of the distance between the array manifold and the orthogonal complement of 23
CHAPTER 1. GENERAL INTRODUCTION
the signal subspace, called the noise subspace. The DOA estimates are then obtained by locating the peaks in this pseudo-spectrum. Another popular subspace method that is only applicable to certain array geometries is the ESPRIT (Estimation of Signal Parameters via Rotational Invariance Techniques) algorithm [RPK86]. Later, it was discovered that many methods can be cast in a common subspace fitting framework [VO91]. Among these are the beamforming, DML, MUSIC, and ESPRIT methods. Based on these insights, a subspace method called WSF (Weighted Subspace Fitting) was derived that has the same asymptotic accuracy as the SML method, but at a lower computational cost. Since we do not deal with subspace methods in this thesis, no details are given here. The interested reader is referred to the above cited references for further reading. Estimating the Number of Sources All methods considered herein, except the beamforming methods, require knowledge of the number of sources. Since this knowledge is normally not available a priori, this number has to be estimated. Common methods when using subspace methods are the AIC (An Information Criterion) and MDL (Minimum Description Length) methods2 [WK85]. These methods are separated from the DOA estimation problem. Another approach is to jointly estimate the number of sources and their DOAs. Example of such approaches are given in [WZ89, Wax91, OVSN93]. We do not deal with the problem of estimating the number of sources in this thesis, but assume, whenever required, that this number is known.
1.5
Motivation and Aim of the Thesis
Model-based signal processing and digital arrays have the potential of significantly improving the performance of modern radar systems. However, this comes at the expense of increased costs and complexity, both in terms of hardware and computational requirements. Furthermore, the performance of model-based methods are sensitive to modeling errors, requiring accurate system calibration. These facts have severely limited the introduction of these techniques into real world applications. Reduction of hardware and computational complexity is therefore an issue of utmost importance. 2
More precisely, these methods estimate the signal subspace dimension which is equal to the number of non-coherent sources
24
1.6. OUTLINE AND CONTRIBUTIONS
Two different aspects of reducing the complexity have been the motivation behind the work presented in this thesis: • Reducing computational complexity by simplifying estimation algorithms. This is the motivation behind Part I of this thesis. • Reducing hardware (and computational) complexity by reducing the number of antenna elements. This is the motivation behind Part II of this thesis. The focus of this thesis is on the fundamental limitations on the achievable performance rather than on proposing algorithms for practical implementation. To this end, we study lower bounds on the achievable estimation accuracy and the theoretical performance of the best known estimators. The results could be useful for feasibility studies and in the early stages of system design. Although practical aspects such as algorithm design and hardware implementation issues are not the primary focus, they are indeed motivations behind the work presented herein. In the first part of the thesis it is demonstrated how the DOA and Doppler estimation algorithms can be simplified by adopting a decoupled approach. The second part has its origin from demands on reducing hardware complexity by reducing the number of antenna elements. In order to maintain accurate DOA estimation, this reduction is performed without decreasing the array aperture. These types of complexity reductions may have a substantial influence on the estimation performance. It is therefore important to have adequate tools to analyze these types of complexity/performance trade-offs. The focus of this thesis is on performance analysis pertaining to the two types of complexity reductions mentioned above. The first part of the thesis is concerned with performance analysis of joint and decoupled DOA/Doppler estimation. In the second part a performance analysis of DOA estimation is presented that is focused on incorporating the effect of ambiguity errors into the analysis. This is of particular importance when dealing with sparse arrays, since an intrinsic property of such arrays are high sidelobes or near-ambiguities. These high sidelobes may cause large estimation errors which set limits to the degree of sparsity that can be tolerated.
1.6
Outline and Contributions
The thesis is divided into two self-contained parts. Both parts are concerned with the achievable performance of parameter estimators in sensor array signal processing. The first part is about joint and decoupled angle-frequency 25
CHAPTER 1. GENERAL INTRODUCTION
estimation, whereas the second deals only with the angle estimation problem. These problems can be viewed as 2-D and 1-D frequency estimation problems, respectively. However, the major difference between the two parts is in the focus of the performance analysis. The results in Part I are mainly of asymptotic nature, i.e. the amount of data is assumed to be large. In this asymptotic region conventional performance analysis techniques such as Taylor expansions and CRBs are useful tools. In Part I CRBs and asymptotic analyses of the maximum likelihood estimators are developed for the angle-frequency estimation problem. In many practical situations the amount of data may not be sufficient for the asymptotic assumptions to be valid. In such scenarios asymptotic analyses usually give too optimistic performance predictions. It is therefore of great interest to develop tools that can be used to predict the performance also in the non-asymptotic region. A prominent feature of non-linear estimation in the non-asymptotic region is the threshold effect. In part II of this thesis a performance analysis of the maximum likelihood DOA estimator that takes the threshold effect into account is developed. Finding the finite sample properties of non-linear estimators has generally been considered to be a difficult problem. Yet, it is shown in this thesis that an analysis based on very simple ideas can be used to predict the non-asymptotic performance of the ML DOA estimator with high accuracy. The main contributions of this thesis are summarized chapter-wise in the following outline. Edited versions of Chapters 2 – 7 will be published as one chapter in the book [HGC].
Chapter 2 The first chapter in Part I gives a brief background to the problem of anglefrequency estimation and a review of the research literature in the area. Further, it includes problem formulation and a discussion on the assumptions that we make. The chapter ends by showing the close connection to 2-D frequency estimation.
Chapter 3 In this chapter joint angle-frequency estimation using a 2-D model is considered. The results presented in Chapter 3 and 4 are extensions of related work that has been previously reported by other authors. The extensions are to multiple sources, more general noise models, and relaxed restrictions on sampling and asymptotics. 26
1.6. OUTLINE AND CONTRIBUTIONS
Firstly, a general CRB for parameterized signals in colored noise is presented. This CRB is then used to derive the CRB for joint angle-frequency estimation using the 2-D model. Asymptotic CRBs are then derived, assuming the amount of data is large in one of the frequency dimensions. It is shown that the multi-source CRB in this case decouples to the single source CRB. Maximum likelihood and weighted least squares techniques for joint angle-frequency estimation are then reviewed. It is shown that these estimators have excellent performance but are computationally very expensive.
Chapter 4 Recognizing the computational complexity of the 2-D estimators, a decoupled 1-D/1-D model is studied in Chapter 4. Firstly, the finite and asymptotic CRBs for the 1-D/1-D model are presented. A decoupled weighted leastsquares (WLS) estimator based on the 1-D/1-D model is then proposed. It is shown that the multi-source 1-D/1-D WLS estimator can achieve the single source 2-D CRB asymptotically. It is sufficient that the amount of data is large in only one of the frequency dimensions for the estimator to achieve the 2-D CRB in both dimensions. In order to achieve this, the estimation must be performed in the right order. The frequency dimension in which the amount of data is large must be processed first. In this dimension, the sources are resolvable and, subsequently, the estimation in the other frequency dimension can be performed for one source at a time. The result is a tremendous reduction in computational complexity as compared to the full 2-D frequency estimation problem. Yet, under the stated assumptions, the performance loss is insignificant. This result is the main contribution of Chapter 4.
Chapter 5 The methods presented in Chapter 3 and 4 are all implicit in nature. The parameter estimates are defined as the minimizing arguments of some nonlinear criterion function. In practice, finding the minimum is far from trivial, especially when the number of parameters is large. The presented objective functions are all of the nonlinear least squares type. In Chapter 5 a computationally attractive and reasonably reliable procedure to solve such problems is described. The technique is based on local numerical optimization, initialized using the so-called RELAX procedure.
27
CHAPTER 1. GENERAL INTRODUCTION
Chapter 6 Chapter 6 concludes the first part of the thesis by presenting some numerical examples and simulation results in order to corroborate the theoretical analysis presented in the preceding chapters.
Chapter 7 Chapter 7 concludes the first part of the thesis by giving a summary of the main findings in Chapter 3 – Chapter 6.
Chapter 8 In the second part of the thesis the threshold region performance of the maximum likelihood DOA estimator is analyzed. Both the deterministic and stochastic maximum likelihood estimators are considered. Chapter 8 provides an introduction to Part II by explaining the threshold effect and reviewing the research literature in the area. Further, the contributions presented in this thesis are compared with previous and present-day work by other authors.
Chapter 9 For the case of a single signal in white Gaussian noise, the ML estimator is equivalent to the conventional beamformer. This case is studied in Chapter 9. Approximations to the probability of outlier and MSE are derived. It is verified by simulations that the derived approximations provide an accurate characterization of the threshold region performance of the ML estimators. It is also shown that for a single snapshot the ML estimator under the stochastic signal model is not statistically efficient as the SNR tends to infinity due to the effect of outliers.
Chapter 10 The results in Chapter 9 are extended in Chapter 10 to multiple sources. The basic ideas behind the approximations of the MSE and probability of outlier remain the same but the technical details become considerably more intricate. Finding the desired probabilities amounts to computing tail probabilities of the distribution of quadratic forms. The main contribution of Chapter 9 and 10 is that together they provide a comprehensive treatment of the threshold region performance of ML DOA estimation. Although similar ideas and analyses have appeared previously for 28
1.6. OUTLINE AND CONTRIBUTIONS
simpler cases and other applications, to the author’s knowledge, no extensive study of the problem considered herein has been published before. Several authors have used bounding techniques to characterize the threshold region performance in DOA estimation. Indeed, these techniques do set a limit to the ultimate accuracy that can be achieved, but often the bounds are not tight i.e. no estimator that reaches these bounds is known. It can therefore be argued that the performance of the ML estimator is, in a sense, of more practical interest since it is often used as a benchmark estimator.
Chapter 11 The second part of the thesis ends with two application examples. In the first example the single-source performance of an interferometric-like DOA estimation system consisting of two widely separated ULAs is investigated. Several authors have treated various, more narrow, aspects of this type of array structure. The purpose with this example is to explore further the fundamental limitations in DOA estimation with this particular array structure. It includes a discussion on optimal Bayesian estimation and performance bounds and how they relate to their classical counterparts. The example provides some further insights into estimation problems that are prone to ambiguities. In the second example a novel criterion for optimizing the element positions in sparse arrays is proposed. Previous approaches to this problem include minimization of the CRB and optimization of various antenna pattern characteristics. A problem with the CRB approach is that it is a local measure that does not capture the effect of near-ambiguities. A deficiency with the antenna pattern approach is that the connection to the resulting estimation accuracy may not always be clear. Herein, the threshold in the Weiss-Weinstein lower bound is used as optimization criterion. This criterion has the desirable property that it is a measure of achievable estimation accuracy taking the threshold effect into account. An interesting result of the optimization is that the optimal array has a nearly identical lower bound to the so called minimum redundancy array, which was devised from completely different ideas.
Chapter 12 Chapter 12 ends the thesis by summarizing the main results of Part II.
29
CHAPTER 1. GENERAL INTRODUCTION
1.6.1
Publications
The thesis is based on the following publications by the author: Book Chapter • F. Athley, M. Viberg, and J. Eriksson. “High-Resolution Space-Time Signal Processing for Radar”, In Y. Hua, A. Gershman, Q. Cheng, editors, High-Resolution and Robust Signal Processing, Dekker, New York, NY, To be published. Conference Papers • F. Athley. “Threshold Region Performance of Deterministic Maximum Likelihood DOA Estimation of Multiple Sources”. In Proc. 36th Asilomar Conf. on Signals, Systems, and Computers, Pacific Grove, CA, USA, Nov. 2002. • F. Athley. “Performance Analysis of DOA Estimation in the Threshold Region”. In Proc. IEEE Int. Conf. on Acoust., Speech, Signal Processing, Orlando, FL, USA, May 2002. • F. Athley. “Threshold Region Performance of Maximum Likelihood DOA Estimation For a Single Source”. In Proc. 10th Annual Adaptive Sensor Array Processing Workshop, MIT Lincoln Lab., Lexington, MA, USA, March 2002. • F. Athley. “Optimization of Element Positions for Direction Finding with Sparse Arrays”. In Proc. 11th IEEE Signal Processing Workshop on Statistical Signal Processing, Singapore, Aug 2001. • F. Athley and C. Engdahl. “Direction-Of-Arrival Estimation Using Separated Subarrays”. In Proc. 34th Asilomar Conf. on Signals, Systems, and Computers, Pacific Grove, CA, USA, Oct 2000. • F. Athley. “Asymptotically Decoupled Angle-Frequency Estimation with Sensor Arrays”. In Proc. 33rd Asilomar Conf. on Signals, Systems, and Computers, Pacific Grove, CA, USA, Oct 1999. Technical Report • F. Athley, “Angle and Frequency Estimation Using Sensor Array”, Technical report 370L, Licentiate thesis, Chalmers University of Technology, Feb 2001. 30
1.7. TOPICS FOR FUTURE RESEARCH
1.7
Topics for Future Research
We end this chapter with some suggestions for future research topics that are intimately related to the material presented in the thesis. Noise Models The noise models employed in this thesis may not be realistic in all applications. In Part I, the space-time noise covariance matrix is assumed to have a Kronecker structure. As discussed in Chapter 2, this may not be a realistic assumption in a scenario involving clutter and jamming. A topic for future research is to investigate if this imposed structure can be relaxed. A recent contribution to this area is [MS02], where the asymptotic CRB for 2-D frequency estimation is derived assuming a block Toeplitz structure on the space-time noise covariance matrix. Another recent contribution is [CF02], where an asymptotic analysis of least squares estimation of real 2-D sinusoids in colored noise is performed. One of the most severe interference sources in a radar system is clutter. Clutter has a rich structure and an interesting research topic is to develop structured models for the clutter that could be used in the estimation methods presented herein. This would alleviate the requirements on a large amount of secondary data. In Part II, spatio-temporally white noise is assumed throughout. It would be interesting to extend the results in Part II to colored noise. In [Ric03] the case of a single deterministic signal in white noise is extended to the case of colored noise and access to secondary data. Threshold Region Performance of Angle-Frequency Estimation A natural extension of the work presented in this thesis is to apply the threshold region analysis in Part II to the estimation problem in Part I. Lower Bounds on Estimation Accuracy It would be nice to bridge the gap between the MSE approximation of the ML estimator derived in Part II and the lower bounds available today. It is unclear if tighter bounds can be found or if estimators with better threshold region performance than the ML estimator exist for the multi-source problem. The connection between the MSE approximation and the Weiss-Weinstein and Ziv-Zakai lower bounds should be established. Maybe this could provide new insights that lead to improved bounds. Bayesian bounds for the multisource problem is also a topic for future research. 31
CHAPTER 1. GENERAL INTRODUCTION
Optimization of Element Positions in Sparse Arrays The MSE approximation could be used to optimize the element positions in sparse arrays in a similar way that we used the Weiss-Weinstein bound in Chapter 11. This has the potential of being a faster and more accurate method. More importantly, it could be applied to the multi-source problem. Instead of optimizing the accuracy for a single source, we could e.g. optimize the resolution capability of the array. Further Analysis of the Stochastic ML DOA Estimator We show in Part II that the SML estimator is statistically inefficient for high SNR in the case of a single signal and a single snapshot. Simulation results indicate that this observation also holds for multiple signals and multiple snapshots. However, we have not verified this theoretically. To our knowledge, no high SNR analysis of the SML estimator, when applied to stochastic signals, has been reported in the literature3 . The analysis of the threshold region performance of the SML estimator in the case of multiple sources is not complete. The distribution of the concentrated SML criterion function remains to be computed. It would also be desired to find a way to concentrate the SML criterion so that positive semi-definite estimates of the signal covariance matrix can be guaranteed. How to treat the nuisance parameters in the MSE approximation for the case of correlated signals also deserves some more attention.
3
In [Vib93] a high SNR analysis of the SML estimator when applied to a deterministic signal model was performed.
32
Part I Asymptotically Decoupled Angle-Frequency Estimation with Sensor Arrays
33
CHAPTER 1. GENERAL INTRODUCTION
34
Chapter
2
Introduction 2.1
Background and Overview
The first part of this thesis is concerned with the problem of estimating the directions of arrival (DOAs) and Doppler frequencies of multiple targets with a pulsed Doppler radar employing an array antenna. This can also be viewed as a two-dimensional (2-D) frequency estimation problem. Estimating the frequencies of 2-D sinusoids has received considerable interest in the literature, see e.g. [Kay80, McC82, DM84, Hua92, RZZ94, LvdVD98, Eri02]. This problem finds applications in many fields such as sonar, radar, geophysics, radio astronomy, radio communications, and medical imaging. The material herein is presented in the context of pulsed Doppler radar, although the results are generally applicable to separable 2-D data models. We consider the case where an array of spatially distributed sensors receives sinusoidal return signals from distant sources. Our main objective herein is to estimate the temporal and spatial frequencies of the source signals. The temporal frequency is related to the relative speed between a source and the radar platform via the well known Doppler effect. The spatial frequency is related to the source’s direction of arrival via the inter-element phase shifts that are present when a narrowband wavefront is incident upon the array. The chief systematic approach to solving parameter estimation problems is the maximum likelihood (ML) method. Under fairly general assumptions, the ML approach is known to produce asymptotically unbiased and statistically efficient estimates, see e.g. [Kay93]. The latter means that the ML estimates asymptotically achieve the Cram´er-Rao bound (CRB), which is a lower bound on the error variance of any unbiased estimator. The CRB for the full 2-D data model is derived in Chapter 3, followed by a simplified 35
CHAPTER 2. INTRODUCTION
expression, which is valid for a large number data samples (either temporally or spatially). The exact ML estimator (MLE) is also derived, as well as an asymptotically efficient approximation based on nonlinear weighted least squares (WLS). Unfortunately, for the problem at hand, the ML and WLS approaches result in multidimensional, nonlinear searches; which may be computationally prohibitive in a real-time application. Therefore, in practice, one must often resort to simpler suboptimal procedures. One such simplification is to formulate the 2-D problem as two 1-D problems, i.e., to consider a decoupled data model. This is the topic of Chapter 4. A natural first question to ask is: what is the price in estimation accuracy of using the simpler 1-D/1-D data model? The CRB on the DOA and Doppler frequency estimation errors are derived for the decoupled data model, and shown to agree asymptotically with the corresponding bound for the full 2-D model. Furthermore, these asymptotic bounds for the multi-source case are shown to agree with the bounds for the single-source case. Consequently, a 1-D/1-D estimator that achieves the 2-D CRB in large samples is presented. Issues related to the implementation of the WLS estimators are also discussed. Finally, the first part of the thesis ends with some numerical examples and simulation results to corroborate the theoretical analysis.
2.2
Literature
An edited version of the material presented in the first part of this thesis will also be published as a book chapter in [AVE]. Parts of the material have previously been published in [Ath99, Ath01a]. The results presented herein are extensions of related work that has been reported previously by other authors. The re-formulation of the 2-D DOA/Doppler estimation problem as two sequential 1-D problems was first presented in [SS98]. Consistent and asymptotically efficient 1-D and 2-D MLEs with corresponding CRBs were derived. It was found that the 1-D and 2-D estimators have the same asymptotic performance. These results rely on assumptions of temporally white and spatially colored noise. However, they considered only the case of a single source. In this thesis we will extend some of the results in [SS98] to the case of multiple sources and also allow for temporally colored noise. More specifically, the space-time noise covariance is assumed to have a Kronecker structure. Other approaches to simplifying a 2-D frequency estimation problem into 1-D problems have been reported in e.g. [Hua92, RZZ93, SSM93, ZLS97]. In [ZF96] a related discussion about CRBs for spatio-temporal versus spatial-only processing was presented. Therein, it was shown that the CRB for a multi-source spatio-temporal model equals the CRB for a single-source 36
2.2. LITERATURE
spatial model if the “source matrices” (covariance matrix of the source signals and the derivatives) are diagonal. These results are based on assumptions of spatio-temporally white noise. In this thesis we extend this result to colored noise, and show that it holds asymptotically when the source signals are complex sinusoids. Additional results regarding the 2-D CRB and MLE include [War95], where the 2-D DOA/Doppler CRB and MLE were derived for the case of a single target in arbitrarily colored noise. CRB, least-squares (LS) and ML estimation in the context of 2-D frequency estimation have been treated in [Hua92, Cla93, RZZ94, LSZ96, KM96]; where the case of multiple signals in spatio-temporally white noise was considered. However, the finite sample multi-source CRBs are complicated and do not offer much insight. More easily interpretable, asymptotic results were given in [Cla93], where the asymptotic 2-D CRB was derived, as the amount of data tends to infinity in both frequency dimensions. Uniform sampling was assumed in both dimensions. However, in some applications, it is reasonable to expect that the amount of data is large in only one dimension. For instance, in a radar system employing an array antenna, it is usually more costly to use many antenna elements than to use many pulses. In addition, the sampling is, in many applications, not uniform. Nonuniform sampling is a means of combatting ambiguities that occur when the sampling is sparse. In this thesis we generalize the results of [Cla93] to nonuniform sampling and colored noise. Furthermore, we relax the condition that the amount of data is large in both dimensions and show that it is sufficient with one dimension, provided the processing is performed in the right order. In [LSZ96, DN02] it was shown that the frequency dimensions are uncoupled also for finite samples. However, they used a more general signal model in which the matrix of signal amplitudes is full. For the problem considered in this thesis, the matrix of signal amplitudes is diagonal. This mean that to each DOA there corresponds only one Doppler frequency, and vice versa. A full matrix implies that each DOA corresponds to all Doppler frequencies and vice versa, see further the next subsection. In such a mixed-up scenario there is apparently nothing to gain using a 2-D model over 1-D models. This agrees with the observations in [ZF96] and [LR93] that nothing can be gained by using spatio-temporal processing if the signals are coherent. Herein we show that for a signal model with a diagonal signal amplitude matrix, the performance gain when using the full 2-D model can be substantial in finite samples. We would also like to note an interesting relationship with the DOA CRB for signals with known waveforms derived in [LR93, LHSV95]. Therein it was shown that the multi-source CRB equals the single-source CRB if 37
CHAPTER 2. INTRODUCTION
the signals are uncorrelated. For the problem treated here, the signals are neither known nor uncorrelated. However, when the amount of temporal data is large the signals are almost uncorrelated and the waveforms estimates are very accurate. Therefore, as will be shown later on, the multi-source CRB will reach the single-source bound asymptotically also in our problem. Recently, there has been an increased interest in asymptotic analysis of the 2-D frequency estimation problem. A number of publications have appeared. Here, we will only mention the most relevant to the work presented in this thesis. In [MS02], the asymptotic 2-D CRB is derived for the case of stationary colored noise. This implies a Toeplitz-block-Toeplitz structure of the space-time covariance matrix. Further assumptions in [MS02] are that the sampling is uniform and that the amount of data tends to infinity in both frequency dimensions. In [KN01, Eri02, CF02, MS02] the asymptotic distributions of 2-D nonlinear LS estimators in colored noise are derived. These analyses are also valid for non-Gaussian noise. For Gaussian noise, the estimators are shown to be asymptotically efficient. To summarize, the main contribution of Part I in this thesis is an asymptotic analysis which shows that it is possible to obtain 2-D efficient estimates in both frequency dimensions when the amount of data is large in only one dimension. For this to hold, the processing must be performed in the right order, i.e. the “asymptotic dimension” should be processed first. Furthermore, we show that not only the frequency dimensions decouple, but also the different sources. This means that, under the stated assumptions, the single-source 2-D CRB can be attained in a multi-source scenario using two 1-D estimators. Moreover, the 1-D M -source estimator in the second stage reduces to M single-source estimators, where M is the number of sources.
2.3
Problem Formulation
In this section we present the data model, set the notation, and state the assumptions that our results are based upon. Consider a pulsed Doppler radar system employing an array antenna with K sensors. Within a coherent processing interval the radar transmits a series of N pulses. During this time the RCSs of the targets in the field of view are assumed to be constant. The pulse-to-pulse return baseband signals are modeled as complex sinusoids. It is assumed that the targets are in the far-field of the array and that the received signal waveforms are narrowband relative to the carrier frequency and array size. The array output for a particular range bin, in which M targets are present, can then be modeled by the K × 1 vector y(n) = A(θ)Bs(ω, n) + n(n), 38
n = 1, . . . , N,
(2.1)
2.3. PROBLEM FORMULATION
where � a(θ1 ) . . . a(θM ) A(θ) = � B = diag b1 . . . bM T � jω t e 1 n . . . ejωM tn s(ω, n) = .
(2.2) (2.3) (2.4)
Here, a(θm ) is the complex K × 1 steering vector that models the array response to a unit waveform from the DOA θm , which is defined to be the angle w.r.t. boresight of the array. The notation diag[ b1 . . . bM ] means a diagonal matrix with bm as the m-th diagonal element. Furthermore, bm denotes the complex amplitude and ωm the Doppler frequency of the mth source. The complex K × 1 vector n(n) accounts for receiver noise as well as modelling errors and unmodeled signals such as jammers and clutter. ˆ m , and ˆbm respectively. The model Parameter estimates will be denoted θˆm , ω in (2.1) can be put in matrix form according to Y = A(θ)BS(ω) + N,
(2.5)
where � y(1) . . . y(N ) Y = � s(ω, 1) . . . s(ω, N ) S(ω) = � n(1) . . . n(N ) . N =
(2.6) (2.7) (2.8)
The chief problem of interest herein is the estimation of the DOAs and Doppler frequencies given the noisy observations Y. The complex amplitudes and the noise parameters are also unknown. However, these parameters are decoupled from the estimation of the DOAs and Doppler frequencies, and since they are usually not of great interest in radar systems, we treat them as nuisance parameters. The number of signals is assumed to be known, or estimated by some method. Estimation of the number of signals has been treated in e.g. [WK85, VOK91, Eri02]. In the 2-D problem, it is assumed that the {ωm , θm } pairs for different targets are distinct, while a somewhat more restrictive assumption is required in the 1/D-1/D problem, see Section 4.3. The noise is assumed to be multivariate complex Gaussian distributed with zero mean and second order moments E[n(n)nH (l)] = cnl Q E[n(n)nT (l)] = 0 ∀ n, l. 39
(2.9) (2.10)
CHAPTER 2. INTRODUCTION
The K × K matrix Q models the spatial correlation of the noise, whereas the temporal correlation is included in the N × N matrix C: c11 . . . c1N .. C = ... (2.11) . cN 1 . . . cN N The structure implied by (2.9) means that the covariance matrix of the vectorized noise matrix takes the form E[ vec(N) vecH (N)] = C ⊗ Q ,
(2.12)
where vec(N) is formed by stacking the columns of N and ⊗ denotes the Kronecker matrix product [Bre78]. Now, Y contains 2N K real-valued observations, whereas C and Q together contain N 2 + K 2 real parameters (assuming only the Hermitian property is exploited). It is therefore not possible to estimate both C and Q from data. If more structure is imposed, for example that C is Toeplitz due to the noise being stationary, the number of free parameters reduces. We will not discuss this any further here, but simply assume a uniquely identifiable parameterization. More precisely, if N > K, C must be known, whereas Q is assumed known if K > N . Knowledge of C or Q is normally not available a priori, but estimates may be obtained from so called secondary data, i.e. data which are free from target signals and only contain noise and interference with the same statistics as the primary data set. In pulsed Doppler radar, secondary data may be obtained from range bins adjacent to the primary bin under consideration. The noise parameterization or the possible knowledge of C or Q does not affect the CRB on the signal parameters as long as the noise parameterization is independent of the signal parameters and the model is identifiable. This is due to the fact that the Fisher information matrix (FIM) then becomes block-diagonal w.r.t. the signal and noise parameters. The imposed Kronecker structure on the space-time covariance matrix may not be realistic in all applications. Consider a case that is realistic for an airborne radar system. The noise term is assumed to be composed of three terms; thermal noise, jamming, and clutter. A reasonable assumption on the structure of the thermal noise covariance is that it is spatio-temporally white, while the jamming covariance can be considered temporally white but spatially colored. In [War94] it was shown that the clutter space-time covariance matrix can be modeled as a sum of the contributions of different clutter patches where each term in the sum has a Kronecker structure. However, this does not imply that the sum has a Kronecker structure. Therefore, in 40
2.3. PROBLEM FORMULATION
this case, the noise term will not have a space-time covariance matrix with a Kronecker structure A motivation for assuming a Kronecker structure could instead be, besides computational simplicity, that it accommodates spatially or temporally colored noise in the same model. As alluded to above, the covariance matrix cannot be estimated anyway if both C and Q are unknown, and no other structure is imposed. Therefore, we will in the sequel assume that either C or Q is known. The dimension in which the covariance is known is then reduced to the white noise case by pre-whitening. It is further assumed that the array manifold is unambiguous, i.e. that steering vectors a(θm ) corresponding to distinct DOAs θm , m = 1, . . . , M are linearly independent. This is necessary for the DOAs to be uniquely identifiable from the data (actually, if the ωm s are all distinct, one can relax this assumption). For the asymptotic properties of estimators to apply, it is required that a(θ) possesses bounded derivatives up to third order. The first-order derivative is denoted as � ∂a(θ) �� , (2.13) dθ (θm ) = ∂θ �θ=θm and the matrix of steering vector derivatives is Dθ = [dθ (θ1 ), . . . , dθ (θM )] .
(2.14)
When deriving the CRB expressions, it is convenient to introduce a row-wise slicing of the signal matrix: SN (ω) = ST (ω) = [sN (ω1 ), . . . , sN (ωM )] sN (ωm ) = [s(ωm , 1), . . . , s(ωm , N )]T . The corresponding derivatives are denoted as � ∂sN (ω) �� dω (ωm ) = ∂ω �ω=ωm Dω = [dω (ω1 ), . . . , dω (ωM )] .
(2.15) (2.16)
(2.17) (2.18)
The argument of the various vectors and matrices will frequently be dropped, when there is no risk of confusion. Later on, the asymptotic estimation performance as K → ∞ and N → ∞ will be investigated. The results for the K → ∞ case rely on the assumption that the following matrices 1 H A A, K→∞ K lim
1 H A Dθ , K→∞ K 2 lim
41
1 H Dθ Dθ K→∞ K 3 lim
(2.19)
CHAPTER 2. INTRODUCTION
exist and are diagonal. A similar assumption appeared in [Vib95]. A natural question to ask is, for which class of array configurations are these assumptions satisfied? This question is far from trivial. It is easy to verify, however, that they are satisfied for ULAs. We will not pursue this topic further, but adopt (2.19) when dealing with the case of large K. A similar assumption involving SN and Dω is necessary in the case of large N , see Section 3.3. The latter is valid when the temporal sampling is uniform. A comment on the validity of the data model is in order. Letting K → ∞ may cause the data model to become invalid since the assumptions about far-field and narrowband emitters are violated. Also, the array gain will tend to infinity. It should be understood that the asymptotic analysis is merely a mathematical tool to obtain tractable solutions. We will find by simulation that the asymptotic results are valid with good approximation also for reasonably sized arrays, for which the model is not unrealistic. We would like to end this introduction by explicitly showing the close connection to 2-D frequency estimation. First assume that a ULA with omnidirectional elements that have unity gain is employed. The steering vector can then according to (1.14) be expressed as T � , (2.20) a(θ) = ejφ1 ejφ2 . . . ejφK where φk � −2π(k − 1)d sin(θ)/λ. If we further assume uniform temporal sampling, i.e. tn = n, n = 1, . . . , N , the received signal vector can according to (2.1) be written as y(n) =
M �
bm a(θm )ejωm n + n(n),
n = 1, . . . , N.
(2.21)
m=1
The k-th element in y(n) is then given by yk (n) =
M �
bm ej(φm k+ωm n) + nk (n),
k = 1, . . . , K, n = 1, . . . , N.
m=1
(2.22) In this model, {φm , ωm } are 2-D frequencies. This model is often used in 2-D frequency estimation, see e.g. [Hua92, LSZ96, MS02]. Another model that occurs is, see e.g. [RZZ94, LSZ96], yk (n) =
L � M �
b�m ej(φ� k+ωm n) + nk (n),
k = 1, . . . , K, n = 1, . . . , N.
�=1 m=1
(2.23) 42
2.3. PROBLEM FORMULATION
For the case of L = M , this model corresponds to the model in (2.1) with a full B matrix. We deal only with the case of diagonal B in the thesis. However, the model employed herein is more general than the one in (2.22), since we allow nonuniform sampling and a more general form of the steering vector according to a(θ) =
�
H1 (θ) ej 2πd1 sin(θ)/λ . . .
HK (θ) ej 2πdK sin(θ)/λ
where dk , k = 1, . . . , K, are the element positions.
43
T
,
(2.24)
CHAPTER 2. INTRODUCTION
44
Chapter
3
Estimation Using the 2-D Model In this chapter we will present performance bounds and methods assuming the full 2-D data model is exploited. This is clearly advantageous from a performance point of view, but leads to computationally expensive estimation methods. Therefore, the next chapter is devoted to methods based on decoupled 1-D data models.
3.1
General CRB for Parameterized Signals
In order to have a benchmark, the presentation begins by studying the achievable performance. We first derive the CRB for a general nonlinear signal parameterization, and later specialize to the case of DOA/Doppler estimation which is of major concern herein. Therefore, let each of the M source signals be uniquely described by a known, parameter dependent, complex function x(αm , n) , m = 1, . . . , M , where αm is an r-dimensional column vector of signal parameters for the m-th source, functionally independent of the DOAs. The number of signal parameters per source, r, is finite. Note that this corresponds to a deterministic, parameter dependent signal model. Examples are the sinusoidal signal model and polynomial phase signals. Now, the K-vector, y(n), of sensor outputs, observed in additive noise, n(t), is modeled by the following generalization of (2.1) y(n) = A(θ)x(α, n) + n(n) , n = 1, . . . , N ,
(3.1)
x(α, n) = [x(α1 , n), . . . , x(αM , n)]T .
(3.2)
where Collect the observations in the KN -vector yN � T yN = vec(Y) = yT (1), . . . , yT (N ) . 45
(3.3)
CHAPTER 3. ESTIMATION USING THE 2-D MODEL
Since the signal is deterministic and the noise is complex Gaussian with covariance matrix given by (2.12), yN is distributed as yN ∈ N (m(θ, α), C ⊗ Q) , where the mean vector is given by �T � T T . m(θ, α) = (A(θ)x(α, 1)) , . . . , (A(θ)x(α, N ))
(3.4)
(3.5)
The likelihood function is therefore given by (see e.g. [Kay93, Section 15.7]) p(yN ; η) =
π KN
� � 1 exp −(yN − m)H (C ⊗ Q)−1 (yN − m) , (3.6) |C ⊗ Q|
where η is a real vector representing the unknown parameters. Since the noise covariance matrix does not depend on the signal parameters, the FIM has a block diagonal structure. This implies that the CRB for the signal parameters is the same whether or not the noise covariance is known (of course, all unknown parameters must be uniquely identifiable). Estimation of the noise properties will therefore be ignored in this section, and only the FIM and CRB for the signal parameters will be derived. Thus, let the unknown parameter vector be T � α1,1 . . . αM,1 . . . α1,r . . . αM,r θ1 . . . θM , η = where αk,l is the l-th parameter in αk . The following general expression for the (r, s)-th element of the FIM is obtained from [Kay93, Section 15.7] �
∂mH (θ, α) −1 ∂m(θ, α) . (3.7) (C ⊗ Q) Jrs = 2Re ∂ηs ∂ηr It is now straightforward to derive the following. Theorem 3.1 The CRB for η is E[(ˆ η − η)(ˆ η − η)T ] ≥ J−1
(3.8)
ˆ represents any unbiased estimator of η, and the notation A ≥ B where η means that A − B is positive semidefinite. The FIM has the block structure J1,r+1 J1,1 . . . J1,r .. .. .. ... . . J = T. , J1,r . . . Jr,r Jr,r+1 JT1,r+1 . . . JTr,r+1 Jr+1,r+1 46
3.2. CRB FOR THE 2-D MODEL
where the blocks are given by � � H Jk,l = 2Re (X�k C−1 X�l ) � (AH Q−1 A) , k, l = 1 . . . r , � � H Jk,r+1 = 2Re (X�k C−1 X) � (AH Q−1 Dθ ) , k = 1 . . . r , � −1 Jr+1,r+1 = 2Re (XH C−1 X) � (DH θ Q Dθ ) . Here, � denotes element-wise matrix multiplication (Hadamard product), and, further, the following definitions are utilized x1 . . . xM � � ∂xM ∂x1 ... , = ∂α1,k ∂αM,k
X = X�k and xk =
�
�
x(αk , 1) . . .
x(αk , N )
T
.
The matrix A is the steering matrix corresponding to the true directions of arrival, and Dθ the matrix of steering vector derivatives (2.14). Proof: Straightforward calculations using (3.7). The details for the case C = I are given in [Eri02].
3.2
CRB for the 2-D Model
The above result applies to a general parameterization of the emitter signals. We will now return to the application of main concern herein. Thus, let the signal be given as x(α, n) = Bs(ω, n), i.e., the data model according to (2.1) is y(n) = A(θ)Bs(ω, n) + n(n) , n = 1, . . . , N. (3.9) Since we are mainly concerned with estimation of the DOA and Doppler parameters, only the bound for these estimates will be presented. The corresponding result for the complex amplitudes can be deduced from the proof. ˆ be unbiased estimates of the DOA and Doppler ˆ and θ Theorem 3.2 Let ω parameters. Then it holds that � E
ˆ −ω ω ˆ−θ θ
��
ˆ −ω ω ˆ−θ θ
�
�T
47
≥
Cωω Cωθ CTωθ Cθθ
� .
(3.10)
CHAPTER 3. ESTIMATION USING THE 2-D MODEL
The blocks in the above matrix are given by Cωω =
�
2RTω P⊥ R θ Rω
�−1
(3.11)
�−1
2RTθ P⊥ R ω Rθ �−1 † � T ⊥ = − 2Rω PRθ Rω (Rθ Rω )T ,
Cθθ = Cωθ
�
(3.12) (3.13)
where † P⊥ R θ = I − Rθ Rθ ,
R†θ = (RTθ Rθ )−1 RTθ
(3.14)
R†ω = (RTω Rω )−1 RTω .
(3.15)
† P⊥ R ω = I − Rω Rω ,
and the following definitions have been utilized � Rω =
Re[P⊥ Υ Υω B] Im[P⊥ Υ Υω B]
�
� ,
Rθ =
Re[P⊥ Υ Υθ B] Im[P⊥ Υ Υθ B]
� ,
(3.16)
where P⊥ Υ Υ Υω Υθ
= = = =
I − Υ(ΥH Υ)−1 ΥH (C−1/2 SN ) � (Q−1/2 A) (C−1/2 Dω ) � (Q−1/2 A) (C−1/2 SN ) � (Q−1/2 Dθ ).
(3.17) (3.18) (3.19) (3.20)
Here, � denotes the Khatri-Rao product (column-wise Kronecker product, see [Bre78]) and M1/2 denotes a Hermitian square-root factor of the matrix M, i.e. M = M1/2 M1/2 and M−1 = M−1/2 M−1/2 . Furthermore, the signal matrix SN = ST and the corresponding matrix of derivatives Dω are defined in (2.15)–(2.18). Proof: See Appendix 3A.
3.3
Asymptotic CRB for the 2-D Model
Although explicit expressions for the bounds on the DOA and Doppler estimation errors are given above, they might appear somewhat unwieldy. As we will see, much simpler results are obtained in the large sample case, assuming either K or N to be large. 48
3.3. ASYMPTOTIC CRB FOR THE 2-D MODEL
Large Number of Antenna Elements The first case considered assumes that K is “large enough”. The following additional assumptions are necessary to simplify the bound: • The matrices limK→∞ K1 AH A, limK→∞ K12 AH Dθ , limK→∞ K13 DH θ Dθ exist and are all diagonal. This is valid, for example, for a ULA. • The noise is spatially white and (possibly) temporally colored, i.e. Q = I. We then have the following result: Theorem 3.3 For K → ∞, the 2-D DOA and Doppler CRB matrices Cθθ and Cωω are both diagonal and Cωθ = 0. The m-th diagonal elements are obtained by evaluating the expressions cθ = cω
1
⊥ dH θ Pa dθ 1 = ⊥ 2 H −1/2 2|b| dω C PC−1/2 sN C−1/2 dω aH a
2|b|2
−1 sH N C sN
(3.21) (3.22)
at the true parameter values ωm , θm and bm . Here, the projection matrices −1/2 C−1/2 sN sH aaH and P⊥ NC = I − = I − . The are defined as P⊥ a −1 C−1/2 sN aH a sH N C sN ˆ m are equal to the corresponding expressions asymptotic bounds for θˆm and ω for the single-source case. Proof: See Appendix 3B. As one could expect, the asymptotic bound for θˆm is equal to the single-source bound. This is because the array aperture increases without limit as K → ∞. What is perhaps more surprising is that the bound on ω ˆ m also reduces to the single-source case, although no assumption on N is made. Apparently, it is sufficient to resolve the sources in one dimension to also decouple the problem in the other dimension. As we will see later, the asymptotic 2-D CRB expressions are in fact attainable also using the decoupled 1-D/1-D signal model.
Large Number of Pulses We now turn to the dual case N → ∞. The extra assumptions above are now replaced by: 49
CHAPTER 3. ESTIMATION USING THE 2-D MODEL
1 1 H H • The matrices limN →∞ N1 SH N SN , limN →∞ N 2 Dω SN , limN →∞ N 3 Dω Dω exist and are all diagonal. This is true for uniformly sampled data.
• The noise is (possibly) spatially colored but temporally white, i.e. C = I. Theorem 3.4 For N → ∞, the 2-D DOA and Doppler CRB matrices Cθθ and Cωω are both diagonal and Cωθ = 0. The m-th diagonal elements are obtained by evaluating the expressions cθ = cω =
1 2|b|2
sH N sN
−1/2 P⊥ dH Q−1/2 dθ θ Q Q−1/2 a
1 ⊥ H −1 2|b|2 dH ω PsN dω a Q a
(3.23) (3.24)
at the true parameter values ωm , θm and bm . The asymptotic bounds for θˆm and ω ˆ m are equal to the corresponding expressions for the single target case. Proof: See Appendix 3B. Also in this case, the asymptotic CRB reduces to the single target case. It is interesting to note that the asymptotic CRB expressions for the case of large K and large N coincide when the noise is both spatially and temporally white. Simpler expressions for the asymptotic 2-D CRB can be obtained if we consider the special case of a ULA with one-half wavelength element separation, uniform temporal sampling and spatio-temporally white noise. From the theorems above the following expressions are readily obtained 6σ 2 1 2 · 2 2 N K (K − 1) |b| π cos2 θ 6σ 2 = , N K (N 2 − 1) |b|2
cθ =
(3.25)
cω
(3.26)
where σ 2 is the noise variance. In this form, it is easy to see how pertinent system design parameters affect the ultimate estimation accuracy. Note that these expressions are consistent with the early results in [Bre61, Ban71, RB74] on the CRB for (spatial or temporal) frequency estimation of a single signal. 50
3.4. 2-D MAXIMUM LIKELIHOOD ESTIMATION
3.4
2-D Maximum Likelihood Estimation
To apply the ML method we need the likelihood function of the observed data. The estimates are then obtained as the parameter values that maximize this function. An interpretation of this method is that the estimates are the parameter values that make the observed data most probable. The likelihood function for a general signal model is given in (3.6) p(yN ; η) =
� � 1 H −1 − m) (C ⊗ Q) (y − m) , (3.27) exp −(y N N π KN |C ⊗ Q|
where, here, m = vec(ABS). As alluded to previously, it is not possible to estimate both C and Q jointly with the signal parameters. We will therefore first consider the case of known noise color, and then the case where N > K and only C is known. The analogous case where K > N and Q is known can be obtained in a similar manner.
Known noise color Let us first assume that C and Q are known (possibly up to scaling). One can then pre-whiten the data by the transformation yN W = (C ⊗ Q)−1/2 yN = (C−1/2 ⊗ Q−1/2 )yN .
(3.28)
Using the properties of Kronecker products [Bre78], it is easy to see that (3.28) can efficiently be implemented as � � (3.29) yN W = vec Q−1/2 YC−T /2 . After the pre-whitening operation, the noise becomes temporally and spatially white. To keep the notation simple, we will therefore take C = σ 2 I and Q = I, and keep in mind that the signal model needs to be modified when the noise is colored (see further Section 3.5). The unknown parameters are then θ, ω, σ 2 , and b � Diag{B}. Maximizing the likelihood function is equivalent to minimizing the negative log-likelihood function, which in this case reduces to VM L (ω, θ, b, σ 2 ) = − log p(yN ; ω, θ, b, σ 2 ) N 1 � 2 [y(n) − A(θ)Bs(ω, n)]H [y(n) − A(θ)Bs(ω, n)] = KN log(πσ ) + 2 σ n=1 � 1 � = KN log(πσ 2 ) + 2 Tr [Y − A(θ)BS(ω)]H [Y − A(θ)BS(ω)] σ 1 2 = KN log(πσ ) + 2 �Y − A(θ)BS(ω)�2F , (3.30) σ 51
CHAPTER 3. ESTIMATION USING THE 2-D MODEL
where Y and S(ω) are defined in (2.6)–(2.7) and � · �F denotes the Frobenius matrix norm. For fixed ω, θ, b; the minimum of VM L w.r.t. σ 2 is easily found as σ ˆ2 =
1 �Y − A(θ)BS(ω)�2F . KN
(3.31)
This estimate can then be substituted back into (3.30) (see [GP73] for motivation of such an operation). Thus, � � π 2 (3.32) VM L (ω, θ, b) = KN log �Y − A(θ)BS(ω)�F + KN. KN Minimizing this expression w.r.t. the unknown parameters is equivalent to minimizing VM L (ω, θ, b) = �Y − A(θ)BS(ω)�2F ,
(3.33)
where the notation VM L (ω, θ, b) has been retained for convenience. We note in passing that minimizing (3.33) yields the MLE of ω, θ and b also if σ 2 is known. Using the formula [Bre78] � (3.34) vec [A(θ)BS(ω)] = ST (ω) � A(θ) Diag{B}, we can write (3.33) as VM L (ω, θ, b) = � vec [Y − A(θ)BS(ω)]�2F � �2 � = � vec(Y) − ST (ω) � A(θ) Diag{B}� = �yN −
Υ(ω, θ)b�2F ,
F
(3.35)
where Υ(ω, θ) = ST (ω) � A(θ).
(3.36)
In this form, VM L (ω, θ, b) is readily minimized w.r.t. b for fixed ω and θ, yielding � � ˆ = ΥH Υ −1 ΥH yN . (3.37) b Substituting into (3.35), results in the final expression
where
�2 � � , VM L (ω, θ) = �P⊥ (ω, θ)y N Υ F
(3.38)
� H �−1 H P⊥ Υ . Υ (ω, θ) = I − Υ Υ Υ
(3.39)
52
3.4. 2-D MAXIMUM LIKELIHOOD ESTIMATION
The ML solution for DOA/Doppler estimation is thus given by the solution to the 2-D nonlinear LS problem � � � �2 � . (ω, θ)y (3.40) ω ˆ , θˆ = arg min �P⊥ N Υ F ω,θ
Although this optimization problem is actually 2M -dimensional, we call it 2-D since it is a joint problem in two frequency dimensions, namely the spatial (DOA) and temporal (Doppler) frequencies. This is in contrast to the 1-D problems (which are M -dimensional optimization problems), where the estimation is performed in one of the frequency dimensions.
Known temporal noise covariance Let us now turn to the more difficult case of colored noise, where C is known but Q is to be estimated. From (3.6), the negative log-likelihood function is in this case obtained as VM L (ω, θ, b, Q) = N log |Q| + [yN − vec(ABS)]H (C ⊗ Q)−1 [yN − vec(ABS)] ,
(3.41)
where parameter-independent terms have been ignored, and we have used that [Bre78] (3.42) |C ⊗ Q| = |C|K |Q|N . Again, applying formulas from [Bre78] involving the vectorization operator and the Kronecker product, one finds that � � VM L (ω, θ, b, Q) = N log |Q| + Tr Q−1 (Y − ABS)C−T (Y − ABS)H . (3.43) Minimizing (3.43) w.r.t. Q (see e.g. [MKB79, HS92, SS98]) results in ˆ = 1 (Y − ABS)C−T (Y − ABS)H . Q N Substituting back into (3.43) we obtain the MLE in the form � � ˆ b} ˆ = arg min �(Y − ABS)C−T (Y − ABS)H � . ˆ θ, {ω, ω,θ,b
(3.44)
(3.45)
Unfortunately, no explicit solution of (3.45) with respect to b is known, so in this case one must resort to a nonlinear optimization over 4M real parameters. Reducing this to 2M is the motivation for the next method. 53
CHAPTER 3. ESTIMATION USING THE 2-D MODEL
3.5
2-D Weighted Least Squares
The weighted least squares (WLS) principle is a common suboptimal technique in statistical signal processing [Kay93]. In our case, the criterion can be motivated by the second term of (3.43), which is expressed as � � VW LS (ω, θ, b) = Tr WQ (Y − ABS)WC (Y − ABS)H 1/2
1/2
= �WQ (Y − ABS)WC �2F .
(3.46)
Here, WQ and WC are arbitrary positive definite weighting matrices. The WLS approach itself makes no assumptions about the distribution or correlation of the data, so (3.46) can simply be motivated as selecting the model that fits the observed data best, in a (possibly weighted) least squares sense. However, from (3.43) we know that ML and WLS are equivalent under the stated assumptions on the noise, provided the weighting matrices are chosen as WQ = Q−1 and WC = C−T . Clearly, this requires the noise properties to be known. However, an interesting fact is that the optimal weighting matrices can be replaced by consistent estimates without changing the asymptotic properties of the WLS estimates. In essence, this is because the estimation of the parameters of a deterministic signal is decoupled from estimating the noise properties, i.e. the corresponding FIM is block diagonal [Kay93]. This means that asymptotically efficient estimates can be obtained using estimated noise properties. As previously explained, Q and C cannot be simultaneously estimated, unless some further structure is imposed. Thus, following the case presented above, it will be assumed that C is known and N > K. The analogous case where instead Q is known is omitted. Now, it is clear that any positive definite weighting matrices can be used to provide consistent, but not efficient, preliminary estimates of ω, θ and b [Eri02]. These are then used to yield consistent estimates of the unknown noise properties, e.g. by (3.44). Finally, efficient signal parameter estimates are obtained by again minimizing (3.46), but this time using the approximately optimal weighting. According to [Eri02], a reasonable choice of spatial weighting, especially for low signal to noise ratios, is � �−1 ˆ , (3.47) WQ = R + αI ˆ is the sample spatial covariance matrix of the data, defined by where R ˆ = 1 YYH , R N
(3.48)
ˆ better conand αI, α relatively small, is a regularization which makes R ditioned. The regularization technique is in the array processing literature 54
3.5. 2-D WEIGHTED LEAST SQUARES
often referred to as “diagonal loading”, [Car88]. If this matrix is used as weighting, the resulting estimates will “almost” be asymptotically efficient for low to moderate signal to noise ratios. For very high signal to noise ratios, ˆ significantly deviates from Q, care has to be taken so that the use when R of WQ as defined in Equation (3.47) does not result in a cancellation of the interesting source signals [Cox73]. This, together with a variance reduction, is the motivation for employing regularization. Let us now elaborate on the minimization of (3.46). The WLS problem is brought back to the unweighted LS criterion (3.33) by absorbing the weighting matrices into the data and the signal model. Defining 1/2
1/2
YW = WQ YWC 1/2
AW = WQ A 1/2
SW = SWC
(3.49) (3.50) (3.51) (3.52)
results in the formulation VWLS (ω, θ, b) = �YW − AW BSW �2F .
(3.53)
Therefore, the signal parameter estimates are obtained similar to (3.37) and (3.40) as � � ˆ = ΥH ΥW −1 ΥH yN W b W W � � � ⊥ �2 ω ˆ , θˆ = arg min �PΥW (ω, θ)yN W �F ω,θ
yN W = vec (YW ) ΥW = STW � AW .
(3.54) (3.55) (3.56) (3.57)
The 2-D WLS approach is now summarized as follows: 1. Solve (3.55) using column-weighting (3.47) and row-weighting WC = C−T . 2. Using the signal parameter estimates from Step 1, compute (3.54) and then (3.44). −1
ˆ . 3. Solve (3.55) again, using WQ = Q 55
CHAPTER 3. ESTIMATION USING THE 2-D MODEL
3.6
Performance
The methods considered so far exploit the full 2-D data model, leading to high computational complexity. The resulting estimation accuracy is therefore of great interest. Unfortunately, exact expressions for the estimation error variance are not known, and would be overwhelmingly complicated. The standard approach is then to resort to an asymptotic analysis of the estimators. We will only consider the case of large N , the dual case of large K being similar. We will use a result from [Eri02] where consistency and the asymptotic distribution of the 2-D WLS estimator were derived under the following assumptions: 1. Each source is described by a unique {θ, ω} pair. 2. The number of sources satisfies M ≤ K/2. 3. The sequence of noise samples are zero mean, temporally independent, i.e. C = I, and have bounded fourth order moments. 4. The temporal sampling is uniform, i.e. t = 1, . . . , N . In the case of Gaussian distributed noise and a weighting matrix given by ˆ −1 , where Q ˆ is a consistent estimate of Q, the estimator was shown WQ = Q to be asymptotically efficient as N → ∞. We can then make use of Theorem 3.4 to obtain a simple, explicit expression for the variance of the asymptotic distribution of the estimation error. The result is E[(θˆm − θm )2 ] = E[(ˆ ωm − ωm )2 ] =
1 −1/2 P⊥ 2N |b|2 dH Q−1/2 dθ θ Q Q−1/2 a
6 ⊥ H −1 N 3 |b|2 dH ω PsN dω a Q a
(evaluated at bm , ωm and θm ).
56
(3.58) (3.59)
3.6. PERFORMANCE
3A
Derivation of the 2-D CRB
In this section, we derive the CRB on the DOA and Doppler parameters using the full 2-D model in 2.1. To this end, we use the general CRB for parameterized signals given in Theorem 3.1. The parameter vector is given by ˜ T ω T θ T ]T ¯T b η=[ b ¯ � Re[b] and b ˜ � Im[b]. where b as J¯b¯b JT ¯˜ J = Tbb J¯bω J¯Tbθ
(3A.1)
From Theorem 3.1 the FIM can be written J¯b˜b
J¯bω
J˜b˜b
J˜bω
J¯bθ
J˜Tbω Jωω
J˜bθ , Jωθ
J˜Tbθ
Jθθ
JTωθ
(3A.2)
where � −1 H −1 J¯b¯b = 2Re (SH C S ) � (A Q A) N � N H −1 J¯b˜b = −2Im (SN C SN ) � (AH Q−1 A) � −1 H −1 J¯bω = 2Re (SH N C Dω B) � (A Q A) � −1 H −1 J¯bθ = 2Re (SH C S B) � (A Q D ) N θ � N −1 H −1 J˜b˜b = 2Re (SH N C SN ) � (A Q A) � −1 H −1 J˜bω = 2Im (SH N C Dω B) � (A Q A) � −1 H −1 J˜bθ = 2Im (SH N C SN B) � (A Q Dθ ) � −1 H −1 Jωω = 2Re (BH DH ω C Dω B) � (A Q A) � −1 H −1 Jωθ = 2Re (BH DH ω C SN B) � (A Q Dθ ) � −1 H −1 Jθθ = 2Re (BH SH N C SN B) � (Dθ Q Dθ ) .
(3A.3) (3A.4) (3A.5) (3A.6) (3A.7) (3A.8) (3A.9) (3A.10) (3A.11) (3A.12)
Define � Jbb �
J¯b¯b J¯b˜b J¯Tb˜b J˜b˜b
�
� ,
J1 �
J¯bω J¯bθ J˜bω J˜bθ
�
The FIM can then be written as � � Jbb J1 J= . JT1 J2 57
� ,
J2 �
Jωω Jωθ JTωθ Jθθ
� . (3A.13)
(3A.14)
CHAPTER 3. ESTIMATION USING THE 2-D MODEL
We are interested in the CRB matrix for the DOAs and Doppler frequencies. This is given by the lower right 2M × 2M block of the inverse of the FIM. Using a rule for the inverse of a partitioned matrix this is given by �
Cωω Cωθ CTωθ Cθθ
�
�−1 � = J2 − JT1 J−1 J . 1 bb
(3A.15)
Now, define the following E F H G
−1 H −1 ¯ ˜ 2(SH N C Dω B) � (A Q A) = E + j E −1 H −1 ¯ ˜ 2(SH N C SN B) � (A Q Dθ ) = F + j F −1 H −1 ¯ ˜ 2(SH N C SN ) � (A Q A) = H + j H ¯ + j G. ˜ H−1 = G
� � � �
(3A.16) (3A.17) (3A.18) (3A.19)
We then have � Jbb =
¯ −H ˜ H ˜ ¯ H H
�
� ,
J1 =
¯ F ¯ E ˜ ˜ E F
� .
(3A.20)
From Appendix E, result R4 in [SN89] it follows that � J−1 bb
=
¯ −G ˜ G ˜ ¯ G G
� .
(3A.21)
Some straightforward calculations then lead to
� JT1 J−1 bb J1
= Re
EH H−1 E EH H−1 F (EH H−1 F)T FH H−1 F
�� .
(3A.22)
Substituting into (3A.15) we obtain �
Cωω Cωθ CTωθ Cθθ
�
� =
Jωω − Re[EH H−1 E] Jωθ − Re[EH H−1 F] JTωθ − Re[EH H−1 F]T Jθθ − Re[FH H−1 F]
�−1 . (3A.23)
Defining Φ � Jωω − Re[EH H−1 E] Ψ � Jθθ − Re[FH H−1 F] ∆ � Jωθ − Re[EH H−1 F], 58
(3A.24) (3A.25) (3A.26)
3.6. PERFORMANCE
and using standard rules for the inverse of a partitioned matrix, we obtain �−1 � (3A.27) Cωω = Φ − ∆Ψ−1 ∆T � � −1 (3A.28) Cθθ = Ψ − ∆T Φ−1 ∆ � � −1 ∆Ψ−1 . (3A.29) Cωθ = − Φ − ∆Ψ−1 ∆T To simplify these expressions, define Υ = (C−1/2 SN ) � (Q−1/2 A) Υω = (C−1/2 Dω ) � (Q−1/2 A) Υθ = (C−1/2 SN ) � (Q−1/2 Dθ ),
(3A.30) (3A.31) (3A.32)
and note that (UH W) � (VH Z) = (U � V)H (W � Z)
(3A.33)
for matrices with compatible dimensions. Substituting the definitions in (3A.30)–(3A.32) into (3A.16)–(3A.18) and using (3A.33) we obtain E = 2ΥH Υω B,
F = 2ΥH Υθ B,
H = 2ΥH Υ.
(3A.34)
Similarly, � Jωω = 2Re BH ΥH ω Υω B � Jθθ = 2Re BH ΥH θ Υθ B � Jωθ = 2Re BH ΥH ω Υθ B . Inserting (3A.34)–(3A.37) into (3A.24)–(3A.26) then gives � ⊥ Φ = 2Re BH ΥH ω PΥ Υω B � ⊥ Ψ = 2Re BH ΥH θ PΥ Υθ B � ⊥ ∆ = 2Re BH ΥH P Υ B θ Υ ω
(3A.35) (3A.36) (3A.37)
(3A.38) (3A.39) (3A.40)
where H −1 H P⊥ Υ = I − Υ(Υ Υ) Υ .
(3A.41)
The CRB matrices are then obtained by substituting (3A.38)–(3A.40) into (3A.27)–(3A.29). Compact expressions can be obtained if we define � � � � Re[P⊥ Re[P⊥ Υ Υω B] Υ Υθ B] , Rθ = . (3A.42) Rω = Im[P⊥ Im[P⊥ Υ Υω B] Υ Υθ B] 59
CHAPTER 3. ESTIMATION USING THE 2-D MODEL
This leads to � −1 � � T 2 Rω Rω − RTω Rθ (RTθ Rθ )−1 RTθ Rω �−1 � = 2RTω P⊥ R θ Rω
Cωω =
(3A.43)
T −1 T where P⊥ Rθ = I − Rθ (Rθ Rθ ) Rθ . Similarly,
�−1 2RTθ P⊥ R ω Rθ �−1 † � = − 2RTω P⊥ (Rθ Rω )T . R θ Rω
Cθθ = Cωθ
�
(3A.44) (3A.45)
This completes the proof of Theorem 3.2.
3B
Derivation of the Asymptotic 2-D CRBs
In this section, we derive the asymptotic CRBs given in Theorem 3.3 and 3.4 respectively. In order to obtain a well defined CRB in the limit a proper normalization of the CRB matrix is crucial. We start with the case of large number of antennas and then give the case of large number of pulses.
Large Number of Antenna Elements Starting from (3A.27)-(3A.28) we derive the asymptotic normalized CRBs � ¯ θθ = C
3
lim K Cθθ = lim
K→∞
�
=
K→∞
�−1 ¯ −∆ ¯ TΦ ¯ −1 ∆ ¯ Ψ ,
1 1 Ψ − 2 ∆T 3 K K
�
�−1 1 1 Φ ∆ K K2
−1
(3B.1)
and � ¯ ωω = C
lim KCωω = lim
K→∞
�
=
K→∞
¯ −∆ ¯Ψ ¯ −1 ∆ ¯T Φ
�−1
1 1 Φ − 2∆ K K
�
1 Ψ K3
�−1
1 T ∆ K2
,
−1
(3B.2)
where ¯ = lim 1 Φ, Φ K→∞ K
1 Ψ, K→∞ K 3
¯ = lim Ψ
60
1 ∆. K→∞ K 2
¯ = lim ∆
(3B.3)
3.6. PERFORMANCE
According to the assumptions, all the asymptotic normalized matrices given above exist and are diagonal. For example, from the definition above and ¯ is given by (3A.24), Φ � ¯ = lim 2Re (BH DH C−1 Dω B) � ( 1 AH A) Φ ω K→∞ K � �� �−1 1 H 1 H H H −1 H −1 − (B Dω C SN ) � ( A A) (SN C SN ) � ( A A) K K � � 1 H −1 × (SH (3B.4) A A) . N C Dω B) � ( K According to the assumptions, limK→∞ K1 AH A is diagonal and, due to the ¯ will be diagonal. The matrix operations in Hadamard products in (3B.4), Φ (3B.4) can thus be replaced by their scalar counterparts. The m-th diagonal ¯ is then easily found as element in Φ � −1 H H −1 H |b|2 dH 1 ω C sN a asN C dω a a −1 H ¯ mm = lim C d a a − 2Re |b|2 dH {Φ} ω ω −1 H K→∞ K sH N C sN a a � � −1/2 1 C−1/2 sN sH NC 2 H H −1/2 = lim I− C−1/2 dω 2|b| a adω C −1 s K→∞ K sH C N N 1 2 H H −1/2 ⊥ −1/2 = lim PC−1/2 sN C dω , (3B.5) 2|b| a adω C K→∞ K where the arguments of bm , dω (ωm ), a(θm ) and sN (ωm ) have been suppressed ¯ and ∆ ¯ are also diagonal, with diagonal for brevity. By similar arguments, Ψ elements given by 1 −1 H ⊥ 2|b|2 sH (3B.6) N C sN dθ Pa dθ K→∞ K 3 � 2 H −1 1 H 2 H −1 H = lim 2Re |b| d C s a d − |b| d C s a d N θ N θ ω ω K→∞ K 2 = 0. (3B.7)
¯ mm = {Ψ} ¯ mm {∆}
lim
Thus, we obtain ¯ −1 , ¯ θθ = Ψ C
¯ ωω = Φ ¯ −1 , C
and
lim Cωθ = 0.
K→∞
(3B.8)
¯ ωω are given by ¯ θθ and C The m-th diagonal elements in C ¯ θθ }mm = {C ¯ ωω }mm = {C
lim K 3
K→∞
lim K
K→∞
1 H ⊥ −1 2|b|2 sH N C sN dθ Pa dθ
1 −1/2 P⊥ 2|b|2 aH adH C−1/2 dω ωC C−1/2 sN
61
(3B.9) . (3B.10)
CHAPTER 3. ESTIMATION USING THE 2-D MODEL
This means that for sufficiently large K, the DOA and Doppler CRBs are given by cθ = cω =
1
(3B.11)
H ⊥ −1 2|b|2 sH N C sN dθ Pa dθ
1 −1/2 P⊥ 2|b|2 aH adH C−1/2 dω ωC C−1/2 sN
.
(3B.12)
Clearly, the single-source bound will be the same as this asymptotic bound since a diagonal element in the diagonal matrices above is the same as if only one source was present.
Large Number of Pulses When N → ∞, different normalizations of the asymptotic CRB matrices are required. Thus we derive the following asymptotic normalized CRBs � −1 � �−1 1 1 1 1 T ¯ θθ = lim N Cθθ = lim Φ ∆ Ψ − 2∆ C N →∞ N →∞ N N N3 N2 �−1 � ¯ −1 ∆ ¯ ¯ −∆ ¯ TΦ = Ψ (3B.13) and
� ¯ ωω = C
3
lim N Cωω = lim
N →∞
�
=
N →∞
¯T ¯ −∆ ¯Ψ ¯ −1 ∆ Φ
�−1
1 1 Φ − 2∆ 3 N N
�
�−1 1 1 T ∆ Ψ N N2
−1
(3B.14)
where we now have the normalizations ¯ = lim 1 Ψ, ¯ = lim 1 ∆. (3B.15) ¯ = lim 1 Φ, Ψ ∆ Φ 3 N →∞ N N →∞ N N →∞ N 2 By similar arguments as in the case of K → ∞, the matrices above exist and are diagonal. Proceeding as in (3B.4)–(3B.7) yields (in this case, the first factors in the Hadamard products are diagonal) � ¯ = lim 2Re (BH 1 DH Dω B) � (AH Q−1 A) Φ N →∞ N3 ω � �� �−1 1 H H 1 H H −1 H −1 − (B D SN ) � (A Q A) ( SN SN ) � (A Q A) N2 ω N � � 1 × ( 2 SH Dω B) � (AH Q−1 A) , (3B.16) N N 62
3.6. PERFORMANCE
with diagonal elements ¯ mm {Φ}
� 1 H −1 = lim 2Re |b|2 dH ω dω a Q a N →∞ N 3 � H −1 H H −1 |b|2 dH ω sN a Q asN dω a Q a − H −1 sH N sN a Q a 1 ⊥ H −1 = lim 2|b|2 dH ω PsN dω a Q a. N →∞ N 3
(3B.17)
Furthermore,
� 1 H −1 lim 2Re |b|2 sH N sN dθ Q dθ N →∞ N � H −1 H H −1 |b|2 sH N sN dθ Q asN sN a Q dθ − H −1 sH N sN a Q a 1 H −1/2 ⊥ = lim PQ−1/2 a Q−1/2 dθ , (3B.18) 2|b|2 sH N sN dθ Q N →∞ N � 1 H −1 2 H H −1 = lim 2Re |b|2 dH ω sN a Q dθ − |b| dω sN a Q dθ = 0. 2 N →∞ N (3B.19)
¯ mm = {Ψ}
¯ mm {∆}
Thus, we obtain ¯ θθ = Ψ ¯ −1 , C
¯ ωω = Φ ¯ −1 , C
and
lim Cωθ = 0.
N →∞
(3B.20)
¯ θθ and C ¯ ωω are given by The m-th diagonal elements in C ¯ θθ }mm = {C ¯ ωω }mm = {C
lim N
N →∞
1 2|b|2
lim N 3
N →∞
sH N sN
−1/2 P⊥ dH Q−1/2 dθ θ Q Q−1/2 a
1 ⊥ 2|b|2 dH ω PsN dω
aH Q−1 a
.
(3B.21) (3B.22)
This means that for sufficiently large N the DOA and Doppler CRBs are given by 1
cθ = cω
H −1/2 ⊥ 2|b|2 sH PQ−1/2 a Q−1/2 dθ N sN dθ Q 1 = . 2 H ⊥ 2|b| dω PsN dω aH Q−1 a
(3B.23) (3B.24)
Using the same argument as in the K → ∞ case, this asymptotic bound will be the same as the single target bound. This completes the proof of Theorems 3.3 and 3.4. � 63
CHAPTER 3. ESTIMATION USING THE 2-D MODEL
64
Chapter
4
Estimation Using a Decoupled 1-D/1-D Model The underlying idea in the 1-D/1-D approach is to perform the 2-D estimation in two steps. This is possible by first relaxing the parameterization in one of the dimensions. Although this increases the number of free parameters, we shall see that the loss in estimation accuracy can be made negligible in large samples. The idea was first presented in [SS98] for the case of a single source, and we extend it here to multiple sources.
4.1
CRB for the 1-D Models
To begin with, we investigate the achievable performance, as dictated by the CRB, using the decoupled model.
Spatial Data Model Relaxing the temporal signal parameterization, the 1-D DOA model is expressed as in (1.12) y(n) = A(θ)x(n) + n(n),
n = 1, . . . , N .
(4.1)
The signal samples x(n), n = 1, . . . , N , are considered deterministic parameters to be estimated along with θ. Since the Doppler parameterization is not utilized, the DOA parameters are uniquely determined by (4.1) only if they are distinct. Also, the number of signals, M , must be less than the number of sensors, K. As before, the FIM is block diagonal, so that the CRB on θ and x(n) does not depend on the parameterization of the noise 65
CHAPTER 4. ESTIMATION USING A DECOUPLED 1-D/1-D MODEL
covariance. However, using the decoupled model (4.1) it is no longer possible to estimate the spatial covariance Q. Thus, only C can be unknown in this case, and therefore K > N is assumed. The CRB for the case of white noise was derived in [SN89]. The extension to colored noise is immediate using the pre-whitening approach, and results in ˆ be an unbiased estimator of θ in (4.1). Assume that Q Theorem 4.1 Let θ is known, M < K, N < K (if C ∝ I the latter condition is not needed); and that θm = θl for m = l. Then, the CRB for the DOA parameters is given by ˆ − θ)(θ ˆ − θ)T ] ≥ Cθ E[(θ � � ��−1 (4.2) H −1 H −1/2 ⊥ −1/2 Cθ = 2Re (XN C XN ) � (Dθ Q PQ−1/2 A Q Dθ ) , where
x1 (1) · · · xM (1) .. .. XN = . . . x1 (N ) · · · xM (N )
(4.3)
Proof: If the noise parameterization is functionally independent of the signal parameters the FIM will be block-diagonal with respect to the signal and noise parameters. Therefore, the CRB on the signal parameters is the same whether the noise covariance is known or not. Without loss of generality, we can therefore assume that the noise covariance matrix is known. The theorem then follows by applying the CRB for the white noise case in [SN89] to the pre-whitened data model YW = Q−1/2 YC−T /2 = AW (θ)XW + NW .
Temporal Data Model Similar to (4.1), the unstructured 1-D Doppler model is given by y(n) = Γs(ω, n) + n(n),
n = 1, . . . , N .
(4.4)
where, now, the elements of the complex K × M matrix Γ are regarded as free parameters. By symmetry, we obtain the dual result of Theorem 4.1 as: Theorem 4.2 Let C be known and assume that M < N , K < N (if Q ∝ I the latter condition is not needed); and that ωm = ωl for m = l. The CRB for the Doppler parameters in the model (4.4) is then ˆ − ω)(ω ˆ − ω)T ] ≥ C E[(ω � � H −1/2 ω �−1 Cω = 2Re (Dω C PC−1/2 SN C−1/2 Dω ) � (ΓH Q−1 Γ) . 66
(4.5)
4.2. ASYMPTOTIC CRB FOR THE 1-D MODELS
4.2
Asymptotic CRB for the 1-D Models
We now prove that, under some circumstances, the 2-D CRB can be attained using the decoupled 1-D/1-D models.
1-D DOA CRB, K → ∞ In the spatial 1-D model, the signal matrix X is composed of free parameters that need to be estimated along with the DOA . Since X is M × N , this matrix can only be consistently estimated as K → ∞. Thus, this model is suitable for the case of large number of antennas: Theorem 4.3 Let the assumptions of Theorem 3.3 hold, and assume that the DOAs are distinct. Then, for K → ∞, the decoupled DOA CRB (4.2) is identical to the asymptotic (K → ∞) 2-D CRB given by (3.21). ⊥ Proof: Follows from the fact that the matrix DH θ PA Dθ , appearing in (4.2) ⊥ (with Q = I), is asymptotically diagonal with elements dH θ Pa dθ .
1-D Doppler CRB, N → ∞ By the same arguments as above, the decoupled Doppler model (4.4) is suitable for the case of large number of temporal samples. Theorem 4.4 Let the assumptions of Theorem 3.4 hold, and assume that the ωm s are distinct. Then, for N → ∞, the decoupled Doppler CRB (4.5) is identical to the asymptotic (N → ∞) 2-D CRB given by (3.24). The interesting conclusion from the above results is that 2-D optimal performance using the decoupled signal model might be possible, but the estimates must be obtained in the right order! More precisely, for large K ˆ and an unstructured estimate of X first. We shall one must determine θ ˆ is also possible, by fitting the see later that 2-D optimal estimation of ω ˆ Similarly, when temporal model X = BS(ω) to the preliminary estimate X. N is large it is necessary to instead estimate ω in the first step. Optimal DOA estimates can then be obtained by fitting the spatial signal model to the unstructured estimate of Γ. We have seen that the single-source asymptotic 1-D and 2-D CRBs and the multi-source asymptotic 1-D and 2-D CRBs are all identical. Thus, there are two types of decoupling. As the amount of data tends to infinity in one of the frequency dimensions, both the sources and the frequency dimensions decouple. 67
CHAPTER 4. ESTIMATION USING A DECOUPLED 1-D/1-D MODEL
4.3
1-D/1-D Weighted Least Squares
Having concluded that it is possible to obtain asymptotically 2-D optimal estimates using the decoupled signal model, we now search for means to achieve this performance. The derivation is performed for the Doppler model (4.4), repeated below for convenience. The corresponding method based on (4.1) is then directly obtained by symmetry. Now, consider the decoupled temporal signal model y(n) = Γs(ω, n) + n(n) ,
(4.6)
where n(n) is assumed to be temporally white. The parsimonious parameterization of Γ would be Γ = A(θ)B =
M �
a(θm )bm .
(4.7)
m=1
In the 1-D/1-D approach, ω and Γ are first estimated ignoring the structure of Γ. Then, the DOA parameters are found by imposing (4.7) to the ˆ in a second step. Since the mapping from the papreliminary estimate Γ rameters of the unstructured Γ (e.g. the real and imaginary parts of the matrix elements) to θ and b is many-to-one, the resulting estimates of θ and b are suboptimal. However, by employing the extended invariance principle (EXIP) of [SS89], we retain the asymptotic (for large N ) efficiency. If n(n) is temporally and spatially white, the exact ML estimate of Γ and ω can be found by a nonlinear LS fit. Though the exact ML method also is tractable in the spatially colored noise case, here we will consider the asymptotically equivalent WLS approach. Thus, the unstructured spatial data matrix and the Doppler frequencies are found by solving � � ˆ = arg min Tr [Y − ΓS(ω)]H WQ [Y − ΓS(ω)] , (4.8) {ˆ ω , Γ} ω,Γ
where WQ is the spatial weighting matrix. If Q = E[n(n)nH (n)] is known, (4.8) yields the exact ML estimates when WQ = Q−1 is employed. For the case of unknown noise color, we propose a two-step approach below similar to that of Section 3.5. Absorbing the weighting matrix into Y and Γ, (4.8) is conveniently rewritten as ˆ W } = arg min �YW − ΓW S(ω)�2F {ˆ ω, Γ ω,Γ
1/2
YW = WQ Y 1/2
ΓW = WQ Γ . 68
(4.9) (4.10) (4.11)
4.3. 1-D/1-D WEIGHTED LEAST SQUARES
For fixed ω, the WLS estimate of Γ is now found as � ˆ W = YSH (ω) S(ω)SH (ω) −1 . ˆ = W−1/2 Γ Γ Q
(4.12)
Substituting (4.12) into (4.9), the Doppler frequencies are determined by solving �2 � � �2 � � 1/2 � ˆ W S� ω ˆ = arg min �YW − Γ � = arg min �WQ YP⊥ SH � , ω
ω
F
(4.13)
F
� H �−1 H where P⊥ SS = I − S S. Although (4.13) is again a complicated H S nonlinear optimization, the dimension has been reduced from 2M parameters in (3.55) to M in (4.13). It remains to determine the θ and b parameters. According to the EXIP principle, these are again determined by WLS, with the weighting given by the FIM for the problem at hand. Similar to [SS98], where only the case of M = 1 was considered, the unstructured model is re-written as vec (YW ) = (ST ⊗ I)γ + vec(N) ,
(4.14)
where γ = vec(Γ). We will consider this as a plain linear regression in γ, ignoring the fact that the parameters ω of S are also unknown. This ˆ (variance proportional to 1/N 3 ) as is justified by the high accuracy of ω ˆ (variance proportional to 1/N ). Applying [Kay93, compared to that of Γ Section 15.7], we derive the FIM for estimation of γ as �T � F(γ) = SSH ⊗ Q−1 � N I ⊗ Q−1 ,
(4.15)
where the approximation is valid for large N . The EXIP principle now dictates � � � �� � ˆ b} ˆ = arg min vecH Γ ˆ − A(θ)B . (4.16) ˆ − A(θ)B I ⊗ Q−1 vec Γ {θ, θ,b
By the properties of the Kronecker product, this can be re-written as � � ˆ = arg min Tr [Γ ˆ b} ˆ − A(θ)B]H WQ [Γ ˆ − A(θ)B] , {θ, (4.17) θ,b
with WQ = Q−1 . Using that B is diagonal results in ˆ b} ˆ = arg min {θ, θ,b
M �
ˆ m − a(θm )bm ]H WQ [Γ ˆ m − a(θm )bm ] , [Γ
m=1
69
(4.18)
CHAPTER 4. ESTIMATION USING A DECOUPLED 1-D/1-D MODEL
ˆ m is the m-th column of Γ. ˆ Thus, the estimation of the M DOA pawhere Γ rameters separates into M 1-D problems. Concentrating (4.18) with respect to bm yields H ˆ ˆbm = a (θm )WQ Γm aH (θm )WQ a(θm )
(4.19)
and, after straightforward manipulations, ˆ m |2 |aH (θ)WQ Γ , m = 1, . . . , M. θˆm = arg max H θ a (θ)WQ a(θ)
(4.20)
Hence, the m-th DOA is estimated by weighted beamforming, applied to the ˆ Note that the 2-D problem has decoupled not only into m-th column of Γ. two 1-D problems, but also that the M -D DOA search has decoupled into M 1-D searches. This is a tremendous reduction in computational complexity. In the case of spatially white noise, or, equivalently, known Q, the estimator is now completely specified. In the case of unknown Q, the following 2-step approach is proposed: 1. Solve (4.13) using column-weighting (3.47). ˆ from (4.12), and update the 2. Given preliminary ω estimates, compute Γ spatial weighting by �−1 � 1 H ˆ ω ))(Y − ΓS(ˆ ˆ ω )) (Y − ΓS(ˆ . (4.21) WQ = N 3. Solve (4.13) again, using the asymptotically optimal weighting. 4. Compute (4.12) and (4.21) again, and solve (4.20) for the DOA parameters. Given the significantly reduced complexity as compared to the full 2-D approach, the following result is remarkable. ˆ be determined by the above outlined 1-D/1-D ˆ and θ Theorem 4.5 Let ω estimator. Assume that the ωm s are distinct and that the temporal sampling is uniform, i.e. T � jω t e 1 . . . ejωM t , t = 1, . . . , N. s(ω, t) = Assume further that the noise is temporally white and spatially colored with covariance matrix Q. Assume that the array manifold is unambiguous and ˆ are both consistent ˆ and θ has bounded derivatives up to third order. Then, ω and asymptotically 2-D efficient as N → ∞. 70
4.3. 1-D/1-D WEIGHTED LEAST SQUARES
Proof: Follows essentially from the EXIP principle [SS89], but it must be proved that the estimation of ω does not affect the FIM for γ. We will not use the EXIP principle here to prove the theorem. Instead, we will use standard Taylor expansion techniques to derive the asymptotic properties of the proposed estimator. Since the proof is lengthy, the details are deferred to Appendix 4A. The 1-D Doppler estimator Consistency To show consistency of the Doppler estimator in (4.13) express the criterion function as �2 � � � ⊥ H � (4.22) J(ω) � �W1/2 YP⊥ SH F = Tr YW PSH YW , where YW = W1/2 Y and the Q subscript on the weighting matrix has been dropped for brevity. Introduce a row-wise slicing of the weighted data matrix according to ˘W 1 y YW = ... (4.23) ˘W K y ˘ W k is the k-th row in YW . The criterion function where the 1 × N vector y can then be written as J(ω) =
K �
˘ W k P⊥ ˘H y SH yW k .
(4.24)
k=1
Now, each term in the sum in (4.24) is the criterion function for a single ˘ W k contains a sum of channel ML frequency estimator, since each vector y cisoids in temporally white noise. The asymptotic properties of this estimator has been studied in [RZ93], where it was shown that it is strongly consistent. Hence, the minimizing argument of each term in the sum in (4.24) tends to ω 0 w.p.1 as N → ∞. It then follows that the minimizing argument of the sum tends to ω 0 w.p.1 as N → ∞. This proves consistency of the Doppler estimator in (4.13). Given that we can estimate ω consistently it follows that � −1 ˆ = YSH (ˆ ω ) S(ˆ ω )SH (ˆ ω) Γ � −1 → YSH (ω 0 ) S(ω 0 )SH (ω 0 ) →Γ (4.25) ˆ = 1 (Y − ΓS(ˆ ˆ ω ))(Y − ΓS(ˆ ˆ ω ))H Q N 1 → (4.26) (Y − ΓS(ω 0 ))(Y − ΓS(ω 0 ))H → Q N 71
CHAPTER 4. ESTIMATION USING A DECOUPLED 1-D/1-D MODEL
w.p.1 as N → ∞. Hence, all unknown parameters in (4.6) are consistently estimated. Asymptotic efficiency Since we have a consistent estimate of Q available we can write ˜ with �W� ˜ = op (1), W = Q−1 + W
(4.27)
where op (gN ) denotes a random variable that converges to zero in probability at a rate faster than gN → 0, see [Ful96]. The WLS criterion function can then be written as � � H J(ω) = Tr P⊥ SH Y WY � � � ⊥ H −1 � ⊥ H ˜ = Tr PSH Y Q Y + Tr PSH Y WY . (4.28) A Taylor expansion of the gradient of the criterion function shows that the asymptotic distribution of the estimates is governed by the behavior of the ˜ = gradient and the Hessian as N → ∞, see [Lju99, Section 9.2]. Since �W� op (1), it is clear that the second term in (4.28) has a negligible (for large N ) gradient and Hessian as compared to the first term. Thus, replacing W with Q will not change the asymptotic distribution of the Doppler estimates. Therefore, we can study the asymptotic distribution of � � � � H −1 ⊥ H (4.29) J(ω) = Tr P⊥ SH Y Q Y = Tr YQ PSH YQ , where YQ = Q−1/2 Y. Since the noise in YQ is spatially white, (4.29) is also the criterion function for the ML estimator. Now, the model in (4.6) is a dual model of the standard DOA estimation model. To see this, take the transpose of (4.6) YT = ST (ω)ΓT + NT
(4.30)
and compare it with the standard DOA estimation model Y = A(θ)X + N.
(4.31)
Hence, by replacing frequencies with DOAs and temporal samples with spatial samples we obtain the standard DOA estimation model. Therefore, studying the performance of ML frequency estimation as N → ∞ is equivalent to the case of ML DOA estimation as K → ∞. The latter case has been studied in [Vib95] under the assumption of spatio-temporally white noise. It was shown that the ML DOA estimator is asymptotically efficient as K → ∞. 72
4.3. 1-D/1-D WEIGHTED LEAST SQUARES
Since the noise in YQ is white and the uniform temporal sampling satisfies the assumption in [Vib95], it follows that the Doppler estimator considered here is asymptotically 1-D efficient as N → ∞. It was shown in the previous chapter that the 1-D and 2-D Doppler CRBs are asymptotically equivalent as N → ∞. It then follows that the Doppler estimator also is asymptotically 2-D efficient. The 1-D DOA estimator Consistency Next, we prove consistency (in probability) for the DOA estimator in (4.20). The estimate of the k-th DOA can be expressed as � �2 � H ˆ � ω )� �ak WΓk (ˆ ω ) = arg max θˆk (ˆ θk aH Wak � �k 1/2 ˆH ˆ k (ˆ = arg max Tr PW1/2 ak W1/2 Γ ω )Γ (ˆ ω )W k θk � � H 1/2 ˆ 1/2 ˆ W (ˆ ω ) Γ (ˆ ω )W = arg min Tr P⊥ Γ k k W1/2 ak θk
= arg min V (θk , ω ˆ ), θk
(4.32)
where ak = a(θk ) 1/2 PW1/2 ak = W1/2 ak aH /(aH k W k Wak ) ⊥ PW1/2 ak = I − PW1/2 ak � � H 1/2 ˆ 1/2 ˆ V (θk , ω ˆ ) = Tr P⊥ W (ˆ ω ) Γ (ˆ ω )W . Γ k k W1/2 ak In Appendix 4A, eq. (4A.30) it is shown that √ ˆ k (ˆ Γ ω ) = b0k a0k + Op (1/ N ),
(4.33)
(4.34)
where a0k � a(θ0k ) and Op (gN ) denotes a random variable that converges to zero in probability at the same rate as gN → 0, see [Ful96]. This implies √ 2 H ˆH ˆ k (ˆ ω )Γ (ˆ ω ) = |b | a a + O (1/ N ). (4.35) Γ 0k 0k p 0k k The criterion function V (θk , ω ˆ ) converges in probability, uniformly in θk , to the limit function V (θk ), where 1/2 ⊥ V (θk ) = |b0k |2 aH PW1/2 ak W1/2 a0k 0k W
73
(4.36)
CHAPTER 4. ESTIMATION USING A DECOUPLED 1-D/1-D MODEL
as N → ∞. To show this, consider the difference � � � H � ⊥ 1/2 ˆ 1/2 ˆ ω )Γk (ˆ ω )W sup �Tr PW1/2 ak W Γk (ˆ θk � �� 1/2 H 1/2 � −Tr |b0k |2 P⊥ W a a W � 0k 0k W1/2 ak � � � � �� H � 1/2 ˆ 2 H 1/2 � ˆ = sup �Tr P⊥ W (ˆ ω ) Γ (ˆ ω ) − |b | a a Γ W � k 0k 0k 0k k W1/2 ak θk � � � � � 1/2 � � ˆ 2 H� ˆH Γ W (ˆ ω ) Γ (ˆ ω ) − |b | a a ≤ sup �W1/2 P⊥ � � k 0k 0k 1/2 0k � . (4.37) k W ak θk
F
F
ˆ k (ˆ ˆH Since �W1/2 P⊥ W1/2 � is bounded and Γ ω )Γ ω ) → |b0k |2 a0k aH k (ˆ 0k in W1/2 ak probability, the right hand side of (4.37) converges to zero in probability. Clearly, V (θk ) is minimized when ak = c a0k for some scalar c. This implies that θk = θ0k provided that the array manifold is unambiguous. It then follows that θˆk is a consistent estimate of θk (in probability). Asymptotic efficiency Next, we derive the asymptotic distribution of the 1-D DOA estimator in (4.20) and show that the variance of this distribution equals the asymptotic 2-D CRB. We compute the asymptotic distribution of the normalized DOA √ ˆ estimation error, N (θ − θ0 ), using standard Taylor expansion techniques, ˆω ˆ ) = 0, we have see e.g. [Lju99, Section 9.2]. Since V � (θ, √
√ √ 1 N V � (θ0 , ω ˆ ) + V �� (θ0 , ω ˆ ) N (θˆ − θ0 ) + V ��� (θ∗ , ω ˆ ) N (θˆ − θ0 )2 = 0 2 (4.38)
ˆ The k subscript has been dropped for brevity. for some θ∗ between θ0 and θ. In Appendix 4A it is shown that the derivatives in (4.38) are of the following orders √ ˆ ) = Op (1/ N ) (4.39) V � (θ0 , ω �� V (θ0 , ω ˆ ) = Op (1) (4.40) ��� V (θ∗ , ω ˆ ) = Op (1). (4.41) √ ˆ ) and V �� (θ0 , ω ˆ ) are bounded, (4.38) implies that Since N V � (θ0 , ω √ ˆ N (θ − θ0 ) must be bounded, i.e. √ θˆ − θ0 = Op (1/ N ), (4.42) which in turn means that the third term in (4.38) can be neglected in the asymptotic analysis. Next, we show that replacing ω ˆ with ω 0 does not change 74
4.3. 1-D/1-D WEIGHTED LEAST SQUARES
√
N (θˆ − θ0 ). In Appendix 4A it is shown that √ ˆ ) = V � (θ0 , ω 0 ) + op (1/ N ) (4.43) V � (θ0 , ω �� �� V (θ0 , ω ˆ ) = V (θ0 , ω 0 ) + op (1). (4.44)
the asymptotic distribution of
Inserting this into (4.38) yields √ √ N V � (θ0 , ω 0 ) + op (1) + [V �� (θ0 , ω 0 ) + op (1)] N (θˆ − θ0 ) = 0.
(4.45)
It is easily seen from this expression that the terms associated with replacing ω ˆ with ω 0 can be neglected in the asymptotic analysis. For large N we thus have √ √ � √ N V (θ , ω ) N V � (θ0 , ω 0 ) 0 0 + o + op (1), (4.46) N (θˆ − θ0 ) = − (1) = − p V �� (θ0 , ω 0 ) H where H = lim V �� (θ0 , ω 0 )
(4.47)
N →∞
√ � in probability. From (4A.40) in Appendix 4A it follows √ that N V (θ0k , ω 0 ) is asymptotically normal, and hence from (4.46) that N (θˆ − θ0 ) is asymptotically normal. The limiting distribution is thus given by √ N (θˆ − θ0 ) ∈ As N (0, Q/H 2 ), (4.48) where � Q = lim N E (V � (θ0 , ω 0 ))2 .
(4.49)
N →∞
In Appendix 4A it is shown that −1/2 ⊥ Q = H = 2|b0 |2 dH PQ−1/2 a0 Q−1/2 d0 0 Q
so that the variance of the limiting distribution of
√
(4.50)
N (θˆ − θ0 ) is given by
Q 1 = . H 2 2 −1/2 H 2|b0 | d0 Q P⊥ Q−1/2 d0 Q−1/2 a0
(4.51)
Except for the normalization factor 1/N , this expressions equals the asymptotic 2-D CRB given in Theorem 3.4, since sH N sN = N when the sampling is uniform. 75
CHAPTER 4. ESTIMATION USING A DECOUPLED 1-D/1-D MODEL
Strictly speaking, we have not shown that the limiting variance of the estimation error equals the CRB, only that the variance of the limiting distribution equals the CRB. This issue is more subtle and the interested reader is referred to [Ben93] and [Lju99, Appendix 9B] for a detailed discussion. � Perhaps the most unexpected result is that the DOA parameter estimates are also asymptotically efficient, although the spatial parameterization was relaxed in the first step. The reason is that the “Doppler filtering” involved ˆ effectively separates the contribution from each source, for large in forming Γ enough N , which results in efficiency of the simple beamformer (4.20). Although the results presented above are applicable for large N and exploiting the temporal dimension first, a similar method that starts by estimating θ is simply derived using symmetry. The resulting method will be asymptotically efficient for large K.
76
4.3. 1-D/1-D WEIGHTED LEAST SQUARES
4A
Asymptotic Analysis of the 1-D/1-D Estimator
In this appendix, the details required for the proof of Theorem 4.5 are given. ˆ ) and its derivatives Asymptotic expressions for the criterion function V (θk , ω w.r.t. θk are computed. The appendix is divided into two parts. In the first part, the asymptotic variance of the gradient, Q in (4.49), is computed. In the second part, the asymptotic Hessian, H in (4.47), is computed. In the asymptotic analysis we will need the following results, which are formulated as a Lemma. Lemma 4.1
N �
q −jωt
te
=
t=1 N � t=1
O(N q ) ω = 0 q+1 O(N ) ω = 0
(4A.1)
n(t)tq e−jωt = Op (N q+1/2 ) ∀ ω
(4A.2)
√ ω ˆ − ω 0 = Op (1/N N )
(4A.3)
where ω ˆ − ω 0 is the Doppler frequency estimation error of the estimator in (4.13). Proof To show (4A.1), we use the fact that for ω = 0 N �
e−jωt =
t=1
1 − e−jN ω . ejω − 1
(4A.4)
Repeated differentiation w.r.t. ω on both sides in this expression then shows (4A.1) for ω = 0. For ω = 0 we use the following formula on p. 175 in [RW90] N � t=1
tq =
N q+1 N q + + . . . = O(N q+1 ) q+1 2
(4A.5)
and (4A.1) follows. To show (4A.2), define SN =
N �
nk (t)tq e−jωt ,
t=1
77
(4A.6)
CHAPTER 4. ESTIMATION USING A DECOUPLED 1-D/1-D MODEL
where nk (t) is the k-th element in n(t), and compute the variance of SN (note that SN is zero mean) � N N N �� � ∗ ∗ q q −jω(t−u) E [SN SN ] = E nk (t)nk (u)t u e E [nk (t)n∗k (t)] t2q = = σ
t=1 u=1 N � 2 2q
t
t=1
= O(N 2q+1 )
(4A.7)
t=1
using that the noise is temporally white and (4A.1). Applying Chebyshev’s inequality (see e.g. [Ful96, Section 5.1]) then gives that SN = Op (N q+1/2 ), and (4A.2) follows. (4A.3) follows from Lemma 3.1 in [RZ93] and (4A.2). �
Calculation of Q Differentiating the criterion function in (4.33) w.r.t. θk gives ! ⊥ " ∂P 1/2 ∂V (θ , ω ˆ ) H k W ak ˆ k (ˆ ˆ k (ˆ ˆ) = = Tr W1/2 Γ ω )Γ ω )W1/2 . (4A.8) V � (θk , ω ∂θk ∂θk Differentiating the projection matrix (see e.g. [VO91]) yields ∂P⊥ W1/2 ak ∂θk
−1 H 1/2 = −P⊥ W1/2 dk (aH − (. . .)H , k Wak ) ak W W1/2 ak
(4A.9)
where the notation (. . .)H means that the same expression appears again with complex conjugate transpose. Substituting into (4A.8) gives � � H � H −1 H 1/2 ⊥ 1/2 ˆ ˆ ˆ ) = −2Re (ak Wak ) ak WΓk (ˆ ω )Γk (ˆ ω )W PW1/2 ak W dk . V (θk , ω (4A.10) #k = Γ ˆ k − Γk we Since Γk = b0k a0k we have P⊥ W1/2 Γk = 0. Defining Γ W1/2 a0k get 1/2 ⊥ 1/2 ⊥ # k )Γ ˆH ˆkΓ ˆH PW1/2 a0k = (Γk + Γ PW1/2 a0k Γ k W k W
# k (Γk + Γ # k )H W1/2 P⊥ 1/2 ˆ k W1/2 P⊥ 1/2 + Γ = Γk Γ W a0k W a0k H
#kΓ # W1/2 P⊥ 1/2 ˆ k W1/2 P⊥ 1/2 + Γ = Γk Γ k W a0k W a0k H
H
1/2 ⊥ # k |). ˆH = Γk Γ PW1/2 a0k + op (|Γ k W
78
(4A.11)
4.3. 1-D/1-D WEIGHTED LEAST SQUARES
Thus, � � H −1 H 1/2 ⊥ 1/2 ˆ V � (θ0k , ω ˆ ) = −2Re (aH Wa ) a WΓ (ˆ ω )W P W d Γ 0k k k 0k 0k 0k W1/2 a0k # k (ˆ ω )|) + op (|Γ � � 1/2 ⊥ 1/2 # ω )|) ˆH = −2Re b0k Γ (ˆ ω )W P W d 0k + op (|Γk (ˆ k W1/2 a0k � � 1/2 ⊥ # k (ˆ ˆ k (ˆ PW1/2 a0k W1/2 Γ ω ) + op (|Γ ω )|). = −2Re b0k dH 0k W (4A.12) ˆ k (ˆ Next, in order to find a simple asymptotic expression for Γ ω ), we analyze the asymptotic behavior of � −1 ˆ ω ) = YSH (ˆ ω ) S(ˆ ω )SH (ˆ ω) . Γ(ˆ
(4A.13)
ω )SH (ˆ ω ) is given by The (m, n)-th element smn in the matrix S(ˆ smn =
N �
! ej(ˆωm −ˆωn )t =
N
m=n
jN (ˆ ωm −ˆ ωn )
− e −j(ˆωm −ˆωn ) − 1 m = n. e −1
t=1
(4A.14)
ω ) into a sum of the diagonal part and the off-diagonal Decompose S(ˆ ω )SH (ˆ part according to ω ) = N I + RN (ˆ ω ), S(ˆ ω )SH (ˆ
(4A.15)
where
0
s ω ) = 21 RN (ˆ ... sM 1
s12 · · · s1M .. 0 . .. ... . ··· ··· 0
(4A.16)
so that −1 � 1 ω) = S(ˆ ω )SH (ˆ N
�−1 � 1 ω) . I + RN (ˆ N
(4A.17)
It easy to show that �
�−1
1 I + RN (ˆ ω) N
=I−
1 1 ω ) + 2 RN (ˆ ω )2 − . . . RN (ˆ N N 79
(4A.18)
CHAPTER 4. ESTIMATION USING A DECOUPLED 1-D/1-D MODEL
by the following multiplication �� � � 1 1 1 2 I − RN + 2 RN − . . . = I + RN N N N 1 1 1 1 I − RN + RN + 2 R2N − 2 R2N − . . . = I N N N N
(4A.19)
provided � N1 RN � is sufficiently small for the sum to converge. We thus have ˆ ω ) = 1 YSH (ˆ Γ(ˆ ω )[1 + Op (1/N )], N
(4A.20)
since �RN (ˆ ω )� is of order Op (1) because the Doppler frequencies are assumed to be distinct. Define g(ˆ ω k ) to be the k-th column of N1 YSH (ˆ ω ), i.e. N 1 � y(t)e−j ωˆ k t . g(ˆ ωk ) = N t=1
(4A.21)
ˆ k (ˆ ω ) = g(ˆ ω k ) [1 + Op (1/N )] . Γ
(4A.22)
It then follows that
Recalling that y(t) = A(θ 0 )B0 s(ω 0 , t) + n(t) =
M �
b0m a0m ejω0m t + n(t), (4A.23)
m=1
we obtain N 1 � g(ˆ ωk ) = N t=1
$
1 = b0k a0k N
M �
m=1 N � t=1
% b0m a0m ejω0m t + n(t) e−j ωˆ k t j(ω0k −ˆ ωk )t
e
M �
N 1 � j(ω0m −ˆωk )t + b0m a0m e + N t=1 m=1 m�=k
N 1 � n(t)e−j ωˆ k t = g1 + g2 + g3 . N t=1
(4A.24)
We have divided g(ˆ ω k ) into three parts: g1 which stems from the signal of interest, g2 which accounts for all other signals, and g3 which represents the contribution from the noise. The asymptotic behavior of these different terms is now analyzed using the Taylor expansion ωk − ω0k )te−jω0k t + . . . . e−j ωˆ k t = e−jω0k t − j(ˆ 80
(4A.25)
4.3. 1-D/1-D WEIGHTED LEAST SQUARES
From Lemma 4.1 it follows that each additional higher order term in& this exunder the t√sum. pansion contributes with an additional factor t(ˆ ω k − ω0k ) √ This will decrease the order of the sum by O(N ) Op (1/N N ) = Op (1/ N ). These higher order terms can therefore be neglected in the asymptotic analysis. Consequently, g1
N � � √ � N − j (ˆ ω −ω ) t + . . . = b0k a0k 1 + Op (1/ N ) * k�+, 0k� t=1 1 *+,√ Op
1 = b0k a0k N
N
N
O(N 2 )
(4A.26)
g2
M �
1 = b0m a0m N m=1 m�=k
� N � N j(ω −ω )t j(ω0m −ω0k )t 0m 0k e −j (ˆ ω k − ω0k ) te + . . . * �+, � t=1 t=1 1 * +, * +, √ Op N
O(1)
N
O(N )
= Op (1/N )
(4A.27)
g3
1 = N
� N � N −jω0k t −jω0k t n(t)e −j (ˆ ω − ω ) n(t)te + . . . k 0k * +, t=1 � � t=1 1 * +, * +,√ √ Op √ N
Op ( N )
=
1 N
N �
N
Op (N N )
n(t)e−jω0k t + Op (1/N ).
(4A.28)
t=1
Substituting these expression into (4A.24) yields � g(ˆ ω k ) = b0k a0k
N √ � 1 � 1 + Op (1/ N ) + n(t)e−jω0k t + Op (1/N ). N t=1
(4A.29)
These results are now used for computing asymptotic expressions for # k (ˆ ˆ k (ˆ W1/2 Γ ω ) and Γ ω ) which are needed for computing an asympP⊥ W1/2 a0k 81
CHAPTER 4. ESTIMATION USING A DECOUPLED 1-D/1-D MODEL
totic expression for V � (θ0k , ω ˆ ). Combining (4A.22) and (4A.29) we obtain � N � √ � 1 � ˆ k (ˆ ω ) = b0k a0k 1 + Op (1/ N ) + n(t)e−jω0k t + Op (1/N ) Γ N t=1 × [1 + Op (1/N )] N � √ � 1 � = b0k a0k 1 + Op (1/ N ) + n(t)e−jω0k t + Op (1/N ) N t=1 (4A.30) W1/2 a0k = 0, and, since P⊥ W1/2 a0k ˆ k (ˆ P⊥ W1/2 Γ ω ) = P⊥ W1/2 W1/2 a0k W1/2 a0k
N 1 � n(t)e−jω0k t + Op (1/N ). N t=1
(4A.31) # k (ˆ ω ) we obtain Using (4A.2), (4A.30) and the definition of Γ √ # k (ˆ ˆ k (ˆ ω) = Γ ω ) − b0k a0k = Op (1/ N ). Γ Substituting (4A.31) and (4A.32) into (4A.12) gives ! �
V (θ0k , ω ˆ ) = −2Re
1/2 ⊥ b0k dH PW1/2 a0k W1/2 0k W
√ + op (1/ N ).
(4A.32)
N 1 � n(t)e−jω0k t N t=1
"
(4A.33)
Now, since W = Q−1 + op (1) and we obtain
N √ 1 � n(t)e−jω0k t = Op (1/ N ) N t=1
(4A.34)
" N � 1 −1/2 ⊥ V � (θ0k , ω ˆ ) = −2Re b0k dH PQ−1/2 a0k Q−1/2 n(t)e−jω0k t 0k Q N t=1 √ + op (1/ N ). (4A.35) √ It can be seen from this expression that V � (θ0k , ω ˆ ) is of order Op (1/ N ) which proves (4.39). To show (4.43), we compare (4A.35) with � � 1/2 ⊥ 1/2 ˆ # k (ω 0 )|). W P W (ω ) + op (|Γ Γ V � (θ0k , ω 0 ) = −2Re b0k dH k 0 0k W1/2 a0k !
(4A.36) 82
4.3. 1-D/1-D WEIGHTED LEAST SQUARES
Using � ˆ 0 ) = YSH (ω 0 ) S(ω 0 )SH (ω 0 ) −1 Γ(ω
� −1 = [A(θ 0 )B0 S(ω 0 ) + E] SH (ω 0 ) S(ω 0 )SH (ω 0 ) � −1 = A(θ 0 )B0 + ESH (ω 0 ) S(ω 0 )SH (ω 0 ) 1 = A(θ 0 )B0 + ESH (ω 0 ) [1 + O(1/N )] , (4A.37) N
we have that N 1 � ˆ n(t)e−jω0k t [1 + O(1/N )] Γk (ω 0 ) = b0k a0k + N t=1 N √ 1 � = b0k a0k + n(t)e−jω0k t + Op (1/N N ), N t=1
(4A.38)
and # k (ω 0 ) = Γ ˆ k (ω 0 ) − Γk Γ N 1 � = b0k a0k + n(t)e−jω0k t [1 + O(1/N )] − b0k a0k N t=1 √ = Op (1/ N ). (4A.39) Substituting (4A.38) and (4A.39) into (4A.36) gives ! �
V (θ0k , ω 0 ) = −2Re
1/2 ⊥ b0k dH PW1/2 a0k W1/2 0k W
√ + op (1/ N ) !
N 1 � n(t)e−jω0k t N t=1
"
" N � 1 −1/2 ⊥ PQ−1/2 a0k Q−1/2 n(t)e−jω0k t = −2Re b0k dH 0k Q N t=1 √ + op (1/ N ). (4A.40) Comparing (4A.35) and (4A.40) we see that √ V � (θ0k , ω ˆ ) = V � (θ0k , ω 0 ) + op (1/ N ),
(4A.41)
which proves (4.43). We are now ready to compute √ the final expression √ for Q. Since the first term in (4A.40) is of order Op (1/ N ), the op (1/ N ) term can be ignored 83
CHAPTER 4. ESTIMATION USING A DECOUPLED 1-D/1-D MODEL
when computing Q. Thus, for sufficiently large N we have � N E (V � (θ0k , ω 0 ))2 = � N � � � 4 H −1/2 ⊥ −1/2 −jω0k t = PQ−1/2 a0k Q n(t)e E Re b0k d0k Q N t=1 N � � � H −1/2 ⊥ −1/2 −jω0k u × Re b0k d0k Q PQ−1/2 a0k Q n(u)e u=1
�
N � � 2 2 H −1/2 ⊥ −1/2 = E Re |b0k | d0k Q PQ−1/2 a0k Q n(t)e−jω0k t N t=1 N �
×
nH (u)ejω0k u Q−1/2 P⊥ Q−1/2 d0k Q−1/2 a0k
�
u=1
� N � � 2 2 H −1/2 ⊥ −1/2 + PQ−1/2 a0k Q n(t)e−jω0k t E Re b0k d0k Q N t=1 N �
×
−T /2 ∗ nT (u)e−jω0k u Q−T /2 P⊥T d0k Q−1/2 a0k Q
�
.
(4A.42)
u=1
Since, N N � �
E[n(t)nH (u)]ejω0k (u−t) =
t=1 u=1
N �
E[n(t)nH (t)] = N Q
(4A.43)
t=1
T
and E[n(t)n (u)] = 0, we obtain the final expression for Q according to −1/2 ⊥ Q = lim N E [(V � (θ0k , ω 0 ))2 ] = 2|b0k |2 dH PQ−1/2 a0k Q−1/2 d0k . 0k Q N →∞
(4A.44) This proves Q in (4.50).
Calculation of H Differentiating the criterion function in (4.33) w.r.t. θk twice gives ! 2 ⊥ " P ∂ 1/2 a H W k ˆ k (ˆ ˆ k (ˆ V �� (θk , ω ˆ ) = Tr W1/2 Γ ω )Γ ω )W1/2 . (4A.45) ∂θk2 From (4A.30) and (4A.38) we have that ˆ k (ˆ ω ) = b0k a0k + op (1) Γ ˆ Γk (ω 0 ) = b0k a0k + op (1) 84
(4A.46) (4A.47)
4.3. 1-D/1-D WEIGHTED LEAST SQUARES
so that ˆ k (ω 0 ) + op (1) ˆ k (ˆ ω) = Γ Γ
(4A.48)
ˆH ˆ k (ω 0 )Γ ˆH ˆ k (ˆ ω )Γ ω) = Γ Γ k (ˆ k (ω 0 ) + op (1)
(4A.49)
and
which shows that V �� (θk , ω ˆ ) = V �� (θk , ω 0 ) + op (1)
(4A.50)
and (4.44) follows. Defining aW = W1/2 a0k and dW = W1/2 d0k we obtain from [VO91] � � ∂ 2 P⊥ W1/2 ak � † † †H H ⊥ † = P⊥ � aW dW aW dW aW + aW dW PaW dW aW 2 � ∂θk θk =θ0k ⊥ 2 −PaW dW a†W − H
† † H −1 H ⊥ ⊥ P⊥ aW dW (aW aW ) dW PaW + PaW dW aW dW aW
+(. . .) ,
(4A.51)
−1 H where a†W = (aH W aW ) aW and
d2W
=W
1/2
� ∂ 2 a(θk ) �� . ∂θk2 �θk =θ0k
(4A.52)
If the derivatives up to second order of the array manifold are bounded, ˆ k (ω 0 )Γ ˆH we conclude that V �� (θ0k , ω 0 ) is bounded since Γ k (ω 0 ) is bounded. Similarly, we conclude that � " ! 3 ⊥ � P ∂ 1/2 a � H W k ˆ k (ω 0 )W1/2 (4A.53) ˆ k (ω 0 )Γ W1/2 Γ V ��� (θ∗k , ω 0 ) = Tr � � ∂θk3 θk =θ∗k
for some θ∗k between θ0k and θˆk , is bounded if the derivatives up to third order of the array manifold are bounded. We have thus shown (4.40) and (4.41). From (4A.38) we have ˆ k (ω 0 ) = b0k a0k lim Γ
(4A.54)
2 H ˆ k (ω 0 )Γ ˆH lim Γ k (ω 0 ) = |b0k | a0k a0k
(4A.55)
N →∞
in probability. Hence, N →∞
85
CHAPTER 4. ESTIMATION USING A DECOUPLED 1-D/1-D MODEL
in probability. Defining aQ = Q−1/2 a0k and dQ = Q−1/2 d0k the terms in H = limN →∞ V �� (θ0k , ω 0 ) are given by � � H † † ⊥ 1/2 ˆ 1/2 ˆ lim Tr PaW dW aW dW aW W Γk (ω 0 )Γk (ω 0 )W = N →∞ � � † † H H ⊥ = Tr |b0k |2 P⊥ = |b0k |2 aH Q PaQ dQ aQ dQ aQ = 0 aQ dQ aQ dQ aQ � � H † H ⊥ 1/2 ˆ 1/2 ˆ = lim Tr a†H d P d a W (ω ) Γ (ω )W Γ k 0 0 k W W aW W W N →∞ � � H ⊥ H ⊥ = Tr |b0k |2 a†H = |b0k |2 dH Q PaQ dQ Q dQ PaQ dQ aQ � � H † 2 1/2 ˆ 1/2 ˆ lim Tr P⊥ d a W (ω ) Γ (ω )W = Γ k 0 0 k aW W W N →∞ � � 2 2 H ⊥ = Tr |b0k |2 P⊥ = |b0k |2 aH d a Q PaQ dQ = 0 aQ Q Q � lim Tr
N →∞
H −1 H ⊥ 1/2 ˆ 1/2 ˆH Γk (ω 0 )Γ P⊥ k (ω 0 )W aW dW (aW aW ) dW PaW W
� � H −1 H ⊥ H = Tr |b0k |2 P⊥ =0 d (a a ) d P a a aQ Q Q Q Q aQ Q Q
� =
� � H † † 1/2 ˆ 1/2 ˆ lim Tr P⊥ = d a d a W (ω ) Γ (ω )W Γ W W k 0 0 aW k W W N →∞ � � † † H ⊥ = Tr |b0k |2 P⊥ = |b0k |2 aH Q PaQ dQ aQ dQ = 0 aQ dQ aQ dQ aQ so that H =
⊥ lim V �� (θ0k , ω 0 ) = 2|b0k |2 dH Q PaQ dQ
N →∞
−1/2 ⊥ = 2|b0k |2 dH PQ−1/2 a0k Q−1/2 d0k 0k Q
(4A.56) �
which proves H in (4.50).
86
Chapter
5
Computing the Estimates The methods presented herein are all implicit in nature. The parameter estimates are defined as the minimizing arguments of some nonlinear criterion function. In practice, finding the minimum is far from trivial, especially when the number of parameters is large. The presented objective functions are all of the nonlinear least squares type. We will in the following suggest a computationally attractive and reasonably reliable procedure to solve such problems. The technique is based on local numerical optimization (e.g. Gauss-Newton [DS83]), initialized using the so-called RELAX procedure [LZS93]. In addition to solving the optimization problem, the number of targets, M , must also be determined in any practical situation. Methods for estimating M are proposed in, e.g., [Shu83, B¨oh95, CH96, Eri01, Eri02], and will not be further explored here.
5.1
Local Optimization
The 2-D ML criterion in (3.40) can be efficiently implemented by first performing a QR decomposition of Υ according to � � R1 � , (5.1) Υ = Q1 Q2 0 and then computing the ML criterion function as � � ��2 � . V2D = �yN − Q1 QH 1 yN F
(5.2)
Since only Q1 is needed for computing the criterion function an “economy size” QR decomposition can be used. This least squares criterion can then be minimized using some numerical optimization method, e.g. Gauss-Newton. 87
CHAPTER 5. COMPUTING THE ESTIMATES
Similarly, the 1-D Doppler problem in (4.13) can be implemented by first performing a QR decomposition of SH according to � � R1 � H , (5.3) S = Q1 Q2 0 and then minimizing the least squares criterion �2 � � VDoppler = �Y − (YQ1 ) QH 1 F.
(5.4)
The subsequent DOA estimator is then implemented by minimizing � �2 �ˆ � Hˆ H VDOA = �Γm − a Γm a/(a a)� , m = 1, . . . , M.
(5.5)
F
For each m, this is done by a coarse grid search (FFT in the case of a ULA) followed by a local optimization. The computational complexity of the above nonlinear LS problems can be further reduced by explicitly exploiting the structure of separable least squares, see e.g. [GP73, Kau75, RW80].
5.2
Computing Initial Estimates
We will use the RELAX method to find initial estimates for the WLS estimator. RELAX is closely related to the Alternating Projection (AP) algorithm [ZW88]. The difference is that RELAX updates the parameters of only one target at the time, whereas AP updates the nonlinear (e.g. Doppler) parameter of one target and the linear (“amplitude”) parameters of all targets at the same time. We will only give the details for the 1-D problem (4.9). The extension to the 2-D case is obvious, but involves sequentially searching over two parameters (DOA and Doppler) for each target. To stress the dependence on the target parameters, (4.9) is expressed as V (ΓW , ω) = �YW
� �2 M � � � � � 2 − ΓW S(ω)�F = �YW − Γm s(ωm )� . � � m=1
(5.6)
F
The RELAX idea is now simply to minimize (5.6) sequentially with respect to one signal at the time, while keeping the parameters of the other signals fixed. For the l-th signal we thus solve ˆl, ω ˆ l } = arg min �Yl − Γl s(ωl )�2F , {Γ Γl ,ωl
88
(5.7)
5.2. COMPUTING INITIAL ESTIMATES
where Yl = YW −
�
ˆ m s(ˆ ωm ) Γ
(5.8)
m�=l
ˆ m, ω and Γ ˆ m , m = l, are the current estimates of the other targets’ signal parameters. Solving (5.7) explicitly with respect to Γl results in an optimization of the single parameter ωl only: ω ˆ l = arg max �Yl sH (ωl )�2 ωl
ˆ l = Yl sH (ˆ Γ ωl )/N .
(5.9) (5.10)
Noting that the vector Yl sH (ˆ ωl ) is composed of the DFT of the rows of Yl , H 2 the peak of �Yl s (ωl )� can efficiently be localized using FFT (with zero padding), followed by a local optimization. The whole procedure is initialized ˜ = 1 and solving for Γ ˆ 1 and by assuming that the number of targets is M ˜ = 2, and the ω ˆ 1 . Next, the number of anticipated targets is increased to M ˆ 2, ω ˆ 1, ω ˆ 1 and Γ ˆ 2 iteratively until convergence. RELAX search computes Γ ˜ ˜ = M is Next, M = 3 and so on, until the correct number of targets M reached. It is clear that such an approach fits very well with a sequential detection test for determining the number of targets, see e.g. [Eri02]. The full RELAX procedure is summarized as follows: ˜ = 1 and Y1 = YW . 1. Initialize by M ˆ ˜ from (5.9)–(5.10). 2. Compute ω ˆ M˜ and Γ M ˜ , execute Step 4: ˜ � = 2, 3, . . . , M 3. For M ˜ � , compute 4. For l = 1, 2, . . . , M ˜ M � �
Yl = YW −
ˆ m s(ˆ ωm ) Γ
m=1,m�=l
ωˆl = arg max �Yl sH (ωl )�2 ωl
ˆ l = Yl s (ˆ ωl )/N . Γ H
Repeat this step until convergence. ˜ < M ; let M ˜ =M ˜ + 1, compute Y ˜ according to (5.8) and goto 5. If M M 2. 89
CHAPTER 5. COMPUTING THE ESTIMATES
The above scheme only involves local optimization over a single parameter. The convergence is usually substantially faster by replacing Steps 3-4 by a Newton-type search over the full parameter vector [ω1 , . . . , ωM˜ ]T . However, the probability of finding the global optimum can sometimes be increased by doing at least one iteration of Steps 3-4 before switching to a local optimization.
90
Chapter
6
Numerical Examples and Simulations In this chapter we present some numerical examples and results of Monte Carlo simulations. The purpose is twofold. On the one hand we want to corroborate the theoretical analysis presented in the preceding sections. On the other hand the theoretical analysis says nothing about how large N or K have to be in order to achieve the asymptotic regime. We will present some representative examples that will provide insight into this issue.
6.1
Cram´ er-Rao Bounds
First we will study how the 2-D and 1-D CRBs compare to the asymptotic bound as the number of samples increases. We will only consider the case of increasing number of pulses since the dual case of increasing number of antennas is obtained by replacing the roles of DOA and Doppler. In the first example we study a scenario with two sources in spatiotemporally white Gaussian noise with variance σ 2 = 1. The source parameters are θ1 = 20◦ , θ2 = 23◦ , ω1 = 0.40, ω2 = 0.55, b1 = b2 = 0.3 + j0.5. The array employed is a 16 element ULA with λ/2 element separation. The null-to-null beamwidth of this array is ∆θ ≈ 14◦ and the Rayleigh resolution limit is thus 7◦ . Figure 6.1 shows the different CRBs on the DOA root mean square errors (RMSEs) as a function of the number of pulses N . The 1-D MLE cannot reach the 1-D CRB as N → ∞ since the number of parameters grows with N . Therefore, we also plot the asymptotic variance of the MLE as given in [SN90a]. We observe that the 2-D CRB given by (3.11) coincides with the asymptotic or, equivalently, the single-source CRB given by (3.21) when N is sufficiently large. The number of required pulses to resolve the sources in Doppler according to the Rayleigh resolution limit is 91
CHAPTER 6. NUMERICAL EXAMPLES AND SIMULATIONS
2π/(ω2 − ω1 ) ≈ 42. We observe from the plot that this is roughly the point where the 2-D CRB enters the asymptotic region and achieves the singlesource bound. The 1-D CRB given by (4.2), however, does not attain the single-source bound no matter how large N is. The source DOA separation is much less than the spatial Rayleigh resolution limit and increasing N does not improve the spatial resolution. In this case the achievable performance when employing the 2-D model is much better than with a single 1-D model.
DOA CRB
RMSE [deg]
Single target CRB 2D CRB 1D CRB As. 1D ML Var.
0
10
−1
10
0
10
20
30
40 50 No. of pulses
60
70
80
Figure 6.1: DOA CRBs as a function of the number of pulses, two sources and a 16 element ULA. The model parameters are σ 2 = 1, θ1 = 20◦ , θ2 = 23◦ , ω1 = 0.40, ω2 = 0.55, b1 = b2 = 0.3 + j0.5.
As we have previously seen, estimating with a two-step 1-D/1-D model can achieve the same asymptotic performance as with the full 2-D model, but only if the estimates are obtained in the right order. Since N is increasing in the present case, the Doppler parameters must be estimated first. The Doppler CRBs are plotted in Figure 6.2. In this case also the 1-D CRB reaches the single-source bound since the Doppler resolution is improved when increasing N . The corresponding MLE will reach the CRB as N → ∞ since the number of parameters does not grow with N in the 1-D Doppler model. 92
6.2. PERFORMANCE OF THE WLS ESTIMATORS
Doppler CRB Single target CRB 2D CRB 1D CRB −1
RMSE [rad/s]
10
−2
10
−3
10
0
10
20
30
40 50 No. of pulses
60
70
80
Figure 6.2: Doppler CRBs as a function of the number of pulses, two sources and a 16 element ULA. The model parameters are σ 2 = 1, θ1 = 20◦ , θ2 = 23◦ , ω1 = 0.40, ω2 = 0.55, b1 = b2 = 0.3 + j0.5.
6.2
Performance of the WLS Estimators
We now turn our attention to the actual performance of the 2-D and 1-D/1-D WLS estimators described previously. Since the finite sample performance is not available in analytical form we have to resort to Monte Carlo simulations. We will study an example where we employ a ULA with 8 antenna elements spaced one-half wavelength apart. The null-to-null beamwidth of this array is 29◦ and the Rayleigh resolution limit is thus 14.5◦ . There are two sources present with parameters θ1 = 18◦ , θ2 = 24◦ , ω1 = 0.20, ω2 = 0.10, b1 = b2 = 2. The 2-D and 1-D/1-D WLS estimators were implemented and their RMSEs as a function of the number of pulses N were computed by means of Monte Carlo simulations. In order to avoid the effect of getting caught in a local maximum in search for the global maximum, we first initialized the search with the true source parameters. In practice, these are of course not known and some other initialization must be used. In order to compare with a more practical method we also implemented the RELAX procedure for the 1-D/1-D WLS estimator described in Section 5.2. The 2-D WLS estimator was then initialized with the estimates obtained from the 1-D/1-D WLS estimator. The local optimization was performed using a Gauss-Newton search. First we consider the case of spatio-temporally white noise and then study the case of spatially colored and temporally white noise. In the latter case, 93
CHAPTER 6. NUMERICAL EXAMPLES AND SIMULATIONS
the spatial color is produced by a directional interference (jammer).
White Noise The results for spatio-temporally white Gaussian noise with variance σ 2 = 1 are depicted in Figures 6.3 and 6.4. Figure 6.3 shows the DOA estimation performance of the WLS estimators versus the number of pulses N . The pertinent CRBs are also shown in the plot. The 2-D WLS initialized with true parameter values provides excellent estimates; the RMSE is close the 2-D CRB for all N . The 1-D/1-D WLS estimator is equally good for large N but less accurate when N is small. We can observe a threshold below which the RELAX method failed to produce initial values within the region of attraction of the global optimum. For large N , however, the resulting estimation performance is the same as when initializing with the true parameter values. Indeed, all the estimators reach the single-source CRB when N is sufficiently large. It is interesting to note that this occurs when N ≈ 60 which corresponds to the Doppler Rayleigh resolution limit being equal to the source Doppler separation. Figure 6.4 shows the results for the Doppler DOA RMSE Single target CRB 2D CRB 1D/1D WLS, true init. 2D WLS, true init. 1D/1D WLS, RELAX init. 2D WLS, RELAX init.
1
RMSE [deg]
10
0
10
−1
10
0
50
100
150
No. of pulses
Figure 6.3: DOA estimation performance and CRBs versus the number of pulses, two sources, 8 element ULA, white noise. The source parameters are θ1 = 18◦ , θ2 = 24◦ , ω1 = 0.20, ω2 = 0.10, b1 = b2 = 2. estimates. The relative performances between the estimators are the same as for the DOA estimates. 94
6.2. PERFORMANCE OF THE WLS ESTIMATORS
Doppler RMSE
1
10
Single target CRB 2D CRB 1D/1D WLS, true init. 2D WLS, true init. 1D/1D WLS, RELAX init. 2D WLS, RELAX init.
0
RMSE [rad/s]
10
−1
10
−2
10
−3
10
−4
10
0
50
100
150
No. of pulses
Figure 6.4: Doppler estimation performance and CRBs versus the number of pulses, two sources, 8 element ULA, white noise. The source parameters are θ1 = 18◦ , θ2 = 24◦ , ω1 = 0.20, ω2 = 0.10, b1 = b2 = 2.
Spatially Colored Noise Next we consider the case of spatially colored and temporally white noise. We use the same scenario as in the white noise case with the exception of the presence of a directional interference with a DOA of θj = 35◦ . The interference signal is zero mean, temporally white Gaussian noise with variance σj2 = 100. The spatial noise covariance is thus Q = σj2 a(θj )a(θj )H + I. The 2-D and 1-D/1-D WLS estimators were implemented using the 2-step approaches described in Subsections 3.5 and 4.3 respectively. Also in this case we considered the two cases of initialization with the true parameter values and the RELAX procedure. The DOA and Doppler estimation performance along with the CRBs are plotted versus the number of pulses, N , in Figures 6.5 and 6.6 respectively. The performance of the WLS estimators, relative to the CRBs, is somewhat worse for small N compared to the white noise case; whereas for large N the difference is negligible. This is expected since for small N the estimate of the noise covariance is poor. For large N the noise covariance is as good as known and the problem reduces to the white noise case by pre-whitening.
95
CHAPTER 6. NUMERICAL EXAMPLES AND SIMULATIONS
DOA RMSE Single target CRB 2D CRB 1D/1D WLS, true init. 2D WLS, true init. 1D/1D WLS, RELAX init. 2D WLS, RELAX init.
1
RMSE [deg]
10
0
10
−1
10
0
50
100
150
No. of pulses
Figure 6.5: DOA estimation performance and CRBs versus the number of pulses, two sources, 8 element ULA. The source parameters are θ1 = 18◦ , θ2 = 24◦ , ω1 = 0.20, ω2 = 0.10, b1 = b2 = 2. White noise plus a jammer at θj = 35◦ with power σj2 = 100. Doppler RMSE
1
10
Single target CRB 2D CRB 1D/1D WLS, true init. 2D WLS, true init. 1D/1D WLS, RELAX init. 2D WLS, RELAX init.
0
RMSE [rad/s]
10
−1
10
−2
10
−3
10
−4
10
0
50
100
150
No. of pulses
Figure 6.6: Doppler estimation performance and CRBs versus the number of pulses, two sources, 8 element ULA. The source parameters are θ1 = 18◦ , θ2 = 24◦ , ω1 = 0.20, ω2 = 0.10, b1 = b2 = 2. White noise plus a jammer at θj = 35◦ with power σj2 = 100. 96
Chapter
7
Conclusions In the first part of the thesis we have studied the problem of DOA and Doppler estimation with a pulsed Doppler radar system employing an array of antennas. This is an application of 2-D frequency estimation with DOA and Doppler corresponding to spatial and temporal frequencies, respectively. The focus has been on comparing the performance of joint and decoupled MLEs and the corresponding CRBs. We have shown that the joint DOA/Doppler problem decouples if the number of pulses or antenna elements is sufficiently large. Not only do the frequency dimensions decouple, but also the different sources. Thus, single-source performance is achievable in multi-source scenarios, if the amount of data is sufficiently large in at least one of the frequency dimensions. In order to achieve this, the estimation must performed in the right order. The frequency dimension in which the amount of data is large must be processed first. In this dimension, the sources are resolvable and, subsequently, the estimation in the other frequency dimension can be performed for one source at a time. The result is a tremendous reduction in computational complexity as compared to the full 2-D frequency estimation problem. Yet, under the stated assumptions the performance loss is insignificant. Numerical examples and results of Monte Carlo simulations indicated that the mentioned decouplings are valid when the sources are resolvable in one dimension according to the Rayleigh resolution limit.
97
CHAPTER 7. CONCLUSIONS
98
Part II Performance Analysis of DOA Estimation in the Threshold Region
99
CHAPTER 7. CONCLUSIONS
100
Chapter
8
Introduction The first part of this thesis deals with asymptotic analysis of DOA and Doppler estimation with sensor arrays. The tools used in this analysis are CRBs and Taylor expansions. With these tools we are able to show that the ML estimator attains the CRB if the amount of measured data is sufficiently large. In practical applications there are of course constraints on how many sensors one can afford and how long time there is available for collecting data. The cost of a sensor array processing system depends to a great extent on the number of sensors, both in terms of hardware and computational requirements. Therefore, it is desirable to keep the number of sensors to a minimum while maintaining the system requirements. Likewise, the data collection time is also a limited resource since a real-world environment is often non-stationary. For instance, in radar applications the different targets are moving, the interference environment is changing and the background clutter is spatially inhomogeneous. Therefore, one is often limited to short measuring times in order to obtain a stationary data set and to be able to track the changing environment. Another parameter that may violate the asymptotic assumptions is a low SNR. A radar system often operates at low SNR — typically small targets are to be detected in a heavy clutter background and severe interference scenario. A few words about asymptotics are in order. Due to averaging of the noise and, in many cases, coherent processing gain of the signals, a long measuring time results in a high integrated SNR. Therefore we can interchangeably speak of the asymptotic region as having high SNR or many data samples. In general, one may say that the asymptotic assumptions are usually valid whenever the estimation error is small. However, as we will see later when analyzing the deterministic and stochastic DOA estimators, this equivalence is 101
CHAPTER 8. INTRODUCTION
not always clear-cut. See [Asy98] for a further discussion about asymptotics. Although asymptotic analysis is useful in many aspects, it does not provide a full picture of the achievable estimation performance of a sensor array system. It is also important to obtain an understanding of the inherent limitations in an estimation problem under conditions of low SNR and/or small number of data samples. Indeed, it is well known that nonlinear estimators typically exhibit a so called threshold effect, i.e. there is a point where the estimator more or less breaks down and yields very large errors. The system design parameters that govern where the threshold regime sets in are often different from the ones that determine the performance in the asymptotic region. As will be shown in the sequel, the threshold in the DOA estimation problem is determined by the sidelobe level in the array beampattern, whereas the asymptotic accuracy depends only on the shape of the mainlobe. In fact, there is a trade-off between these two parameters. The more the sensors are spread out, the narrower is the mainlobe, but at the expense of high sidelobes. Therefore, designing such a system based only on asymptotic analysis would result in poor threshold performance. In this part of the thesis we will develop a model of the threshold region performance of the ML DOA estimator. Actually, the basic principles behind the approach adopted herein could be used to model the threshold behavior of any estimator that is the minimizer of some multimodal criterion function. We will treat the ML estimation problems for both the deterministic and stochastic signal models. In order to make the presentation clearer we start with the simplest case first, which is that of a single source. Then we extend the analysis to multiple sources. The basic ideas carry over to the multisource problem in a straightforward manner, but the technical details become considerably more intricate. Before we present the analysis, let us first give a little more background on the ubiquitous threshold effect.
8.1
The Threshold Effect
The threshold effect of nonlinear estimators and detectors is a well known phenomenon, see e.g. [Woo53, WJ65, Tre68, RB74]. In Figure 8.1 we try to illustrate the threshold behavior of the ML DOA estimator. The plot shows the MSE of the ML estimator and the CRB as a function of the SNR on a loglog scale. We can distinguish three different regions of operation. For high SNR the ML estimator attains the CRB. This is called the asymptotic region. When decreasing the SNR, at some point the MSE starts to rapidly deviate from the CRB. We call this point the threshold and the range of SNRs around it we refer to as the threshold region. For very low SNR the ML estimates 102
8.1. THE THRESHOLD EFFECT
are practically uniformly distributed across the entire parameter space and, thus, provide no information. We call this the no information region. In this region, the MSE is equal to the a priori variance. 0 MSE of the ML estimator
MSE of u = sin θ [dB]
−10 −20 −30
threshold
−40
CRB
−50 −60 no information −70 −20
−15
asymptotic
threshold −10
−5 SNR [dB]
0
5
10
Figure 8.1: Different regions of operations of the ML DOA estimator. Evidently, the CRB cannot predict the rapid deterioration of the ML performance below the threshold. This is due to the fact that the CRB is a local bound that depends essentially on the shape of the mainlobe in the ML criterion function, whereas the threshold effect is caused by large errors far away from the mainlobe. We call these large errors outliers. Figure 8.2 shows how an outlier may occur for the case of a single source in white Gaussian noise. The ML estimator is then equivalent to finding the maximum in the conventional beamformer spectrum. The left plot shows the array beampattern in the absence of noise. The beampattern has its global maximum at the true DOA which is zero. The right plot shows the beamformer spectrum when noise is present. In this case the global maximum is at a sidelobe peak; an outlier has occurred. Clearly, the probability of outlier is related to the noise power and the sidelobe level in the array beampattern. Arrays having high sidelobes are more prone to deliver outliers than arrays with low sidelobes. Therefore, the threshold effect is more prominent for sparse arrays than for ULAs with a half-wavelength element separation. For a sparse array, the threshold can occur at a relatively high SNR. Thus, the threshold effect sets a limit to the degree of sparsity that can be tolerated. These issues are dealt with in more 103
CHAPTER 8. INTRODUCTION
Beampattern
Beamformer spectrum 12
70
outlier 60
10
50
8 40
6 30
4 20
2
10
0 −1
−0.5
0
0.5
1
0 −1
−0.5
0
0.5
Figure 8.2: The left plot shows the array beampattern in the absence of noise. The right plot shows the beamformer spectrum when noise is present. This example is for an 8 element sparse array with element positions {0 1 2 11 15 18 21 23} λ/2, where λ is the wavelength. detail in Chapter 11.
8.2
Performance Bounds
We have seen that the CRB cannot be used to predict the threshold effect of the ML estimator. As alluded to previously, the reason for this is that it is a local bound that only considers small deviations from the true parameter values. Several other lower bounds have been developed over the years that take the effect of large errors into account. With these bounds it is possible predict the threshold effect. Examples of such bounds are the Barankin [Bar49], Ziv-Zakai [ZZ69], and Weiss-Weinstein [WW85] bounds. The Cram´er-Rao and Barankin bounds belong to the “classical” bounds, which treat the parameters as unknown deterministic quantities. They provide lower bounds on the MSE of the parameter estimates for each possible value of the parameter. In order not to obtain the trivial bound of zero, some restriction must be imposed on the estimator. The restriction that these bounds impose is that the estimator must be unbiased. Another class of bounds are Bayesian bounds, which assume that the parameters are random variables with known prior distributions. They provide bounds on the global MSE averaged over the prior distributions. There are no restrictions on the estimators which they apply to. In contrast to classical estimation theory, Bayesian theory provides an explicit solution for the min104
1
8.2. PERFORMANCE BOUNDS
imum mean square error (MMSE) estimator, which is the conditional mean estimator [Kay93]. There is also a version of the CRB that applies to random parameters, called the Bayesian CRB, see [Tre68]. For a thorough treatment of Bayesian bounds in parameter estimation, see [Bel95]. A crucial issue with regard to using lower bounds for predicting the threshold behavior is if they are tight, i.e. if there actually exists an estimator that can attain the bound. The MSE of the Bayesian MMSE estimator is of course a tight lower bound under the Bayesian framework, and the original formulation of the Barankin bound is also the greatest lower bound under the appropriate assumptions. Unfortunately, these bounds are impractical to compute for all but the simplest of problems. Therefore, other lower bounds have been developed that are more practical to compute, such as the WeissWeinstein and Ziv-Zakai bounds, and a simpler form of the Barankin bound in [MH71]. Several authors have applied these bounds to the DOA estimation problem, see [Ver87, DeL93, NV94, Ngu94, Bel95, BET96, ZS98, AE00, Ath01b, BS01]. The Weiss-Weinstein and Ziv-Zakai bounds appear to give a reasonable prediction of the performance of the ML estimator in the threshold region for a single source. The simplified versions of the Barankin bound appears to be weaker. However, care has to be taken when interpreting Bayesian bounds, since they can be strongly influenced by the parameter values which produce the largest errors. This makes it difficult to apply these bounds to the multi-source DOA estimation problem. If, for example, two sources are present, the estimation error will be very large when the DOA separation is small whereas the error will be small if the separation is large. Since the Bayesian MSE is averaged over all parameter values, it will be dominated by the MSE for small source separations. A way to overcome this problem is to condition on a particular DOA separation and evaluate the bound for this separation. However, this introduces information that is not normally available a priori which would lead to a weak bound. In [NV94, Ngu94] the Weiss-Weinstein bound was implemented for a two-source DOA estimation problem. Simulations showed that this bound was far too optimistic in predicting the MSE of the ML estimator in the threshold region. Another way could be to adjust the prior distribution in order to compensate for the strong dependence of the error on the parameter values. We will not pursue these issues any further in this thesis. The difficulty in applying these bounds to accurately estimate the threshold of the ML estimator for the two-source problem was also noted in [Tre02, Section 8.12.2]. We may identify two tracks to study the fundamental limitations in an estimation problem. On the one hand we can study different performance 105
CHAPTER 8. INTRODUCTION
bounds that are more or less tight. On the other hand we can study the performance of the best estimator that we know of. Usually, this estimator is the ML estimator. In this part of the thesis the main focus is on the performance of the ML estimator. The reasons for this are summarized in the following list • Tight (and computable) lower bounds for the multi-source DOA estimation problem are not available in the literature. • For the single source problem, there is still a gap between the best lower bound that we know of and the performance of the ML estimator. • To the author’s knowledge, no estimator with better threshold performance than the ML estimator is known. Therefore, the MSE of the ML estimator might serve as a “practical” lower bound. In Chapter 11 we will show an example in which the performance of the ML estimator is very close to that of the MMSE estimator. • There seems to be no general analysis available in the literature that provides an accurate characterization of the threshold region performance of the ML DOA estimator. • Developing models for the MSE of the ML estimator may provide new insights that are not obvious to interpret in lower bounds. • Lower bounds like the Weiss-Weinstein and Barankin bounds are far from trivial to implement. For example, they require maximization over a set of “test points”, and if these are not chosen judiciously one may encounter numerical problems. • Bayesian bounds, which appear to be the tightest ones, require that prior distributions are assigned to all unknown parameters. It is not obvious how to assign such prior distributions. Although the main focus of this part of the thesis is on modeling the MSE of the ML estimator, we will also, on several occasions, include discussions on bounds. It is interesting to compare the performance predictions the bounds provide with the MSE approximations that we will develop in the sequel.
8.3
Outline and Contributions
Part II of the thesis is organized as follows. First, we will develop a model for the performance of the ML DOA estimator for the single source case. 106
8.3. OUTLINE AND CONTRIBUTIONS
We then generalize this analysis to account for multiple sources. The thesis ends with two self-contained sections with application examples that provide further insights into the problem of DOA estimation in the threshold region. These examples deal with the single source problem. In the first example, we study an interferometric-like DOA estimation system consisting of two widely separated subarrays. A discussion on Bayesoptimal DOA estimation is included and we argue that the ML estimator can be considered as “nearly” optimal for this problem also when taking the threshold effect into account. In the second example, we use the Weiss-Weinstein lower bound to optimize the element positions in sparse arrays. Even if this bound is not perfectly tight, one might conjecture that the relevant system design parameters have similar impact on the actual performance as they have on the bound. The main contribution of the second part of this thesis is that it provides an extensive study of the threshold properties of the ML DOA estimator. The asymptotic properties of this estimator are fairly well known. It has been shown that the stochastic ML (SML) estimator achieves the corresponding CRB as the number of snapshots tends to infinity in [SN90b]. In [Vib93] it was shown that the SML estimator when applied to deterministic signals reaches the deterministic CRB as the SNR tends to infinity. However, a high SNR analysis of the SML estimator when applied to stochastic signals seems to be lacking in the literature. As for the deterministic ML (DML) method, it was shown to be asymptotically efficient as the SNR [Vib93] or number of sensors [Vib95] tends to infinity. Furthermore, it has been shown that the DML estimator does not achieve the CRB as the number of snapshots tends to infinity, unless the number of sensors also tends to infinity [SN89]. The threshold region properties of the ML DOA estimators appears to be a less explored area. To quote [Asy98], the finite-sample (or SNR, etc.) behavior of most detection or estimation methods is terra incognita. The basic idea behind the threshold region analysis presented herein dates back to [Tre68]. This concept was applied successfully in [RB74] for predicting the threshold behavior of ML frequency estimation of a single tone. Because of the duality between frequency and DOA estimation one can also apply the analysis in [RB74] to this problem. However, there are a couple of simplistic assumptions in [RB74] that are not appropriate for DOA estimation with sensor arrays, especially when nonuniform arrays are employed. Furthermore, their analysis is not applicable to the multi-source problem. In [Ver87, VH91], the approach of [RB74] was implemented for the single source DOA estimation problem, and was found to deliver overly optimistic performance predictions. An improvement was suggested by an empirical 107
CHAPTER 8. INTRODUCTION
modification of the method in [RB74]. For the particular problem setup in [Ver87, VH91] the results were accurate. In this thesis, we provide a more theoretically well-founded approach than the one in [Ver87, VH91]. It is a refined version of the approach in [RB74] that is also applicable to nonuniform arrays and the multi-source problem. We published the results on the ML threshold analysis in [Ath02a, Ath02b, Ath02c]. Independently, and about the same time, a very similar analysis for a matched-field problem in sonar signal processing was published in [Xu01, Xu02]. An important difference is that [Xu01, Xu02] treats the case of one signal that has multiple parameters, whereas in [Ath02b] we treat the case of multiple sources and one parameter per source. We also treat the case of deterministic signals, which is not covered in [Xu01, Xu02]. Very recently, [Ric03] applied the same analysis to handle colored noise and secondary data for the case of a single deterministic signal. The results presented in Section 10.4 on the threshold analysis of the SML estimator for the multi-source problem have not been published elsewhere. The main contribution of the application example in Section 11.1 is that it provides some further insights into DOA estimation using two separated subarrays. Several authors have treated various, more narrow, aspects of this problem. In [ZS98] the CRB was compared with the Weiss-Weinstein bound, in [LvdVD99, WZ98, ZW00] estimation algorithms specifically designed to resolve ambiguities were presented and in [Bom00] the ML estimator and the Barankin bound were computed for this array structure. This section is an extended version of [AE00], and a continuation of this work has been presented in [ES02]. Finally, in the last section, we propose a method for optimizing the element positions in sparse linear arrays. Different approaches to optimizing the element positions with respect to DOA estimation accuracy have been taken in the literature. In [AGGS96, GB97], the element positions of non-uniform linear arrays were optimized by minimization of the CRB. A problem with this approach is that high sidelobes have no effect on the CRB. Various approaches have been proposed to account for the effect of high sidelobes. In [VE99] the mainlobe area was minimized subject to a peak sidelobe constraint and in [AS00] competitive criteria involving maximum aperture and identifiability were considered. Although these approaches are intuitively appealing, there is no explicit connection between these ambiguity/aperture trade-offs and the resulting MSE. Herein, we propose a novel criterion for optimizing the element positions of sparse linear arrays. The criterion used is the SNR threshold of the Weiss-Weinstein lower bound. In this way we take near ambiguities into account while having an immediate link to the attainable MSE. An interesting result is that the array obtained 108
8.3. OUTLINE AND CONTRIBUTIONS
from the optimization and the so called minimum redundancy array [Mof68] have nearly identical Weiss-Weinstein lower bounds for the single source case.
109
CHAPTER 8. INTRODUCTION
110
Chapter
9
ML DOA Estimation of a Single Source In this chapter we will present an analysis of the threshold region performance of the ML DOA estimator for the single source case. We will consider this case in somewhat more detail than the multi-source problem. The reason for this is twofold: 1. It is easier to provide pedagogical clarity in the single source case since the multi-source problem is technically more awkward. 2. Validating the theoretical analysis with Monte Carlo simulations is very time-consuming for the multi-source problem. The single source problem permits us to study more aspects of the inherent limitations in the DOA estimation problem since time constraints are not that restrictive.
9.1
Data Model And Problem Formulation
Consider an array with K sensors receiving a single narrowband signal from a far-field source. For simplicity, assume that the array and the source are coplanar so that the DOA can be characterized by the azimuthal angle only. The complex baseband array output is modeled by the K × 1 vector x(t) = a(θ0 )s(t) + n(t),
t = 1, . . . , N
(9.1)
where a(θ0 ) is the K × 1 array steering vector that models the array response to a unit waveform from the DOA θ0 , measured relative to the array boresight. The sensors are assumed to be omnidirectional with unity gain. The 111
CHAPTER 9. ML DOA ESTIMATION OF A SINGLE SOURCE
array steering vector then takes the form � T a(θ) = e−jπd1 sin θ . . . e−jπdK sin θ ,
(9.2)
where dk , k = 1, . . . , K are the sensor positions in units of half wavelengths. Furthermore, N denotes the number of snapshots, s(t) is the complex amplitude at baseband of the impinging wavefront and n(t) is an additive noise term. The noise n(t) is assumed to be a stationary, zero mean, complex Gaussian process with second order moments E[n(t)nH (τ )] = σn2 I δt,τ E[n(t)nT (τ )] = 0 ∀ t, τ,
(9.3) (9.4)
where δt,τ is the Kronecker delta. Thus, the noise is assumed to be spatiotemporally white with variance σn2 . Two different models for the signal, s(t), will be considered; the stochastic and deterministic models. In the stochastic model, the signal is assumed to be a stationary, zero mean, complex Gaussian process with second order moments E [s(t)s∗ (τ )] = σs2 δt,τ E [s(t)s(τ )] = 0 ∀ t, τ.
(9.5) (9.6)
The signal is thus assumed temporally white with variance σs2 . Furthermore, it is assumed that the signal and the noises are statistically independent. In the deterministic model, the signal samples {s(t)}N t=1 are regarded as unknown, deterministic parameters that have to be estimated. The signal is considered nonrandom, i.e. the sequence {s(t)}N t=1 is frozen in all realizations N of {x(t)}N , only {n(t)} varies. Under the stochastic model assumption, t=1 t=1 N the signal is random, i.e. also the sequence {s(t)}t=1 varies from realization to realization. One may also think of the deterministic model as having conditioned on a particular realization of a random s(t). Therefore, the models are also sometimes referred to as unconditional and conditional models, see [SN90b]. The problem considered herein is; given the noisy measurements x(t), t = 1, . . . , N , to estimate the DOA of the far-field source. For mathematical convenience, the estimation of u0 � sin θ0 will be considered. More specifically, our aim is to develop analysis tools that are able to accurately characterize the performance of the ML estimator in the threshold region, where traditional tools such as the CRB are too optimistic. When designing a DOA estimation system, it is usually desired to operate above threshold. It is therefore important to be able to determine whether a specific design will 112
9.2. APPROXIMATION OF THE MSE
make the system operate above threshold or not. This is of particular interest in sparse array design where the threshold effect is more prominent, since such arrays will have high sidelobes due to the spatial undersampling. It is easy to show that ML estimation of u0 , under the stochastic or deterministic model assumption, amounts to finding the maximum of the beamformer spectrum1 N 1 � H ˆ V (u) = |a (u)x(t)|2 = aH (u)Ra(u), (9.7) N t=1 & ˆ = 1 N x(t)xH (t) is the sample covariance matrix and u � sin θ. where R t=1 N The ML estimator is thus the same under the stochastic and deterministic models for the case of a single source in white Gaussian noise. However, ˆ have the performance analysis will be different since the measured data in R different statistical properties under the two models. A property of the array that is intrinsic to the performance of any DOA estimation algorithm is the beampattern, defined by
g(u, u0 ) = aH (u)a(u0 ) =
K �
ejπdk (u−u0 ) .
(9.8)
k=1
The beampattern thus represents the complex gain as a function of u of a beamformer steered toward the direction u0 . Usually, we are mostly interested in the modulus of the beampattern. Therefore, it should be understood that whenever we speak of the beampattern in the sequel, we mean |g(u, u0 )|. The beampattern is characterized by a mainlobe and a number of sidelobes. The beamformer spectrum can be seen as a noise-corrupted version of the beampattern. When the SNR is high, the ML estimate will be close to the beampattern’s mainlobe peak. At low SNR, however, the noise may cause a sidelobe to become of greater magnitude than the mainlobe. In this case, the ML estimator will pick the sidelobe peak as the estimate, yielding a large estimation error. Such estimates are termed outliers and they are the cause of the threshold effect.
9.2
Approximation of the MSE
In this section, an approximation to the MSE of the ML estimator that takes the threshold effect into account is derived. The basic idea behind the 1
For the deterministic model it is trivial (just replace A with a in (1.53)). For the stochastic model, this requires that |a(u)| is independent of u, see [Vib95]. Evidently, this holds for the steering vector in (9.2). In Section 11.1.4 we show it for the case of known SNR. However, it turns out that the form of the estimator is independent of the SNR.
113
CHAPTER 9. ML DOA ESTIMATION OF A SINGLE SOURCE
approximation is to divide the MSE into two parts. The first part is due to small errors close to the true value. These local errors are well described by standard analysis tools, such as the CRB and Taylor expansions. The second part is due to outliers from the sidelobe region. Since the CRB and Taylor expansions are local in nature, large errors from outliers will not be captured by such an analysis. By the total probability theorem, the MSE can be written as a sum of two parts according to u − u0 )2 | no outlier ] E [(ˆ u − u0 )2 ] = Pr[ no outlier ] E [(ˆ + Pr[ outlier ] E [(ˆ u − u0 )2 | outlier ],
(9.9)
where “outlier” denotes the event that the global maximum in the beamformer spectrum is outside the mainlobe area (e.g. the null-to-null beamwidth). The idea to divide the MSE in this manner is not new, see e.g. [Tre68, RB74]. In [Tre68, RB74] it was assumed that the distribution of the estimates is uniform when an outlier occurs, since the signal has little influence. Although this is a reasonable assumption in the no information region, it is a crude approximation in the threshold region. In Figure 9.1 we plot the beampattern of a four element minimum redundancy array (MRA) together with a histogram of 2 · 105 ML estimates for an SNR value in the threshold region. Clearly, the histogram has the same shape as the beampattern. It should therefore be possible to obtain a more accurate approximation of the MSE in the threshold region if knowledge of the beampattern was incorporated. In order to obtain a more refined, and yet simple, approximation of the MSE and probability of outlier we approximate the continuous beampattern with a discretized version according to g˜(u, u0 ) =
Np �
g(un , u0 )δ(u − un ).
(9.10)
n=0
A reasonable approximation is to sample the continuous beampattern at the peaks. We then let u0 be the mainlobe peak and un , n = 1, . . . , Np , be the sidelobe peaks. Invoking the total probability theorem again, we obtain for the second term in (9.9) Pr[ outlier ] E [(ˆ u − u0 )2 | outlier ] = N � Pr[ sidelobe n] E [(ˆ u − u0 )2 | sidelobe n], n=1
114
(9.11)
9.2. APPROXIMATION OF THE MSE
5
10
Histogram Beampattern 4
10
3
10
2
10
1
10
0
10
−1
10
−1
−0.5
0 u
0.5
1
Figure 9.1: Beampattern for a 4 element MRA and histogram of DOA estimates. Deterministic model, 1 snapshot, SNR = 1 dB. where the notation “sidelobe n” means the event that the n-th sidelobe peak in the discretized beamformer spectrum is of greater magnitude than all other peaks. The conditional MSE when an outlier comes from the n-th sidelobe peak is simply given by E [(ˆ u − u0 )2 | sidelobe n] = (un − u0 )2 .
(9.12)
This, in effect, means that we have ignored the local variations around the sidelobe peaks. In order to obtain a good approximation to the MSE also at high SNR, the local errors around the true direction need to be considered. To achieve this, the MSE conditioned on the event that no outliers have occurred will be approximated by the CRB. The approximation to the total MSE thus becomes 2
E [(ˆ u − u0 ) ] = Pr[ no outlier ] CRB +
Np �
Pr[ sidelobe n] (un − u0 )2 .
n=1
(9.13) This approximation is actually quite general since nothing specific to the ML estimator has been used in its derivation. It could be applied to any 115
CHAPTER 9. ML DOA ESTIMATION OF A SINGLE SOURCE
estimation algorithm that finds its estimates by searching for the maximum (or minimum) of some cost function. If the estimator is not asymptotically efficient, the CRB in (9.13) should be replaced with the asymptotic variance of the estimator (if known). The problem specific quantities are the outlier probabilities, which will depend on the statistics of the cost function, and the CRB which will depend on the data model. The CRB for the deterministic model has been derived in [SN89]. For a single source (and the assumptions in Section 2) this can be written as CRB =
1 2π 2 SU
,
(9.14)
where N K� S � |s(t)|2 σn2 t=1 $ %2 K K 1 � 1 � U � dm − dn . K m=1 K n=1
(9.15)
(9.16)
Here, S may be interpreted as the total SNR integrated over the spatial and temporal samples and U as the variance of the element positions. The stochastic CRB has been derived in [SN90b], which for a single source can be expressed as CRB =
K · SNR + 1 , 2π 2 N K 2 SNR2 U
(9.17)
where SNR � σs2 /σn2 .
(9.18)
Note that the and stochastic CRB coincide for high SNR if one &deterministic N 1 2 2 lets σs = N t=1 |s(t)| .
9.3
Probability of Outlier
This section presents derivations of the outlier probabilities needed for obtaining the MSE approximation in (9.13). These probabilities also have an interest in their own, since the MSE may not be the only performance measure to consider. In fact, in some applications the probability of outlier may be a more relevant measure than the MSE. One might consider an outlier as an unacceptable event and that the actual size of the error, in this event, 116
9.3. PROBABILITY OF OUTLIER
is immaterial. In such a case, a measure of local accuracy (e.g. the CRB) together with the probability of outlier may provide more adequate information. Still, it is interesting to obtain an accurate MSE approximation since, by predicting the threshold, we can tell under which conditions we can rely on asymptotic results. Herein, we develop models for all these quantities and it is the user’s choice which one to pick for a particular application. Now, the probability of outlier is the probability of the union of events that one of the sidelobe peaks is higher than the mainlobe peak, i.e. � Np � {V (un ) > V (u0 )} , (9.19) Po = Pr n=1
where Po denotes the probability of outlier. Since the events {V (un ) > V (u0 )} are not disjoint, exact computation of this probability is a difficult, if not impossible, task. However, recall the following rule from elementary probability theory [GS92] � Np � � � � An = Pr[An ] − Pr[An ∩ Am ] + Pr[An ∩ Am ∩ Ak ] Pr n=1
n
n V (un )} ≈ Pr [V (uk ) > V (un )] k=0 k�=n
k=0 k�=n
≈ Pr [V (u0 ) > V (un )] ,
(9.24)
where only the dominant term in the sum has been retained. This term is the probability that the mainlobe is higher than sidelobe n, which is much higher than the probabilities that one of the other sidelobes is higher than sidelobe n. Using these approximations, we obtain Pr[ sidelobe n] ≈ 1 − Pr [V (u0 ) > V (un )] = Pn . 118
(9.25)
9.3. PROBABILITY OF OUTLIER
Thus, the problem has been reduced to computing the pairwise error probabilities, Pn , n = 1, . . . , Np . Returning to the MSE approximation in (9.13), this can now be written as $ % Np Np � � 2 Pn CRB + Pn (un − u0 )2 . (9.26) E [(ˆ u − u0 ) ] ≈ 1 − n=1
n=1
This is the final expression for MSE approximation that will be used in the rest of this chapter. In order to compute Pn , let y0 and yn denote the beamformer outputs when steered to the directions u0 and un respectively, i.e. y0 (t) = aH (u0 )x(t) = Ks(t) + aH 0 n(t) H H yn (t) = a (un )x(t) = an a0 s(t) + aH n n(t),
(9.27) (9.28)
where, for brevity, a0 � a(u0 ) and an � a(un ). Using (9.7), (9.22), (9.27) and (9.28) we obtain � N �� � |y0 (t)|2 − |yn (t)|2 < 0 . (9.29) Pn = Pr t=1
Since y0 and yn are linear transformations of the same complex, Gaussian random vector x, they are jointly Gaussian random variables. The transformation is not orthogonal (except when un is at a null in the beampattern), which means that y0 and yn are correlated. In order to compute this probability, we will use a result from Appendix B in [Pro95]. Therein, the probability that a Hermitian quadratic form in complex Gaussian random variables is less than zero is computed. The sum in (9.29) is a special case of such a quadratic form. The moments of y0 and yn will be different under the deterministic and stochastic model assumptions, giving different probabilities. The next two subsections will present the resulting probabilities for the two models.
9.3.1
Deterministic Signal Model
Under the deterministic signal model, the means of y0 and yn are E [y0 ] = Ks(t) E [yn ] = aH n a0 s(t),
(9.30) (9.31)
while the second order moments are given by Var[y0 ] = Var[yn ] = Kσn2 2 Cov[y0 , yn ] = aH 0 an σn . 119
(9.32) (9.33)
CHAPTER 9. ML DOA ESTIMATION OF A SINGLE SOURCE
Applying the results from [Pro95], we obtain the following expression for Pn after some straightforward algebra $1 % � 1S � � 2 2 S� Pn = Q 1 − 1 − rn2 , 1 + 1 − rn2 2 2 � � � � N −1 � � � 1 rn S rn S � 2N − 1 −S/2 I0 − 2N −1 I0 − e 2 2 2 m m=0 % %m % $ $$ 2 2 m � � N −1 1 − 1 − rn2 1 + 1 − rn2 rn S 1 � − 2N −1 Im − 2 2 r rn n m=1 N −1−m � �2N − 1� , (9.34) × k k=0 where
3
∞
Q(α, β) =
te−(t
2 +α2 )/2
I0 (αt) dt
(9.35)
β
is Marcum’s Q function and (x/2)m Im (x) = √ πΓ(m + 12 )
3
π
x cos θ
e
sin
0
2m
θ dθ =
∞ � k=0
(x/2)2k+m k!Γ(m + k + 1) (9.36)
is the modified Bessel function of the first kind and order m. Furthermore, S was defined in (9.15) and |aH 0 an | , (9.37) K which may be interpreted as the relative sidelobe level. Although the expression for Pn might appear somewhat unwieldy, it depends only on three characteristic quantities: the integrated SNR, S, the relative sidelobe level, rn , and the number of snapshots, N. A simpler expression is obtained if we consider the special case of a single snapshot. Equation (9.34) then simplifies to % $1 1 � � � � � � 2 2 1 S S S r n −S/2 1 − 1 − rn2 , 1 + 1 − rn2 − e I0 Pn = Q 2 2 2 2 rn �
(9.38) A fairly accurate approximation of this expression is given by [Ath02a] � � rn S 1 −S/2 Pn ≈ e I0 . (9.39) 2 2 120
9.3. PROBABILITY OF OUTLIER
9.3.2
Stochastic signal model
In the stochastic model, both y0 and yn are zero mean. The second order moments are given by E [y0 y0∗ ] = K 2 σs2 + Kσn2 2 2 2 E [yn yn∗ ] = |aH n a0 | σs + Kσn 2 H 2 E [y0 yn∗ ] = KaH n a0 σs + an a0 σn . Results from [Pro95] can be used again to obtain Pn according to � N −1 � � 2N − 1 m 1 qn , Pn = m (1 + qn )2N −1 m=0 where
4 1+ qn = 4
4σn2 (Kσs2 + σn2 ) +1 K 2 σs4 (1 − rn2 )
4σ 2 (Kσ 2 + σn2 ) −1 1 + n2 4 s K σs (1 − rn2 )
.
(9.40) (9.41) (9.42)
(9.43)
(9.44)
A simpler expression is obtained if we study the special case of a single snapshot: $ � �−1/2 % 4σn2 (Kσs2 + σn2 ) 1 Pn = 1− 1+ . (9.45) 2 K 2 σs4 (1 − rn2 ) An interesting, and somewhat unexpected, property of the stochastic ML estimator appears if we study the behavior of Pn for high SNR. For σs2 � σn2 , (9.43) reduces to � � 2N − 1 1 Pn = · , (9.46) N −1 [K(1 − rn2 ) SNR]N where SNR = σs2 /σn2 . Hence, Pn decreases as 1/SNRN for sufficiently high SNR. For the case of a single snapshot, i.e. N = 1, (9.46) becomes Pn =
1 . K(1 − rn2 )SNR
(9.47)
& Furthermore, we make the approximation, 1 − n Pn ≈ 1, which is very accurate for high SNR. Substituting into (9.26), the MSE approximation for high SNR becomes � (un − u0 )2 1 . E [(ˆ u − u0 ) ] ≈ CRB + K · SNR n=1 1 − rn2 Np
2
121
(9.48)
CHAPTER 9. ML DOA ESTIMATION OF A SINGLE SOURCE
The stochastic CRB is proportional to 1/SNR at high SNR according to (9.17). Hence, the outlier terms in (9.48) cannot be neglected when letting SNR → ∞. Therefore, the MSE will never reach the CRB when SNR → ∞. The stochastic ML estimator is thus not asymptotically efficient as SNR → ∞ for the case of a single snapshot. For N > 1, the outlier contribution to the MSE decreases as 1/SNRN and can thus be neglected when letting SNR → ∞. In this case, the efficiency of the ML estimator hinges upon whether the local errors are small enough to reach the CRB. Somewhat surprisingly, we have found in simulations that not even the local errors appear to reach the CRB for high SNR. The distance between the ML MSE and the CRB seems to decrease inverse proportionally to the number of snapshots for high SNR. We have not verified this observation theoretically, nor have we found any other work that derives the high SNR asymptotics for the ML estimator under the stochastic signal model. We leave this as a topic for future research.
9.4
Simulation Results
In this section we will present some results of Monte Carlo simulations of the ML estimator under the deterministic and stochastic signal models. The results will be compared with the approximations that we described in the previous section. Our objectives are to justify the theoretical models we have developed and to gain some further insights into the threshold region behavior of the ML estimator. The ML estimator was implemented by first computing the beamformer spectrum according to (9.7) on a coarse grid. Subsequently, a fine grid search was performed around each local maximum found in the first step. The final estimate was then obtained as the DOA corresponding to the maximum peak after the fine searches. The fine searches are needed for two reasons. Firstly, in order to locate the true maximum in the underlying continuous beamformer spectrum, the peaks must be sampled very close to their maxima. If the sampling is too coarse, there is a risk of picking the wrong peak if two peaks have similar magnitude. Secondly, we do not want the finite sampling grid to be the factor that bounds the variance of the estimator. Therefore, the sampling grid must be a fraction of the CRB if the error variance is ever going to reach the CRB. 122
9.4. SIMULATION RESULTS
9.4.1
Deterministic signal model
We will present the results for the deterministic case in a number of examples that illustrate various aspects of the threshold region behavior of the ML estimator. Since the threshold effect is most prominent for sparse arrays, we will use a particular sparse array structure called minimum redundancy arrays (MRAs) [Mof68] in the examples. In all examples we will use the 8 element MRA with element positions (normalized by λ/2) given by {0 1 2 11 15 18 21 23}. The modulus of the normalized beampattern, given by |¯ g (u, u0 )| = |aH (u)a(u0 )|/K,
(9.49)
is plotted in Figure 9.9, when steered to boresight (i.e. u0 = 0). For comparison purpose we also plot the normalized beampattern of the 8 element ULA with λ/2 element spacing. The null-to-null beamwidth is 0.12 for the MRA and 0.50 for the ULA. The peak sidelobe level of the MRA is -5.7 dB whereas the ULA has its peak sidelobe at -13 dB. MRA ULA
0 −2 −4
g [dB]
−6 −8 −10 −12 −14 −16 −18 −20 −1
−0.5
0 u
0.5
1
Figure 9.2: Beampattern for an 8 element MRA and ULA. Example 9.1: Figure 9.3 shows a plot of the pairwise error probability, Pn , as a function of the integrated SNR, S, for the case of a single snapshot. The true DOA is u0 = 0 and Pn is computed for un = 0.10, which corresponds to the sidelobe peak closest to the mainlobe in the beampattern of the 8 element MRA. The relative sidelobe level, rn , is -5.7 dB. The solid curve shows Pn according to the exact expression in (9.34) and the dashed curve 123
CHAPTER 9. ML DOA ESTIMATION OF A SINGLE SOURCE
the approximation in (9.39). The dots show the result of a Monte Carlo simulation with 107 trials for S < 15 dB and 108 trials for S > 15 dB. The agreement between the analytical expression in (9.34) and the simulation results is good, which is expected since no approximations were made in the derivation of this probability. We can also observe that the approximation in (9.39) is fairly accurate. � 0
10
−1
10
−2
10
Exact Pn Approximate Pn Simulation
−3
Pn
10
−4
10
−5
10
−6
10
−7
10 −20
−15
−10
−5
0 S [dB]
5
10
15
20
Figure 9.3: Pairwise error probability vs integrated SNR for the 8 element MRA; deterministic model, one snapshot.
Example 9.2: Figure 9.4 shows a plot of the pairwise error probability, Pn , as a function of the number of snapshots, N , a for constant signal, s(t) = 0.5ejπ/4 , and noise variance σn2 = 1. Otherwise, the same array and simulation parameters as in the previous example were used. The solid curve shows Pn according to (9.34) and the markers show the result of a Monte Carlo simulation with 107 trials. The figure shows that the analytical � calculation of Pn is also correct for multiple snapshots. Example 9.3: In order to check the accuracy of the union bound and MSE approximations in (9.5) and (9.26), respectively, we performed a Monte Carlo simulation of the ML estimator. Figure 9.5 shows the probability of outlier and MSE for different values of the integrated SNR. We used the same array as in the other examples and we show the case of a single snapshot. The number of Monte Carlo trials was 2 · 105 for S < 15 dB and 106 for S > 15 dB. An outlier was defined as an estimate outside the first null on either side 124
9.4. SIMULATION RESULTS
Analytical calculation Simulation −1
Pn
10
−2
10
−3
10
0
5
10 no of snapshots
15
20
Figure 9.4: Pairwise error probability vs the number of snapshots for the 8 element MRA; deterministic model, s(t) = 0.5ejπ/4 , σn2 = 1. of the mainlobe. We see that the union bound approximation is good for high SNR and poor for low SNR. Comparing with the MSE plot below we see that the union bound approximation is accurate in the threshold region. The bottom plot in Figure 9.5 shows that the derived MSE approximation is very accurate in modeling the performance of the ML estimator. Only in the no information region does the approximation deviate from the simulation results. This is obviously due to that the union bound is not tight in this region. However, we do not consider this discrepancy as a deficiency of the MSE approximation, since the estimator is more or less useless anyway in this region. We also compared the MSE approximation and simulation with the Cram´er-Rao and Barankin bounds. The CRB was given in (9.14) and the Barankin bound was computed according to [TK99]. As expected, the CRB is attained for high SNR but does not predict the threshold effect. This is done by the Barankin bound, but the prediction of the SNR threshold is far too optimistic. � Example 9.4: It is interesting to compare the MSE of an MRA with that of an ULA when both arrays have the same number of elements. Figure 9.6 shows the result from a simulation with the same 8 element MRA used before and an 8 element ULA with λ/2 element separation. The solid curves are the MSE approximations, the dashed are the corresponding CRBs, and the 125
CHAPTER 9. ML DOA ESTIMATION OF A SINGLE SOURCE
markers are the results from Monte Carlo simulations with 2 · 105 trials. The number of snapshots in these simulations was one. As expected, the MRA has lower MSE for high SNR, but a poorer threshold performance. Note that the MSE of the MRA is an order of magnitude lower than that of the ULA for high SNR. This comes at the price of an increased SNR threshold by 3 dB (when defined as the point of departure from the corresponding CRB).� Example 9.5: In this example, we illustrate how the different sidelobes contribute to the overall MSE. The n-th sidelobe contributes with Pn (un − u0 )2 to the MSE approximation in (9.26). These terms are shown for all sidelobes of the 8 element MRA in the left plot in Figure 9.7. The dashed curve is the total MSE. The right plot shows the accumulated MSE as we include more and more sidelobes in the second sum in (9.26). The sidelobes have been ordered in magnitude. We can observe that the position of the threshold is to a great extent determined by the highest sidelobe. Including more sidelobes in the approximation moves the threshold slightly, but its main effect is to increase the MSE. � Example 9.6: Finally, we show in Figure 9.8 how the pairwise error probability, Pn , depends on the relative sidelobe level, rn . The solid curve shows Pn versus rn according to the analytical expression in (9.34) and the markers show the result from a Monte Carlo simulation with 107 trials and one snapshot. The signal sample was s = 1.8ejπ/4 , and the noise variance σ 2 = 1. �
126
9.4. SIMULATION RESULTS
Probability of outlier vs integrated SNR
0
10
Union bound approximation Simulation
−1
Probability of outlier
10
−2
10
−3
10
−4
10
−5
10
0
5
10
15
20
25
S [dB]
MSE vs integrated SNR CRB Barankin bound MSE approximation Simulation
0
10
−1
MSE of u = sin θ
10
−2
10
−3
10
−4
10
−5
10
−6
10
0
5
10
15
20
25
S [dB]
Figure 9.5: Monte Carlo simulation of the single source ML DOA estimator under the deterministic signal model. An 8 element MRA was employed and we show the result for a single snapshot. The simulation results are compared with the analytical calculations. The number of Monte Carlo trials was 2·105 for S < 15 dB and 106 for S > 15 dB. Top: The union bound approximation of the probability of outlier in (9.21) is compared with simulations for different values of the integrated SNR. Bottom: The MSE approximation in (9.26) is compared with simulations and the Barankin and Cram´er-Rao bounds. 127
CHAPTER 9. ML DOA ESTIMATION OF A SINGLE SOURCE
−1
10
MSE MRA MSE ULA
−2
MSE of u = sin θ
10
CRB ULA −3
10
−4
CRB MRA
10
−5
10
0
5
10 S [dB]
15
Figure 9.6: MSE vs integrated SNR for an 8 element MRA and ULA, respectively; deterministic model, 1 snapshot.
Total MSE Sidelobe contributions
0
10
0
10
−1
10
−1
MSE of u = sin θ
MSE of u = sin θ
10
−2
10
−2
10
−3
−3
10
10
−4
−4
10
10
−5
−5
10
10 0
5
10
15
20
25
0
5
10
15
20
25
S [dB]
S [dB]
Figure 9.7: MSE contributions from the sidelobes of the 8 element MRA; deterministic model, 1 snapshot. Left: MSE contribution from each sidelobe (solid) and total MSE (dashed). Right: Accumulated MSE as more sidelobes are included in the second sum in (9.26).
128
9.4. SIMULATION RESULTS
−1
Analytical Simulation
10
−2
Pn
10
−3
10
−4
10
−5
10
−12
−10 −8 −6 −4 −2 Relative sidelobe level, 20*log (g ) [dB] 10
n
Figure 9.8: Pairwise error probability vs relative sidelobe level rn ; deterministic model, 1 snapshot, s = 1.8ejπ/4 , σ 2 = 1.
129
CHAPTER 9. ML DOA ESTIMATION OF A SINGLE SOURCE
9.4.2
Stochastic signal model
In this section we present some results of Monte Carlo simulations in order to support the analytical calculations for the stochastic signal model. This time, we will use a 4 element MRA with normalized element positions given by [0 1 4 6]. The normalized beampattern for this array is plotted in Figure 9.9 together with the 4 element ULA. The null-to-null beamwidth is 0.44 for the MRA and 1.0 for the ULA. The peak sidelobe level of the MRA is -5.3 dB whereas the ULA has its peak sidelobe at -11 dB. MRA ULA
0 −2 −4
g [dB]
−6 −8 −10 −12 −14 −16 −18 −20 −1
−0.5
0 u
0.5
1
Figure 9.9: Beampattern for a 4 element MRA and ULA. Figure 9.10 illustrates the accuracy of the union bound and MSE approximations for the stochastic signal model with 50 snapshots. The number of Monte Carlo trials was 106 . Similar to the deterministic case, the approximations are accurate in the threshold and asymptotic regions, but poor in the no information region. In this case the Barankin bound also provides an overly optimistic prediction of the SNR threshold. In order to check the accuracy of the approximations for fewer snapshots, we re-ran the previous simulation for 1, 2, 3, and 10 snapshots. The result is shown in Figure 9.11. For the case of one snapshot we can observe that the threshold effect is always present, even at very high SNR. Thus, as we have already shown theoretically, the estimator does not attain the CRB when the SNR is increased and we have only a single snapshot. The discrepancy between the simulations and the MSE approximation is due to that the union bound approximation is not so accurate for one snapshot under the stochastic model. 130
9.4. SIMULATION RESULTS
It is clear from the figure that the MSE and union bound approximations become more accurate when we increase the number of snapshots. This is natural since it is hard to characterize a stochastic signal with only a few samples. Even if we have a very high SNR, the outcome of the individual signal samples can be very small since the Gaussian PDF still has a considerable probability mass around zero. We can also observe that the MSE does not quite reach the CRB for high SNR even when the number of snapshots is more than one. This effect is not caused by outliers, but is due to the local errors not being small enough to attain the CRB. Clearly, the offset from the CRB decreases when the number of snapshots increases. In the final plot in Figure 9.12, we show the MSE versus the number of snapshots when the SNR is fixed at 3 dB. The number of Monte Carlo trials was 106 . In this case we also get good agreement between the MSE approximation and the simulations. As a final remark, we would like to comment on the bias of the estimators. The MSE can be divided into a variance and a bias part according to u). MSE(ˆ u) = Var(ˆ u) + Bias2 (ˆ
(9.50)
The Cram´er-Rao and Barankin bounds are bounds on the variance of any unbiased estimator. In the threshold region most estimators are biased. However, we have investigated the bias of the estimators in the Monte Carlo simulations and we found that in all cases the squared bias was negligible compared to the variance.
131
CHAPTER 9. ML DOA ESTIMATION OF A SINGLE SOURCE
Probability of outlier vs SNR
0
10
−1
Probability of outlier
10
−2
10
−3
10
−4
10
−5
10 −15
−10
−5 SNR [dB]
0
5
MSE vs SNR
0
10
Barankin bound CRB MSE approximation Simulation
−1
MSE of u = sin θ
10
−2
10
−3
10
−4
10
−5
10 −15
−10
−5 SNR [dB]
0
5
Figure 9.10: Monte Carlo simulation of the single source ML DOA estimator under the stochastic signal model. A 4 element MRA was employed and we show the result for 50 snapshots. The simulation results are compared with the analytical calculations. The number of Monte Carlo trials was 106 . Top: The union bound approximation of the probability of outlier in (9.21) is compared with simulations for different values of the SNR. Bottom: The MSE approximation in (9.26) is compared with simulations and the Barankin and Cram´er-Rao bounds. 132
9.4. SIMULATION RESULTS
1 snapshot
0
2 snapshots
0
10
10 CRB MSE approximation Simulation
CRB MSE approximation Simulation
−2
−2
10 MSE of u = sin θ
MSE of u = sin θ
10
−4
10
−6
−6
10
10
−8
10
0
−4
10
−8
10
20
30
40
10
50
0
10
20
SNR [dB]
50
30
40
50
10
−1
−1
10 Probability of outlier
10 Probability of outlier
40
0
10
−2
10
−3
10
−4
−3
10
10
−5
0
−2
10
−4
10
10
30 SNR [dB]
0
−5
10
20
30
40
10
50
0
10
20
SNR [dB]
SNR [dB]
3 snapshots
10 snapshots
0
10 CRB MSE approximation Simulation
0
10
10
−2
−2
10
MSE of u = sin θ
10
MSE of u = sin θ
CRB MSE approximation Simulation
−1
−3
10
−4
10
−4
10
−5
−6
10
10
−6
−10
0
10
20
30
10 −10
40
−5
0
5 SNR [dB]
10
15
20
−5
0
5 SNR [dB]
10
15
20
SNR [dB] 0
0
10
10
−1
−1
10 Probability of outlier
Probability of outlier
10
−2
10
−3
10
−4
−3
10
−4
10
10
−5
10 −10
−2
10
−5
0
10
20 SNR [dB]
30
40
10 −10
Figure 9.11: MSE and probability of outlier vs SNR, stochastic model for various numbers of snapshots. 133
CHAPTER 9. ML DOA ESTIMATION OF A SINGLE SOURCE
0
10
CRB MSE approximation simulation
−1
MSE of u = sin θ
10
−2
10
−3
10
−4
10
−5
10
0
5
10 15 no. of snapshots
20
25
Figure 9.12: MSE vs number of snapshots, stochastic model, SNR = 3 dB.
134
Chapter
10
ML DOA Estimation of Multiple Sources In this chapter we will generalize the analysis in the previous chapter to the case of multiple sources. The basic ideas behind the previous analysis carry over to the multi-source problem in a straightforward manner, but the technical details become more intricate.
10.1
Data Model and Problem Formulation
Generalizing the model in (9.1) to multiple sources is immediate: x(t) = A(θ)s(t) + n(t),
t = 1, . . . , N,
(10.1)
where A(θ) = [ a(θ1 ) . . . a(θM ) ], s(t) = [ s1 (t) . . . sM (t) ]T , and M is the number of sources. The zero subscripts on the true DOAs have been dropped for brevity. We assume that the number of sources is known, or has been estimated by some method. As in the single source problem we will study both the stochastic and deterministic models for the signals, sm (t). It is convenient to express the model in (10.1) in matrix form according to X = A(θ)S + N,
(10.2)
where � x(1) . . . x(N ) X = � s(1) . . . s(N ) S = � n(1) . . . n(N ) . N = 135
(10.3) (10.4) (10.5)
CHAPTER 10. ML DOA ESTIMATION OF MULTIPLE SOURCES
In this case we also consider the estimation of uk = sin θk , k = 1, . . . , M, for mathematical convenience.
10.2
Approximation of the MSE and Probability of Outlier
We will extend the MSE approximation for a single source to multiple sources simply by considering one dimension at a time in the multidimensional ML criterion function. First assume that the criterion function is parameterized by the DOAs only, i.e., there are no nuisance parameters that need to be considered. Such nuisance parameters could be, e.g., signal and noise powers. As we later will see, this assumption is valid for the deterministic ML criterion function, but not, in general, for the stochastic ML criterion. Now, let V¯ (u) denote the “asymptotic” ML criterion function. By asymptotic we mean high SNR or many snapshots, i.e., the noise should not have any effect on the positions of the peaks in the criterion function. We will return to more exact definitions of V¯ (u) when we study the different signal models. Furthermore, let un = [un1 , . . . , unM ]T denote the n-th local maximum of V¯ (u) and u0 = [u01 , . . . , u0M ]T the global maximum corresponding to the true value of u. We may also refer to these maxima as sidelobe and mainlobe peaks, respectively. To obtain an MSE approximation for the k-th DOA, we simply project the peaks in the multidimensional criterion function onto its k-th dimension. We thus obtain % $ Np Np � � 2 Pn CRB + Pn (unk − u0k )2 , (10.6) E [(ˆ u0k − u0k ) ] ≈ 1 − n=1
n=1
where now Pn � Pr[V (un ) > V (u0 )]
(10.7)
is the multidimensional extension of the pairwise error probability in (9.22). Note that we have used same union bound approximation of the probability of outlier in (10.7) as in the single source case, i.e. Po ≈
Np �
Pn .
(10.8)
n=1
In the following sections we will provide the details that are required for evaluating the approximations of the MSE and probability of outlier. In the 136
10.3. DETERMINISTIC MAXIMUM LIKELIHOOD
multi-source problem, the ML estimators are different under the deterministic and stochastic signal models. We will therefore treat these two cases in different sections. We start with the deterministic ML (DML) estimator and then present the results for the stochastic ML (SML) estimator. Results of Monte Carlo simulation will also be provided that corroborates the theoretical analysis.
10.3
Deterministic Maximum Likelihood
The ML estimator under the deterministic signal model is given by [B¨oh84, Wax85] u ˆ = arg max V (u),
(10.9)
� � ˆ V (u) = Tr ΠA (u)R .
(10.10)
u
where
� −1 H A (u) is the orthogonal projection Here, ΠA (u) = A(u) AH (u)A(u) ˆ = XXH /N is the sample covarimatrix onto the column space of A and R ance matrix. Under the deterministic signal model, we let the “asymptotic” ML criterion, V¯ (u), be the ML criterion function in the absence of noise. From (10.2) and (10.10) the deterministic part of the ML criterion is given by � 1 � Tr ΠA (u)A(u0 )SSH AH (u0 ) N � 1� �[A(u)(AH (u)A(u))−1/2 ]H A(u0 )S�2 . = F N
V¯ (u) =
(10.11)
We can interpret V¯ (u) as a multidimensional generalization of the array beampattern. The columns of A(u)(AH (u)A(u))−1/2 contain M orthogonalized beams. According to (10.11), V¯ (u) is obtained as the average output power from a matching operation between these beams and the received signal vectors in A(u0 )S. The CRB under the deterministic signal model is given by [SN89] CRB(u) =
� −1 σ2 � � H ⊥ , Re (D ΠA (u)D) � (SSH )T /N 2N
where Π⊥ A (u) = I − ΠA (u). 137
(10.12)
CHAPTER 10. ML DOA ESTIMATION OF MULTIPLE SOURCES
10.3.1
Pairwise Error Probability
The MSE approximation derived for the single source problem was easily generalized to multiple sources by considering one dimension at a time in the multidimensional criterion function. Now, the real challenge in analyzing the multi-source problem emerges when computing the pairwise error probabilities Pn . In this section, we will present a closed-form expression for the pairwise error probabilities given as an infinite series. Unfortunately, there are some practical problems associated with this expression. Therefore, we will subsequently present an accurate approximation to the desired probabilities that is more suitable for practical implementation. Similar to the single source problem, we will show that finding the pairwise error probabilities amounts to computing the distribution of a quadratic form. In fact, anticipating the next section, the stochastic ML criterion can also be expressed as a quadratic form. Thus, we have a common framework that encompasses all cases considered in this part of the thesis. To arrive at a quadratic form for the DML criterion function we use the following property of the trace operator [L¨ ut96] Tr{ABCD} = vecT (DT )(CT ⊗ A) vec(B).
(10.13)
The DML criterion can then be written as � � � � ˆ = 1 Tr ΠA XXH V (u) = Tr ΠA R N 1 1 = vecH (X)(IN ⊗ ΠA ) vec(X) = yH Ωy N N where IN is the N × N identity matrix, y � vec(X), and Ω � IN ⊗ ΠA . From (10.7) we can then express the pairwise error probability as Pn = Pr[yH Ψy < 0],
(10.14)
where Ψ � Ω(u0 ) − Ω(un ) = IN ⊗ [ΠA (u0 ) − ΠA (un )] .
(10.15)
Thus, in order to compute Pn , we need to compute the distribution of the quadratic form q = yH Ψy. It is a noncentral, indefinite quadratic form in complex Gaussian random variables. It is noncentral since E [y] = 0, and indefinite since q can be either positive or negative. Much attention has been given in the literature to compute the distributions of various quadratic forms, see e.g. [JK70, MP92] and the references therein. Most results, however, are concerned with restricted cases, such 138
10.3. DETERMINISTIC MAXIMUM LIKELIHOOD
as positive definite, central quadratic forms or real-valued variables. Relatively little attention has been paid to the general case encountered here. In [PR96, Rap96, ML00] series expansions are derived for the distribution of noncentral, indefinite quadratic forms in complex Gaussian variables. We will use the result from [Rap96] to compute the pairwise error probability. However, before we present the result we need some preliminaries. When computing the distribution of quadratic forms it is convenient to first reduce it to a diagonal form in independent variables with unit variance. To this end, let σ 2 Ψ = UDUH
(10.16)
be the eigendecomposition of σ 2 Ψ. Here, D is a diagonal matrix with the eigenvalues on the diagonal and U contains the corresponding eigenvectors as columns. By making the transformation w=
1 H U y, σ
(10.17)
the quadratic form can be expressed as z = wH Dw =
KN �
dk |wk |2 ,
(10.18)
k=1
where dk are the eigenvalues of σ 2 Ψ and wk is the corresponding element in w. The moments of w are 1 µ � E [w] = UH vec(AS) σ � E (w − µ)(w − µ)H = IKN .
(10.19) (10.20)
Thus, the quadratic form has been written as a linear combination of noncentral independent χ2 random variables. The number of degrees of freedom of the χ2 variables is determined by the multiplicities of the eigenvalues dk and the noncentrality parameters are determined by the elements in µ. Next, we will show that it is possible to reduce the representation of the quadratic form in (10.18) to a function of the eigenelements of the single snapshot problem. To see this, let us first define Q = ΠA (u0 ) − ΠA (un ),
(10.21)
which is the matrix we would have in the quadratic form if we had only a single snapshot. Let the eigendecomposition of σ 2 Q be given by σ 2 Q = EΛEH . 139
(10.22)
CHAPTER 10. ML DOA ESTIMATION OF MULTIPLE SOURCES
Assume that the nonzero eigenvalues of σ 2 Q are distinct. We do not give a formal proof here that this is the case, but we simply state that in all the scenarios we have studied this has been a valid assumption. Accounting for possible multiple eigenvalues of σ 2 Q is not difficult, but it complicates the notation. Now, since Ψ = IN ⊗ Q, there is a simple relationship between the eigendecompositions of Ψ and Q. It is well known that if λA and λB are eigenvalues of A and B, respectively, with associated eigenvectors vA and ut96]. vB ; then λA λB is an eigenvalue of A ⊗ B with eigenvector vA ⊗ vB [L¨ Hence, the eigenvalues of Ψ will be same as those of Q with the exception that each eigenvalue will occur with multiplicity N . Therefore, U = IN ⊗ E,
D = IN ⊗ Λ.
(10.23)
The parameters that determine the quadratic form representation in (10.18) can now be expressed in terms of the eigendecomposition of σ 2 Q, which is a smaller matrix than σ 2 Ψ if N > 1. The eigenvalues dk are equal to λk , where λk are the eigenvalues of σ 2 Q, and they each have multiplicity N . Furthermore, the mean vector µ in (10.19) can be written as µ =
� 1 1� IN ⊗ EH vec(AS) = vec(EH AS). σ σ
(10.24)
Exact Expression We are now ready to apply the result in [Rap96] to get the pairwise error probability. Theorem 10.1 Define Q � ΠA (u0 ) − ΠA (un ) and let the eigendecomposition of σ 2 Q be given by σ 2 Q = EΛEH ,
(10.25)
where the eigenvectors and eigenvalues have been ordered so that Λ = diag(λ1 , . . . , λL 0 . . . 0) where L is the number of nonzero eigenvalues, which are assumed to be distinct. Furthermore, define µ2j
N 1 � H � 2 |Ej As(n)|2 , σ n=1
j = 1, . . . , L,
(10.26)
where Ej is the j-th column of E. The pairwise error probability is then given 140
10.3. DETERMINISTIC MAXIMUM LIKELIHOOD
by � Pn = Pr[V (un ) > V (u0 )] = 1 − exp −
L �
µ2j
j=1
×
�
−N
(−λk )
{k:λk >0}
∞ �
1 m!(m − N + 1)! m=N −1
� 2 �m−N +1 µ (m) gk . − k λk (10.27)
(m)
Here, gk
is given by (m) gk
=
m−1 �� �=0
� m − 1 (�) gk [ln gk ](m−�) , �
(10.28)
where
L L � µ2j � 1 (0) gk = −λk exp , N α α kj kj j=1 j=1
(10.29)
j�=k
and [ln gk ](m) =
L 2 � m!λm j µj j=1 j�=k
m+1 αkj
+N
L � (m − 1)!λm j j=1
m αkj
,
(10.30)
where αkj = 1 − λj /λk for k = j and αkk � −1. Proof: See [Rap96]. Approximate Expression The expression in Theorem 10.1 has some practical limitations. It takes a long time to compute the expression in (10.28) and, more seriously, we have also experienced numerical problems for several relevant cases. These are due to the series being composed of sums and differences of extremely large numbers being multiplied by extremely small numbers. The exponentials sometimes caused numbers in the series to become larger than the maximum floating point number representable on the computer. These problems were even more pronounced when we implemented the related result in [ML00]. 141
CHAPTER 10. ML DOA ESTIMATION OF MULTIPLE SOURCES
Recognizing the numerical problems with the series expansion, a natural approach is to resort to some approximation that is more suitable for practical implementation. A common approach when computing the distribution of quadratic forms is to first compute the moment generating function analytically, and then use numerical integration for the inversion. Having reduced the quadratic form into its diagonal form as in the previous section, it is a simple matter to compute its moment generating function. The result is (see e.g. [Tur60, MP92] for details) % $ L � µ2 λk s k exp 1 − λk s k=1 , (10.31) M (s) = E [exp(sq)] = L � (1 − λk s)N k=1
where the same definitions as in Theorem 10.1 have been utilized. The probability density function (PDF) of q is then obtained by inverting the moment generating function using the Laplace inversion theorem. By integrating the PDF we can then obtain the pairwise error probability. Numerical procedures for this approach have been presented in [Ric80, Hel86, ML00, MLP02, Ath02b]. Although we found this approach efficient and numerically reliable, we will use another approach here that we have found even more efficient. A very accurate technique used in statistics for approximating distributions is the so called saddlepoint method introduced by [Dan54]. For a review of saddlepoint methods in statistics, see [Rei88]. Here, we will use a form of saddlepoint approximation presented in [Kuo99]. The approximation is based on the cumulant generating function, which is the natural logarithm of the moment generating function. From (10.31) we obtain the cumulant generating function as L L � � µ2k λk s log(1 − λk s). −N K(s) = log M (s) = 1 − λk s k=1 k=1
(10.32)
To compute the saddlepoint approximation we also need the first two derivatives of the cumulant generating function. From (10.32) we obtain �
K (s) = ��
K (s) =
L � k=1 L � k=1
� λk µ2k λk + N , (1 − λk s)2 1 − λk s k=1
(10.33)
� 2µ2k λ2k λ2k + N . (1 − λk s)3 (1 − λk s)2 k=1
(10.34)
L
L
142
10.3. DETERMINISTIC MAXIMUM LIKELIHOOD
Now, the saddlepoint approximation of the cumulative distribution function (CDF) according to [Kuo99] is given by � � v �� 1 F (x) = Pr[q ≤ x] = Φ w + log (10.35) w w where
3 x 1 2 e−t /2 dt Φ(x) = √ 2π −∞ 2 w = sign(s0 ) 2(s0 x − K(s0 )) 2 v = s0 K �� (s0 ).
(10.36) (10.37) (10.38)
Here, s0 is the so called saddlepoint satisfying the equation K � (s0 ) = x,
(10.39)
which can be numerically solved easily. It was shown in [Dan54] that this equation has a unique real root in the convergence region of the moment generating function. To ensure convergence of the moment generating function we pick the root in the interval 1 1 , − < s0 < min(λk ) max(λ+ k)
(10.40)
+ where λ− k and λk denote the negative and positive eigenvalues, respectively. The pairwise error probability is then obtained from
Pn = F (0).
10.3.2
(10.41)
Simulations
In this section, we will present the results of some Monte Carlo simulations in order to support the theoretical analysis presented in the previous section. However, first let us briefly digress into a couple of delicate issues that are more important in this study than is usually the case. Estimator Implementation The DML estimator is obtained by maximizing the criterion function in (10.10) or, equivalently, by minimizing � � ⊥ ˜ ˆ (10.42) V (u) = Tr ΠA (u)R , 143
CHAPTER 10. ML DOA ESTIMATION OF MULTIPLE SOURCES
which is more suitable for practical implementation. In the sequel we want to validate the theoretical model of the MSE and probability of outlier by means of Monte Carlo simulations. For such a validation to be of any value it is very important to ascertain that we find the actual global minimum and not a local minimum when implementing the DML estimator. Note that our aim here is to validate the theoretical models of the previous section and not to design a practical estimator for operation in a real system. In such a case other considerations can be important. In order to ensure that we find the global minimum, the DML estimator is implemented by first performing a coarse grid search over the DML criterion function to find the approximate locations of all local minima. From every local minimum a Newton optimization is then performed to refine the initial local estimates. The final estimate is then obtained from the lowest value after the Newton searches. The Newton searches are needed, because if there are local minima of similar magnitude it is essential to locate the position of the minima accurately in order to choose the true global minimum. In the local optimization we used a damped Newton algorithm, in which the estimate is iteratively calculated as uk+1 = uk − µk H−1 F� ,
(10.43)
where uk is the estimate at iteration k and µk is the step length. Furthermore, H is the Hessian matrix whose elements are given by {H}ij = and
� F =
∂ 2 V (u) , ∂ui ∂uj
∂V (u) ··· ∂u1
∂V (u) ∂uM
(10.44) �T (10.45)
is the gradient vector. For details on how to compute the Hessian and gradient, see [OVSN93]. The step length, µk , was chosen according to the scheme described in [OVSN93]. First we choose a µ < 1 and take µk = µi for the smallest integer i ≥ 0 that causes an adequate decrease in the criterion function. The iterations in (10.43) continue until one of the following stopping criteria is fulfilled: • |H−1 F� | is less than a specified tolerance. This tolerance is chosen as some fraction of the CRB in order to obtain sufficient accuracy. • No improvement can be found along the search direction (µk smaller than a tolerance). • A maximum number of iterations has been reached. 144
10.3. DETERMINISTIC MAXIMUM LIKELIHOOD
Number of Required Monte Carlo Trials The estimator implementation described in the previous section is computationally expensive since it involves a grid search followed by several Newton searches. In addition to this we want to model outliers, which occur with very low probability. Therefore, to obtain confidence in our simulation results, a large number of Monte Carlo trials is required. Consequently, validating the theoretical models of the previous section is very time-consuming. In order to minimize this time, we want to get a rough estimate of the number of Monte Carlo trials that are required for getting reliable results. We confine ourselves here to a very simple analysis rather than a rigorous one. To get a simple analysis we make a cruder approximation of the MSE than the one in (10.6). Assume that for low SNR the estimates are uniformly 2 distributed & on [−1, 1], resulting in a variance = 2 /12 = 1/3. Assume further that 1 − n Pn ≈ 1. We then obtain a rough estimate of the MSE according to 1 MSE ≈ CRB + Po . (10.46) 3 Incidentally, this approximation also permits us to estimate the threshold in a simple manner. The threshold is roughly where the “small error MSE” equals the “outlier MSE”, i.e. the threshold occurs approximately where Po = 3 CRB. This equation can be solved numerically to find for which values of SNR, number of snapshots, etc the threshold occurs. We are now interested in estimating the MSE using a Monte Carlo simulation with a number of trials, say L. We estimate the MSE and probability of outlier from the Monte Carlo simulation according to � = MSE
1� (ˆ u� − u0 )2 , L �=1 L
P5o = Lo /L,
(10.47) (10.48)
where uˆ� is the DOA estimate obtained in the �-th trial and Lo is the number of times uˆ� is outside the “mainlobe” in the asymptotic criterion function. � is composed of two parts. The first part comes The estimation error in MSE from the local errors and the second from the outliers. Since the outliers are rare events, this is the most difficult part to estimate with a limited number of trials. It is therefore reasonable to assume that the uncertainty in � is only due to the uncertainty in P5o . In the analysis here, we therefore MSE � by approximate MSE � = CRB + 1 P5o MSE 3 145
(10.49)
CHAPTER 10. ML DOA ESTIMATION OF MULTIPLE SOURCES
According to [Kay98, Appendix 2A], P5o is approximately Gaussian for large number of trials with mean = Po and variance = Po (1 − Po )/L. The relative error e = (P5o − Po )/Po then has the asymptotic PDF � � 1 − Po e ∈ As N 0, . (10.50) LPo Suppose we want |e| to be less than � with probability α. We then obtain � �1 1 − α 1 − Po � = Q−1 , (10.51) 2 LPo where Q−1 is the inverse function of 1 Q(x) = √ 2π
3
∞
e−t
2 /2
dt.
(10.52)
x
We can now calculate a 100(1 − α)% confidence interval for P5o according to Po − � < P5o < Po + �
(10.53)
where � is given by (10.51). In Figure 10.1 we plot the MSE (solid curve) according to (10.46) versus SNR and its corresponding 95% confidence interval (dashed curve) according to the analysis presented above. It is the same example for which we will later present the results of Monte Carlo simulations. The left plot is for 104 trials, which apparently gives rather poor confidence in the threshold region. The right plot is for 105 trials which should provide fairly accurate results also close to the threshold. It should be noted that the number of Monte Carlo trials is most critical close to the threshold. From Figure 10.1 we can observe that the estimation error of the MSE is largest close to the threshold. For very low SNR, the estimate of Po is accurate even with a moderate number of trials since the probability of outlier is fairly high in this region. For very high SNR, the estimate of Po is very poor since this probability is extremely low in this region. However, since Po is then extremely low, it has almost no influence on the MSE and it does not matter how accurately we estimate it. In the threshold region, Po is low, but high enough to affect the MSE. Therefore, more Monte Carlo trials are needed in the threshold region. A Monte Carlo simulation with the DML estimator described previously took about 14 hours for each SNR value when using 105 trials and implemented in Matlab on a 1 GHz computer. In contrast, computing the MSE 146
10.3. DETERMINISTIC MAXIMUM LIKELIHOOD
−1
−1
10
10
−2
−2
10
MSE of u
MSE of u
10
−3
10
−4
−4
10
10
−5
10
5
−3
10
−5
10
15
20
10
SNR [dB]
5
10
15
20
SNR [dB]
Figure 10.1: MSE (solid curve) and 95% confidence interval (dashed curves) for estimated MSE using Monte Carlo simulations with 104 trials (left plot) and 105 trials (right plot), respectively. approximation using the saddlepoint method described in the previous section is done in a split second. This demonstrates a clear advantage with having a model of the threshold region performance rather than having to perform time-consuming Monte Carlo simulations. Simulation Results We will now present the results of some Monte Carlo simulations of the threshold region performance of the DML estimator and compare it to the performance predictions obtained from the theoretical models that we have just derived. As in the single source case, we will evaluate the models with sparse arrays since the threshold effect is most salient for such arrays. First, we would like to validate the analytical calculation of the pairwise error probability, Pn . An example with an 8 element MRA with element positions, in units of λ/2, given by {0 1 2 11 15 18 21 23} and two sources at u0 = [0.2 0.4] was implemented. The two source signals were constant and equal, i.e. s1 (n) = s2 (n) = s. The number of snapshots was N = 5. Figure 10.2 shows the results of a simulation of the pairwise error probability, Pn , versus SNR = |s|2 /σ 2 for un = [0.20 − 0.37], which is the position of the highest “sidelobe peak” in the asymptotic ML criterion function. The dots show the result of a Monte Carlo simulation with 107 trials and the solid curve is the result obtained using the saddlepoint approximation of Pn . Clearly, the agreement between the simulation results and the theoretical analysis is satisfactory. The next example illustrates the accuracy of the approximations of the probability of outlier and MSE. Figure 10.3 shows the results from an example 147
CHAPTER 10. ML DOA ESTIMATION OF MULTIPLE SOURCES
0
10
Analytical Simulation −1
10
−2
Pn
10
−3
10
−4
10
−5
10
−6
10
−10
−8
−6
−4 −2 SNR [dB]
0
2
4
Figure 10.2: Pn for un = [0.20 − 0.37] vs SNR for an example with two sources at u0 = [0.2 0.4] and an 8 element MRA; deterministic signal model, 5 snapshots, 107 Monte Carlo trials. with a 4 element MRA with element positions {0 1 4 6} and two sources at u0 = [0 0.2]. Thus, according to Section 9.4.2, the source separation is slightly less than half the null-to-null beamwidth of this array. Again, the two source signals were constant and equal, i.e. s1 (n) = s2 (n) = s, but this time with 7 snapshots. The number of Monte Carlo trials was 105 . The top plot in Figure 10.3 shows the probability of outlier versus SNR per space-time sample, obtained from the simulations and union bound approximation in (10.8), respectively. The estimates of probability of outlier from the simulations were obtained by counting the number of estimates outside the “mainlobe” region of the ML criterion function, and dividing by the total number of trials. The bottom plot shows the MSE versus SNR per space-time sample for the source at u = 0 obtained from the simulation and equation (10.6) respectively. The DML estimator was implemented according to Section 10.3.2. The dashed line is the CRB from [SN89], which does not indicate any threshold effect. We did not implement the Barankin bound for the multi-source problem, since this bound was not a good predictor of the ML performance for the single source case, and there is no reason to expect that it would be better for the multi-source case. The figure clearly shows that our theoretical models of the threshold region performance under the deterministic signal model are accurate also for the multi-source problem. 148
10.3. DETERMINISTIC MAXIMUM LIKELIHOOD
Union bound Simulation
−1
Probability of outlier
10
−2
10
−3
10
−4
10
−5
10
5
10
15
20
SNR [dB] −1
10
MSE approximation CRB Simulation −2
MSE of u1 = sin θ1
10
−3
10
−4
10
−5
10
5
10
15
20
SNR [dB]
Figure 10.3: Monte Carlo simulation of the multi-source ML DOA estimator under the deterministic signal model. A 4 element MRA was employed and there were two sources at u0 = [0 0.2]. The number of snapshots was 7. The simulation results are compared with the analytical calculations. The number of Monte Carlo trials was 105 . Top: The union bound approximation of the probability of outlier in (10.8) is compared with simulations for different values of the SNR. Bottom: The MSE approximation in (10.6) is compared with simulations and the Cram´er-Rao bound.
149
CHAPTER 10. ML DOA ESTIMATION OF MULTIPLE SOURCES
10.4
Stochastic Maximum Likelihood
Under the stochastic signal model, the ML criterion function to be minimized is given by (see Section 1.4.2) � � 2 −1 ˆ (10.54) V (u, P, σ ) = log |R| + Tr R R , where R(u, P, σ 2 ) = A(u)PAH (u) + σ 2 I.
(10.55)
A complication with the criterion function in (10.54) is that it depends on the nuisance parameters in P and σ 2 . This makes the optimization problem considerably more difficult. However, as stated in [B¨oh86] and proved later in [SN95] the criterion function can be concentrated with respect to P and σ 2 . According to the above cited references, the ML estimates of P and σ 2 are obtained by inserting the ML estimates of u in the following expressions: � � ˆ ˆ −σ P(u) = A† (u) R ˆ 2 (u)I A†H (u), (10.56) � � 1 ˆ (10.57) Tr P⊥ σ ˆ 2 (u) = A (u)R . K −M The concentrated form of the SML criterion function is then obtained by substituting these expressions back into (10.54). This gives � � � � H 2 ˆ V (u) = log �A(u)P(u)A (u) + σ ˆ (u)I� . (10.58) Unfortunately, there is a problem with this concentrated form of the criterion function. The estimate of the signal covariance matrix in (10.56) was derived by minimizing the unconcentrated criterion function with respect to P over the set of Hermitian matrices. Therefore, there is no guarantee that ˆ the resulting estimate is positive semi-definite, as it should be. Whenever P in (10.56) is positive semi-definite, the DOA estimates based on the unconcentrated and concentrated criterion functions, respectively, coincide [Bre88]. ˆ is indefinite, they may differ. However, if P In the case of a non-singular signal covariance matrix P (i.e. non-coherent sources) this is no problem when the number of snapshots is large. The reaˆ is a consistent estimate of P as N → ∞, which means son for this is that P ˆ that P will be positive definite for sufficiently large N . In the case of coherent sources, the approach of [SOVM96] may be adopted. Therein, an ML estimator based on a square-root parameterization of the signal covariance 150
10.4. STOCHASTIC MAXIMUM LIKELIHOOD
matrix subject to a rank constraint was derived. However, for large N , the difference between this and the ordinary ML estimator was found to be small. Apparently, there seems to be no problem with indefinite signal covariance matrix estimates in the asymptotic regime. Unfortunately, this is not the case ˆ is indefinite it is very in the threshold region. As we later will see, when P likely that the DOA estimate will be an outlier. Conversely, if an outlier has ˆ Therefore, the occurred, it is very likely that it was based on an indefinite P. estimator that minimizes the concentrated SML criterion function in (10.58) will have significantly poorer threshold region performance than the one that minimizes the unconcentrated criterion function in (10.54). The concentrated criterion is easier to minimize than the unconcentrated one, since it depends on fewer parameters. On the other hand, as we just mentioned, it has poorer threshold region performance. Furthermore, it seems more difficult to analyze the statistical distribution of the concentrated criterion than the unconcentrated one due its complicated dependence on the measured data. As we will show later, the unconcentrated criterion can be expressed as a quadratic form and, hence, we can use an analysis similar to the one that we used for the deterministic case. Our initial idea was to derive approximations of the MSE and probability of outlier for the unconcentrated criterion and then to validate the theory with Monte Carlo simulations using the concentrated criterion. Evidently, this is not a viable approach. We can then identify two approaches to follow: • Accept the poorer threshold region performance of the estimator based on the concentrated criterion, and develop the theory for this case. Unfortunately, we were not able to find the pairwise error probabilities that are associated with this criterion. • Develop the theory for the estimator based on the unconcentrated criterion and use the same estimator in the Monte Carlo simulations. Unfortunately, this approach also presents problems. Although we are able to develop the theory, the estimator in its general form is too complex to use in a sufficient number of Monte Carlo trials for a reliable validation. Due to the these difficulties we are not able provide a complete picture of the threshold region performance of the SML estimator. We must be content with an analysis of a couple of special cases. These are: 1. Unconcentrated criterion function with the assumption that P and σ 2 are known. 151
CHAPTER 10. ML DOA ESTIMATION OF MULTIPLE SOURCES
2. Unconcentrated criterion with unknown P and σ 2 , but the sources are known to be uncorrelated, i.e. P is diagonal. The first case is not particularly realistic in radar applications, whereas the second one is. However, we will find that the performances in these cases are very similar. We will also compare these cases with the case of the concentrated criterion through simulations. A discussion on the difficulties with the case of unconcentrated criterion and correlated sources will also be given. All in all, we dare to say that this section will at least provide a decent understanding of the threshold region performance of the SML estimator.
10.4.1
Pairwise Error Probability
Similarly to the case of the DML estimator, we will first express the ML criterion function as a quadratic form. Let η be the parameter vector that contains the unknown parameters. In the case of known P and σ 2 , this is simply η = u. In the case of unknown, but diagonal, P and σ 2 , it is given by η = [ uT P1 · · · PM σ 2 ]T , where P1 , . . . , PM are the signal powers. From (10.54) the probability that the criterion function at a point η n is lower than the criterion function at the true value η 0 can be expressed as Pn � Pr[V (η n ) < V (η 0 )] � �� � −1 �� � −1 ˆ �Rn R0 � , = Pr Tr R−1 − R R < log 0 n
(10.59)
−1 where R0 � R(η 0 ) and Rn � R(η n ). Defining Q � R−1 n − R0 this can be written as � � � � � � (10.60) Pn = Pr Tr QXXH < N log �R−1 n R0 .
Using (10.13) we obtain � � � � Pn = Pr vecH (X)(IN ⊗ Q) vec(X) < N log �R−1 n R0 � −1 � � H = Pr y Ψy < N log �Rn R0 � ,
(10.61)
where Ψ � IN ⊗ Q and y � vec(X). Similarly to the DML case we have arrived at an expression involving a quadratic form in complex Gaussian random variables. The quadratic form obtained in the SML case has some properties that are different from the DML case. In the SML case the quadratic form is central since E [y] = 0. This will allow the PDF of the quadratic form to be expressed as a finite sum as compared to the infinite sum in (10.27) for 152
10.4. STOCHASTIC MAXIMUM LIKELIHOOD
the DML case. The reason for this is that a nonzero mean of the quadratic form implies essential singularities in its moment generating function. The PDF of the quadratic form is given by the inverse Laplace transform of the moment generating function. This can be obtained, e.g., by residue calculus. Due to the essential singularities, the Laurent series expansion will be an infinite series. In the zero-mean case, however, there are only finite-order poles leading to a finite sum expression for the residues. Another property that differs from the DML �case is that the covariance of y is not the identity matrix, but is given by E yyH = IN ⊗ R0 . In both the DML and SML cases the quadratic form is indefinite.
Exact Probability First we will present a closed form expression for the pairwise error probability, Pn , given as a finite sum. In some cases, this expression is not very practical. Therefore, an accurate approximation of Pn is given in the next section.
Theorem 10.2 Let di , i = 1, . . . , m, be the distinct eigenvalues of R0 R−1 n that satisfy di = 1 and denote the corresponding multiplicities by ni . Let γi � (di − 1)/2 be ordered such that γ1 > . . . > γp > 0 > γp+1 > . . . > γm . Assume first that |R0 | < |Rn | and define
λi =
γi , i = 1, . . . , p −γi , i = p + 1, . . . , m −2N n +N
ci
(10.62) &m
n
i k=1 k λi = p m �� �� � �(10.63) (N ni − 1)! 2N ni (λi + λk )N nk (λi − λk )N nk
k=1
k=p+1 k�=i
Furthermore, define
(β) Bi
=
� β−1 � � β−1 β � =0
β�
(β−1−β � ) Ai
�� −1 � �β � − 1� (β � −1−β �� ) β� (0) Ai . . . Ai �� β β �� =0 β ��� =0
β � −1
(10.64) 153
CHAPTER 10. ML DOA ESTIMATION OF MULTIPLE SOURCES
where m � N nk (2λk )v+1 λv+1 i = v! v+1 (λi − λk ) k=p+1
(v) Ai
k�=i
v+1
+ (−1)
v!
p � N nk (2λk )v+1 λv+1 i
k=1
(λi + λk )v+1
,
v ≥ 0. (10.65)
Then, the pairwise error probability is given by Pn = F (N log |R0 R−1 n |),
(10.66)
where F (x) =
m � i=p+1
×
ci
N� ni −1 � β=0
(β) Bi ex/2λi
� N ni − 1 (−1)N ni −1−β (2λi )N ni −β (N ni − 1 − β)! β
N ni −1−β
� k=0
(−x)k . k!(2λi )k
(10.67)
If |Rn | < |R0 |, then change the definition of γi to γi � (1 − di )/2. The pairwise error probability is in this case given by Pn = 1 − F (−N log |R0 R−1 n |).
(10.68)
Proof: See Appendix 10A Approximate Probability Although the pairwise error probability as given in Theorem 10.2 is in closed form, this expression has some practical limitations. When the number of snapshots is small the expression is fast to compute and also numerically reliable. However, for a large number of snapshots the recursion in (10.64) takes a long time to compute, and the final expression is also sensitive to round-off errors since it involves differences between very large numbers. For the examples to be presented later, the expression in Theorem 10.2 works fine up to approximately 12 snapshots. For larger numbers of snapshots, one must resort to some approximation that is more practical to compute. A fast and accurate approximation based on numerical integration was given in [Imh61]. However, since we found the saddlepoint method, described previously in Section 10.3.1 for the DML 154
10.4. STOCHASTIC MAXIMUM LIKELIHOOD
problem, to be even faster and more accurate, we will adopt this approach here. In order to apply the saddlepoint method we need the moment generating function of the quadratic form q = yH Ψy.
(10.69)
Defining � Σ = E yyH = IN ⊗ R0 ,
(10.70)
we obtain the moment generating function as [MP92] M (s) = E [exp(sq)] =
1 L �
,
(10.71)
(1 − λk s)
rk
k=1
where λk , k = 1, . . . , L, are the distinct eigenvalues of ΣΨ and rk is the multiplicity of λk . The cumulant generating function is given by K(s) = log M (s) = −
L �
rk log(1 − λk s),
(10.72)
k=1
and its first two derivatives are easily found as L � rk λ k K (s) = , 1 − λk s k=1 �
��
K (s) =
L � k=1
rk λ2k . (1 − λk s)2
The saddlepoint approximation of the CDF is then given by � � v �� 1 ˜ F (x) = Φ w + log , w w where
3
(10.73)
(10.74)
(10.75)
x
1 2 √ e−t /2 dt, 2π −∞ 2 w = sign(s0 ) 2(s0 x − K(s0 )), 2 v = s0 K �� (s0 ).
Φ(x) =
155
(10.76) (10.77) (10.78)
CHAPTER 10. ML DOA ESTIMATION OF MULTIPLE SOURCES
The saddlepoint s0 is obtained by numerically finding a solution to K � (s0 ) = x
(10.79)
in the interval 1 1 , − < s0 < min(λk ) max(λ+ k)
(10.80)
+ where λ− k and λk denote the negative and positive eigenvalues, respectively. The pairwise error probability is then obtained from � � � (10.81) Pn = F˜ (N log �R−1 n R0 ).
10.4.2
MSE Approximation
In this section we will discuss how to apply the MSE approximation to the SML estimation problem. The first issue is the definition of the “asymptotic” criterion function, V¯ (η), that should be used in the MSE approximation in (10.6). We cannot use the noise-free criterion function as we did in the DML ˆ in (10.54) case, since this would make R singular. Instead, we will replace R with R0 = A(u0 )P0 AH (u0 ) + σ02 I,
(10.82)
where the zero subscripts indicate the true parameter values. With this definition, V¯ (η), is equal to the limiting criterion function as N → ∞. The next issues are which CRB to use and how to deal with the nuisance parameters in P and σ 2 when applying the MSE approximation to the DOA estimates. These issues depend on the assumptions we make, and we discuss one case at a time in the following paragraphs. Unconcentrated criterion, known P and σ 2 In this case, the only unknown parameters are the DOAs in u. Therefore, the problem is similar to the DML case and we can use the same MSE approximation. The only thing that differs from the DML case are the pairwise error probabilities and the CRB. The pairwise error probabilities are obtained from Theorem 10.2, and we take the CRB from [Tre02, Section 8.4.3], reproduced below for convenience � �T 1 � � Re (PAH R−1 AP) � DH R−1 D CRB(u) = 2N � �T ��−1 + (PAH R−1 D) � PAH R−1 D . (10.83) 156
10.4. STOCHASTIC MAXIMUM LIKELIHOOD
Unconcentrated criterion, uncorrelated signals, unknown P and σ 2 In this case we need to deal with the nuisance parameters in P and σ 2 . The SML criterion function is a multidimensional function with a multimodal structure in the DOA hyperplane. The multimodality is due to the highly nonlinear dependence of the criterion function on the DOA parameters. However, P and σ 2 enter the criterion function in a nicer way than the DOAs, since R is linear in P and σ 2 . Actually, we have found by numerical investigation of the SML criterion function that the multimodal structure is limited to the DOA hyperplane only. Furthermore, in the case of uncorrelated signals, we have found that the positions of the DOA mainlobe and sidelobe peaks in the asymptotic criterion remain approximately the same when varying P and σ 2 . In order to support this claim, we will show some plots of the unconcentrated SML criterion function for an example with two sources. The unknown parameters are in this case η = [ u1 u2 P1 P2 σ 2 ]T . It is difficult to visualize a function in such high dimensions. Therefore, we show in Figure 10.4 different slices of the high-dimensional unconcentrated SML criterion function. The different plots show V (η) when varying two parameters while keeping the others fixed. The top left plot shows V (P1 , P2 ) for fixed u1 , u2 , and σ 2 . Clearly, there is no modal structure in these dimensions. The top right plot shows V (P1 , u1 ) for fixed u2 , P2 , and σ 2 . We see the familiar mainlobe/sidelobe structure in the DOA dimension, but no such behavior in the signal power dimension. Furthermore, we observe that the mainlobe/sidelobe structure remains the same when varying the signal power. The bottom left plot shows V (u1 , σ 2 ) for fixed u2 , P1 , and P2 . The observations made for the previous plot hold also for this one. Finally, the bottom right plot shows V (P1 , σ 2 ) for fixed u1 , u2 , and P2 . This surface has no ambiguity structure. The observations that the mainlobe/sidelobe structure is limited to the DOA dimensions, and that this structure is fairly unaffected by the values of the other parameters simplify matters to a great extent. We then need only to consider the DOA sidelobe structure when using the MSE approximation. Therefore, we can use the same MSE approximation as in the previous cases. We evaluate Pn for η n = [ un P0 σ02 ]T , where P0 and σ02 are the true values of P and σ 2 . Furthermore, we need to use the CRB for uncorrelated signals which is given by [Tre02, Section 8.4.2]
CRB(u) =
� T −1 Juu − Juα J−1 , αα Juα 157
(10.84)
CHAPTER 10. ML DOA ESTIMATION OF MULTIPLE SOURCES
where
� � �T Juu = 2N Re (PAH R−1 D) � PAH R−1 D � �T � , + (PAH R−1 AP) � DH R−1 D � Jus Jun , Juα = � � Jss JTsn , Jαα = Jsn Jnn � � �T � , Jus = 2N Re (PAH R−1 A) � AH R−1 D � � Jun = 2N Re Diag{PAH R−2 D} , � � �T � Jss = N (AH R−1 A) � AH R−1 A , Jsn = N Diag{AH R−2 A}, Jnn = N Tr{R−2 }.
(10.85) (10.86) (10.87) (10.88) (10.89) (10.90) (10.91) (10.92)
Unconcentrated criterion, correlated signals, unknown P and σ 2 This is the most difficult case, since when the signals are correlated the positions of the DOA sidelobe peaks will change with the signal correlation. The full dimension of the SML criterion must then be taken into account when applying the MSE approximation. The pairwise error probabilities are still given by Theorem 10.2, but care has to be taken at which points the parameters should be evaluated at. Although the MSE approximation would probably work also for this case, it would be very difficult to validate such a model with Monte Carlo simulations with the computing power available today. It would require on the order of 105 Monte Carlo trials1 , where each trial would involve a search for the global minimum in a high-dimensional function with a complicated multimodal structure. Concentrated criterion This case is equivalent to first case in the sense that the criterion function depends only the DOA parameters. Therefore we can use the MSE approximation used before. However, as alluded to previously, the minimizer of the concentrated criterion is not necessarily the same as the minimizer of the unconcentrated criterion. In fact, we will later see that when using the concentrated criterion the threshold will be significantly higher than when using 1
This figure is of course scenario dependent. In the examples that will be presented later in the simulations section, 105 trials are required for a reasonably reliable validation. See further Section 10.3.2.
158
10.4. STOCHASTIC MAXIMUM LIKELIHOOD
the unconcentrated one. This behavior could be predicted if we computed the pairwise error probabilities for the concentrated criterion. Unfortunately, this appears to be a difficult task and we leave that as an open research problem. Nevertheless, it is interesting to compare the threshold region performance of this estimator with the one based on the unconcentrated criterion. Therefore, we will also include this case in the simulations.
10.4.3
Simulation Results
In this section we will present the results of some Monte Carlo simulations in order to illustrate how accurately we can model the threshold region performance of the SML estimator. As we have seen, some different cases appear depending on how we treat the nuisance parameters in P and σ 2 . Of course, this will have an impact also on the implementation of the estimator. In the following, we will present simulation results for all the cases discussed above except for the case of unconcentrated criterion, correlated signals, unknown P and σ 2 . In all cases the estimates are obtained using first a coarse grid search followed by a Newton search from each local minimum as described in Section 10.3.2. Let us describe the standard example we have used in all simulations that we will present in the sequel. The same four element minimum redundancy array is used as in the DML examples. We consider a scenario with two sources having DOAs u0 = [−0.1 0.1]. The source signals have equal powers and are uncorrelated. The SNR is defined as SNR = P/σ 2 , where P is the signal power. In the plots of the MSE we will compare the results of Monte Carlo simulations with the MSE approximation and the CRB. Pairwise Error Probability Before we show results from Monte Carlo simulations of the MSE, we would like to first check the analytical calculation of the pairwise error probabilities in Section 10.4.1. Figure 10.5 shows the result from a Monte Carlo simulation of Pn versus SNR for a case where u0 = [−0.1 0.1] and un = [−0.015 0.67]. This corresponds to the pairwise error probability for the global minimum and the lowest local minimum in the asymptotic likelihood function when P and σ 2 are known. The pairwise error probabilities were evaluated at the true values of P and σ 2 . The number of trials was 107 and the number of snapshots was 5. We can observe that there is a perfect match between the simulation and the analytical calculation. No difference between the exact expression in Theorem 10.2 and the saddlepoint approximation could be observed. 159
CHAPTER 10. ML DOA ESTIMATION OF MULTIPLE SOURCES
Unconcentrated criterion, known P and σ 2 Figure 10.6 shows the MSE obtained from our approximation and a Monte Carlo simulation with 105 trials. The CRB is also included for comparison. The MSE is plotted versus the SNR and the number of snapshots was 12. We see that the MSE approximation is not as accurate as in the DML case. However, the MSE approximation predicts the SNR threshold very accurately. The discrepancy between the MSE approximation and the simulation result is due to that the MSE does not attain the CRB for high SNR. If we knew the high SNR variance of the SML estimator, the MSE approximation would be very accurate. As usual the MSE approximation is poor in the no information region due to the union bound approximation. In Figure 10.7 we show a scatter plot of all 105 estimates for SNR = -1.6 dB, which is in the threshold region. A contour plot of the criterion function is also drawn. We see that most estimates are in the mainlobe region, and that the outliers are clustered around the sidelobe peaks. A color 3-D view of this plot is printed on the cover of this thesis. In Figure 10.8 we show the result when varying the number of snapshots, keeping the SNR fixed at 5 dB. The number of Monte Carlo trials was 105 . Also in this case we get a good prediction of the threshold, but the MSE approximation is not as tight as in the DML case. The MSE has not quite reached the CRB for 25 snapshots, but from the figure it appears likely that it would if the number of snapshots was increased further. Unconcentrated criterion, uncorrelated signals, unknown P and σ 2 In Figure 10.9 we show the result when P and σ 2 are unknown but the signals are known to be uncorrelated. The number of snapshots was 12 and Monte Carlo trials 105 . We observe from the figure that the result is very similar to the previous case. In this example, the criterion function to be minimized is 5-dimensional. Repeating a grid search in the full dimension and Newton searches from all local minima 105 times is a formidable task for most computers of today. However, as we showed previously, the DOA sidelobe structure remains approximately the same when the other parameters are varied. Therefore, we fixed the values of P1 , P2 , and σ 2 and performed the grid search over u1 and u2 only. We used the sample variances of the actual outcomes of s(t) and n(t) as the fixed values of P1 , P2 , and σ 2 when the DOA grid search was performed. Of course, these values are not known in any practical situation, but our purpose here is to model the fundamental performance limitations of the ML estimator and not to design a practical implementation. Newton-searches 160
10.4. STOCHASTIC MAXIMUM LIKELIHOOD
from all local minima were then performed in the full 5-D space. Concentrated criterion We now turn to the case of the concentrated criterion. The result is shown in Figure 10.10. The number of snapshots was 12 and Monte Carlo trials 105 . In the MSE approximation we used the probabilities in Theorem 10.2 and the CRB for unstructured (besides Hermitian) P given in [SN90b]. In this case, the MSE approximation does not provide an accurate model for the threshold behavior of the concentrated SML estimator. As alluded to previously, this is due to that minimizing the unconcentrated and concentrated ˆ criteria is equivalent only if the estimate of the signal covariance matrix, P, is positive semi-definite. Apparently, this cannot be the case here since the threshold region performance is significantly poorer when using the concentrated criterion. ˆ and two relevant statistics are disWe kept track of all indefinite Ps played in Figure 10.11. The left plot shows the percentage outliers among ˆ An outlier was those DOA estimates that were based on an indefinite P. defined as an estimate outside the mainlobe area. Clearly, almost every time ˆ was obtained, it resulted in an outlier when estimating the an indefinite P DOAs. The right plot shows the percentage indefinite estimates among those outcomes that resulted in a DOA outlier. We observe that about 90% of all ˆ Hence, we conclude that there is a outliers were based on an indefinite P. strong connection between the threshold behavior when using the concenˆ trated criterion and the definiteness of P.
161
CHAPTER 10. ML DOA ESTIMATION OF MULTIPLE SOURCES
V(P1,u1) for fixed u2, P2, and σ2
2
V(P1,P2) for fixed u and σ
40
15
35 14
30 13
25 20
12
15 11
10 10
10 0
10
5
5
5 10
0
0
P
P2
P
1
−1
0
−0.5
0.5
1
u
1
1
V(P1,σ2) for fixed u and P2.
2
V(u ,σ ) for fixed u , P , and P . 1
2
1
2
22 20 200
18
150
16
100
14
50
12
0 2 1
1.5
10 0
0.5 1
5
0 0.5 2
σ
−0.5 0
−1
10 u
P1
1
0
1
0.5
1.5
σ2
Figure 10.4: Different slices of the 5-dimensional unconcentrated stochastic ML criterion function for an example with two sources at u = [−0.1 0.1] and a 4 element MRA; P1 = P2 = 5, σ 2 = 1, N = 20. Top left: V as a function of P1 and P2 for u = [−0.1 0.1], σ 2 = 1. Top right: V as a function of P1 and u1 for u2 = 0.1, P2 = 5, σ 2 = 1. Bottom left: V as a function of σ 2 and u1 for u2 = 0.1, P1 = P2 = 5. Bottom right: V as a function of P1 and σ 2 for u = [−0.1 0.1], P2 = 5.
162
2
10.4. STOCHASTIC MAXIMUM LIKELIHOOD
Analytical Simulation
−1
10
−2
Pn
10
−3
10
−4
10
−5
10
−5
0
5
10
SNR [dB]
Figure 10.5: Pairwise error probability vs SNR per space-time sample for an example with two sources and a 4 element MRA. u0 = [−0.1 0.1], un = [−0.015 0.67], N = 5, σ 2 = 1, SNR = P
CRB MSE approximation simulation −1
MSE of u
10
−2
10
−3
10
−4
10
−10
−5
0 SNR [dB]
5
10
Figure 10.6: MSE vs SNR per space-time sample for an example with two sources and a 4 element MRA; unconcentrated criterion, known P and σ 2 , 12 snapshots.
163
CHAPTER 10. ML DOA ESTIMATION OF MULTIPLE SOURCES
1 0.8 0.6 0.4
2
0.2 u
0
−0.2 −0.4 −0.6 −0.8 −1 −1
−0.5
0 u1
0.5
1
Figure 10.7: The SML criterion function and scatter plot of 105 estimates for an example with two sources and a 4 element MRA; unconcentrated criterion, known P and σ 2 , 12 snapshots, SNR = -1.6 dB.
CRB MSE approx. Simulation −1
MSE of u
10
−2
10
−3
10
−4
10
5
10
15 Number of snapshots
20
25
Figure 10.8: MSE vs number of snapshots per space-time sample for an example with two sources and a 4 element MRA; unconcentrated criterion, known P and σ 2 , SNR = 5 dB.
164
10.4. STOCHASTIC MAXIMUM LIKELIHOOD
CRB MSE approximation Simulation −1
MSE of u
10
−2
10
−3
10
−4
10
−10
−5
0 SNR [dB]
5
10
Figure 10.9: MSE vs SNR per space-time sample for an example with two sources and a 4 element MRA; unconcentrated criterion, uncorrelated signals, unknown P and σ 2 , 12 snapshots.
CRB MSE approximation Simulation
−1
MSE of u
10
−2
10
−3
10
−4
10
−10
−5
0 SNR [dB]
5
10
Figure 10.10: MSE vs SNR per space-time sample for an example with two sources and a 4 element MRA; concentrated criterion, 12 snapshots.
165
CHAPTER 10. ML DOA ESTIMATION OF MULTIPLE SOURCES
Percentage indefinite among outliers 110
100
100
90
90
80
80
70
70
60
60
%
%
Percentage outliers among indefinite 110
50
50
40
40
30
30
20
20
10
10
0 −5
0 SNR [dB]
5
0 −5
0 SNR [dB]
Figure 10.11: Percentage outliers among indefinite estimates of the signal covariance matrix and percentage indefinite signal covariance matrix estimates among the outliers. Concentrated SML estimator.
166
5
10.4. STOCHASTIC MAXIMUM LIKELIHOOD
10A
Proof of Theorem 10.2
To compute the pairwise error probability Pn we will use a result first presented in [Box54] and developed further in [Imh61] and [MP92, Section 4.3b]. Therein the PDF of central, indefinite quadratic forms in real Gaussian variables is derived. In order to use this result, we first need to do some preprocessing to get the model in a form that matches that of the cited references. To this end, we first express the quadratic form in complex variables in (10.61) as a quadratic form in real variables. Assume first that |R0 | < |Rn | and define � � � � Re{y} Re{Ψ} −Im{Ψ} z = , T= . (10A.1) Im{y} Im{Ψ} Re{Ψ} The quadratic form in (10.61) can then be expressed as q � yH Ψy = zT Tz,
(10A.2)
where, now, the random vector z is real. The moments of z are E [z] = 0, (10A.3) � � � 1 Re{IN ⊗ R0 } −Im{IN ⊗ R0 } E zzT = Σ = . (10A.4) 2 Im{IN ⊗ R0 } Re{IN ⊗ R0 } Now, let the eigendecomposition of Σ1/2 TΣ1/2 be Σ1/2 TΣ1/2 = UΓUT .
(10A.5)
The transformation w = UT Σ−1/2 z
(10A.6)
then brings the quadratic form into the canonical form q =
2KN �
γ˜j wj2 ,
(10A.7)
j=1
where γ˜j , j = 1, . . . , 2KN, are the eigenvalues of Σ1/2 TΣ1/2 and wj is the corresponding element in w. The moments of w are E [w] = 0 E wwT = I. �
167
(10A.8) (10A.9)
CHAPTER 10. ML DOA ESTIMATION OF MULTIPLE SOURCES
Thus, the quadratic form has been written as a linear combination of independent χ2 variables. Due to the structure of the quadratic form, some of the eigenvalues will be zero and some will be equal. The quadratic form can then be written as a linear combination of a reduced number of independent χ2 variables with degrees of freedom given by the multiplicity of the corresponding eigenvalue, i.e. q∼
m �
γj χ2αj .
(10A.10)
j=1
Here, γj , j = 1, . . . , m, are the distinct non-zero eigenvalues, αj is the multiplicity of the j-th eigenvalue. Furthermore, χ2n denotes a χ2 random variable with n degrees of freedom, and ∼ means that the left and right hand sides have the same distribution. The result in the above cited references is based on the assumption that all multiplicities of the eigenvalues are even numbers. To show that this is the case for the eigendecomposition in (10A.5) we present the following result, which relates the eigenvalues γj to the eigenvalues of R0 R−1 n . Lemma 10.1 Let di , i = 1, . . . , m, be the distinct eigenvalues of R0 R−1 n that satisfy di = 1, and denote the corresponding multiplicities by ni . Assume that |R0 | < |Rn |. Then, the m distinct, non-zero eigenvalues of Σ1/2 TΣ1/2 are given by γi = (di − 1)/2 and they occur with multiplicities 2N ni . Proof: First, we show the relationship between the eigenvalues of the complex Hermitian matrix Ψ and the real symmetric matrix T. Let ξ be an eigenvalue and e be the corresponding eigenvector of Ψ. Then, by definition, Ψe = ξe
(10A.11)
Re{Ψe} = ξRe{e} Im{Ψe} = ξIm{e},
(10A.12) (10A.13)
so that
since the eigenvalues of Ψ are real (Ψ being Hermitian). We will now show that � � � � Re{e} Im{e} and v2 = (10A.14) v1 = Im{e} −Re{e} 168
10.4. STOCHASTIC MAXIMUM LIKELIHOOD
are both eigenvectors of T of T in (10A.1) we obtain � Tv1 = � = � =
with the same eigenvalue ξ. Using the definition Re{Ψ} −Im{Ψ} Im{Ψ} Re{Ψ}
��
Re{e} Im{e}
�
� Re{Ψ}Re{e} − Im{Ψ}Im{e} Im{Ψ}Re{e} + Re{Ψ}Im{e} � � � Re{Ψe} Re{e} =ξ = ξv1 . Im{Ψe} Im{e}
(10A.15)
A similar calculation shows that Tv2 = ξv2 . Hence, v1 and v2 are eigenvectors of T with eigenvalue ξ. It then follows that T has the same eigenvalues as Ψ, but with double multiplicity. Next, we show the relationship between the eigenvalues of Σ1/2 TΣ1/2 and those of R0 R−1 n . It is easy to show by a similarity transformation that 1/2 1/2 Σ TΣ and ΣT have the same eigenvalues. From (10A.1) and (10A.3) we obtain �� � � 1 Re{IN ⊗ R0 } −Im{IN ⊗ R0 } Re{Ψ} −Im{Ψ} ΣT = Im{Ψ} Re{Ψ} 2 Im{IN ⊗ R0 } Re{IN ⊗ R0 } � � 1 Re{(IN ⊗ R0 )Ψ} −Im{(IN ⊗ R0 )Ψ} = 2 Im{(IN ⊗ R0 )Ψ} Re{(IN ⊗ R0 )Ψ} � � −1 1 Re{IN ⊗ (R0 R−1 n − IK )} −Im{IN ⊗ (R0 Rn − IK )} = . Re{IN ⊗ (R0 R−1 2 Im{IN ⊗ (R0 R−1 n − IK )} n − IK )} (10A.16) The structure of ΣT is therefore the same as that of T (regarding real and imaginary parts). From the previous calculations we can therefore conclude that ΣT has the same eigenvalues as IN ⊗ (R0 R−1 n − IK )/2, but occurring with double multiplicity. The eigenvalues of IN ⊗ (R0 R−1 n − IK )/2 are those − I )/2 occurring with multiplicity N n . Finally, the eigenvalues of (R0 R−1 K i n −1 of R0 Rn − IK are dj − 1, where dj are the eigenvalues of R0 R−1 n . The assertion in the lemma follows. � We are now in the position to apply the result in [MP92, Section 4.3b]. Let the m distinct non-zero eigenvalues of Σ1/2 TΣ1/2 be ordered such that γ1 > . . . > γp > 0 > γp+1 > . . . > γm . The quadratic form can then be written as q ∼ λ1 χ22N n1 + . . . + λp χ22N np − λp+1 χ22N np+1 − . . . − λm χ22N nm (10A.17) 169
CHAPTER 10. ML DOA ESTIMATION OF MULTIPLE SOURCES
where
λi =
γi , i = 1, . . . , p −γi , i = p + 1, . . . , m
(10A.18)
and 2N ni is the multiplicity of γi . From [MP92, Section 4.3b] the PDF of the quadratic form q in (10A.17) is now obtained as � N� ni −1 � m � N ni − 1 N ni −1−β (β) q/2λi q ci e Bi , q < 0, f (q) = β i=p+1 β=0 (10A.19) (β)
where ci and Bi are defined in (10.63) and (10.64), respectively. The PDF for q ≥ 0 is also given in [MP92, Section 4.3b], but we do not need it here since we have arranged the calculations so that we need only integrate the PDF over negative q. The CDF of the quadratic form is now obtained by integrating the PDF. The result is 3 x f (q)dq F (x) = Pr[q ≤ x] = m �
=
ci
i=p+1
−∞ N� ni −1 � β=0
� 3 x N ni − 1 (β) Bi q N ni −1−β eq/2λi dq, β −∞
x < 0. (10A.20)
Using [GR94] 3 ∞
n −µt
t e u
−uµ
dt = e
n � n! k=0
uk
k! µn−k+1
,
u > 0, Re{µ} > 0, (10A.21)
we obtain (10.67). From (10.61), (10A.2), and (10A.20) we have −1 Pn = Pr[q < N log |R0 R−1 n |] = F (N log |R0 Rn |).
(10A.22)
We need to check that log |R0 R−1 n | < 0 since the CDF in (10A.20) is valid only for negative arguments. Since, by assumption, |R0 | < |Rn | it follows immediately that log |R0 R−1 n | = log(|R0 |/|Rn |) < 0. For the case |Rn | < |R0 | we write the pairwise error probability as � �� � �� � −1 ˆ −1 � � R < log R − R R Pn = Pr Tr R−1 0 n 0 n � �� � �� � −1 � −1 ˆ � = 1 − Pr Tr R−1 − R R R < − log R 0 0 n n � �� � −1 = 1 − F −N log �R0 Rn � , (10A.23) where, now, − log |R0 R−1 n | < 0. Otherwise, the only thing that differs in the proof of the |Rn | < |R0 | case is that the eigenvalues of Σ1/2 TΣ1/2 will be � (1 − di )/2. This completes the proof of Theorem 10.2. 170
Chapter
11
Application Examples In this chapter we present two application examples which are concerned with DOA estimation using sparse arrays. The inherently high sidelobes of such arrays make them prone to ambiguities in the estimation. Therefore, analyzing the threshold effect is particularly important for this class of arrays. The examples are edited versions of previously published conference papers, [AE00, Ath01b], and are presented here in two self-contained sections. Since these papers were published before we developed the general analysis presented in the preceding chapters, the focus in this chapter is on lower bounds. However, in the first example we also present an analysis that is similar to the previous one, but is only applicable to a particular array structure.
11.1
DOA Estimation Using Separated Subarrays
The first example is concerned with DOA estimation with a particular class of sparse linear arrays, characterized by two widely separated subarrays. Since a large array aperture is obtained with a small number of elements, this structure can provide very accurate angle estimates at a reasonable cost, but at the expense of near-ambiguities. The fundamental limitations in DOA estimation with this class of arrays are investigated. We evaluate the performance of DOA estimation algorithms and compare with theoretical bounds, taking the effects of near-ambiguities into account. 171
CHAPTER 11. APPLICATION EXAMPLES
11.1.1
Introduction
Sensor arrays are used for DOA estimation in a wide range of applications such as radar, passive sensors for jammer localization, sonar, wireless communications, seismic analysis and medical imaging. The perhaps most important parameter when designing sensor arrays is the array size. Large arrays with many sensors can provide very accurate DOA estimates. The cost of such a system, however, grows with the number of sensors, both in terms of receiver hardware and computational complexity. A way to reduce the cost while maintaining accurate DOA estimates is to reduce the number of sensors without decreasing the array size. In such sparse arrays, the distance between adjacent sensors will exceed half a wavelength of the impinging wavefronts. This will lead to grating lobes, or near-ambiguities, in the array beampattern. These grating lobes may produce large estimation errors if potential ambiguities are not resolved. In order for sparse arrays to be useful for DOA estimation, the probability of unresolved ambiguities must be very low. This can be achieved by careful array design (see, e.g., [VE99]) or by using estimation algorithms that are specifically designed to resolve the potential ambiguities. DOA estimation algorithms designed to resolve ambiguities are often based on a combination of two estimates, one coarse non-ambiguous and one fine ambiguous estimate [Bag89, JR81, LvdVD99, WZ98, ZW00]. The coarse estimate is used to disambiguate the fine estimate to obtain a fine non-ambiguous estimate. Other ways of achieving disambiguation include frequency diversity [Bom00] and multiple target tracking [WT00]. In this example we focus on a particular class of sparse linear arrays. The array is an interferometric-like system composed of two spatially separated subarrays. The distance between the phase centers of the subarrays is D. There is a spatial gap between the subarrays that is very large compared to the usual inter-sensor spacing of half a wavelength, see Figure 11.1. This will lead to a large number of grating lobes in the array beampattern with magnitudes close to the magnitude of the mainbeam. Each subarray is a ULA, with a distance d ≤ λ/2 between adjacent sensors, where λ is the wavelength of the impinging wavefront. One might question the choice of such an array structure. As will be shown later, it is nearly optimal from an estimation point of view when the SNR is high. At low SNR, this geometry is a poor choice, since the high sidelobes will give large errors. However, incorporating implementation and manufacturing aspects, this structure appears attractive for many applications. The regular structure of the subarrays means that they can be mass produced at low cost. These subarrays can then for instance be placed far apart on the hull of a vessel to provide a large baseline for very accurate DOA estimation. Of course, one could use more than two 172
11.1. DOA ESTIMATION USING SEPARATED SUBARRAYS
separated subarrays, which would be good for the disambiguation. However, for simplicity and ease of exposition only the case of two subarrays is considered herein.
Figure 11.1: Array configuration Figure 11.2 shows the array beampattern for two subarrays separated a distance 33λ/2 between the phase centers of the subarrays. There are 4 sensors in each subarray. The shape of the beampattern illustrates the Array beam pattern 20 15 10
0
10
20*log (B) [dB]
5
−5
−10 −15 −20 −25 −30 −1
−0.5
0 u
0.5
1
Figure 11.2: Array beampattern in dB difficulty in using this sensor arrangement for DOA estimation. The narrow 173
CHAPTER 11. APPLICATION EXAMPLES
mainlobe indicates that a high accuracy can be achieved, but the many and high sidelobes indicate a great risk for large errors. The array beampattern is the product of the array factor and the subarray beampattern. The array factor is the beampattern that would result from two isotropic sensors placed at the phase centers of the subarrays. This pattern has grating lobes of identical heights as the mainlobe. The subarrays have the effect of reducing the grating lobes in the overall beampattern by multiplying the array factor with the subarray beampattern. In Chapter 1, a grating lobe was defined as a lobe of the same height as the mainlobe that appears due to spatial aliasing. In this sense, the overall beampattern in Figure 11.2 has no grating lobes, since the sidelobe peaks are slightly lower than the main peak due to multiplication by the subarray pattern. Still, we call these lobes grating lobes since the reason for their appearance is spatial aliasing. If the grating lobes were of exactly the same height as the mainlobe, it would be impossible to resolve the ambiguities without a priori information about the DOA. One way to interpret DOA estimation with an array that has such a structure is that the long baseline between the subarrays gives a very accurate but ambiguous DOA estimate. The individual subarrays can then be used to determine which of the many peaks in the large baseline beampattern that is the correct one. Relation to Previous Work Several authors have treated various, more narrow, aspects of the present problem, either treating performance bounds, or presenting specific algorithms for array structures similar to the one considered here. In [ZS98] the Cram´er-Rao Bound (CRB) was compared with the Weiss-Weinstein Bound (WWB), in [LvdVD99, WZ98, ZW00] estimation algorithms specifically designed to resolve ambiguities were presented, and in [BS01] the Maximum Likelihood (ML) estimator and the Barankin bound were computed for separated subarrays. A recent study on two or more separated subarrays has been reported in [Zat03]. Aim of Present Work The aim of the work presented herein is to explore further the fundamental limitations in ambiguity prone DOA estimation with this particular array structure. To this end, optimal DOA estimation is developed and compared with performance bounds. A simple approximate expression for the ultimate estimation accuracy that can be achieved with this class of arrays is also derived. 174
11.1. DOA ESTIMATION USING SEPARATED SUBARRAYS
11.1.2
Data Model and Problem Formulation
We consider the problem of finding the DOA of a single signal impinging on an array structure as depicted in Figure 11.1. For mathematical convenience we consider estimation of u � sin θ, where θ is defined to be the angle w.r.t. boresight1 of the array. The array output at time t is modeled by the 2K × 1 complex vector x(t) = a(u)s(t) + n(t),
t = 1, . . . , N
(11.1)
where a(u) is a 2K×1 steering vector that models the array response to a unit waveform from direction u, K is the number of sensors in one subarray, N is the number of snapshots, s(t) is the complex amplitude at time t at baseband of the impinging wavefront and n(t) is the noise. The signal s(t) and noise n(t) are assumed independent and they are modeled as white (spatially and temporally), zero mean, circular complex Gaussian random variables with second order moments � (11.2) E |s(t)|2 = S E[n(t)nH (s)] = I δt,s E[n(t)nT (s)] = 0 ∀ t, s
(11.3) (11.4)
where S is assumed to be known. The signal variance S thus corresponds to the Signal-to-Noise-Ratio (SNR) per space-time sample since the noise variance is normalized to unity. Although the assumption that S is known may be unrealistic, we will later find that this is not particularly restrictive in this example. The two subarrays are assumed to be ideal and identical with omnidirectional antenna elements. The subarray steering vectors are then given by T � , a1 (u) = a2 (u) = 1 e−j2πdn u . . . e−j(K−1)2πdn u (11.5) where dn � d/λ is the inter-sensor spacing in units of wavelengths. The steering vector for the whole array is then given by � � a1 (u) , (11.6) a(u) = e−j2πDn u a1 (u) where Dn � D/λ. With these assumptions we obtain the following model for the data covariance matrix � (11.7) R = E x(t)xH (t) = Sa(u)aH (u) + I. 1
Boresight means perpendicular to the array axis.
175
CHAPTER 11. APPLICATION EXAMPLES
The problem considered in �this example is to estimate u = sin θ based on the noisy observations X � x(1) . . . x(N ) . Particular attention is paid to the problem of near ambiguities due to the grating lobes in the array beampattern. First, we seek lower bounds on the estimation error variance that take the effects of near ambiguities into account.
11.1.3
Performance Bounds
This section is concerned with lower bounds on estimation accuracy. It is shown that the CRB is not suitable for predicting the attainable performance of DOA estimation with separated subarrays. Indeed, the CRB would suggest that the variance could be made arbitrarily small just by using a sufficiently large separation. Therefore, other bounds that are available in the literature are applied to the present problem. Both classical and Bayesian bounds are treated, and it is argued that they can be compared with one another under certain circumstances. Classical and Bayesian Mean Square Errors In the following, both classical and Bayesian bounds will be treated. Normally, it makes no sense to compare classical and Bayesian bounds, since the underlying experiments are inherently different. For the problem at hand, however, some circumstances make such a comparison meaningful. These circumstances will be explained in more detail later. We seek lower bounds on the classical MSE 3 � 2 u − u) = (ˆ u − u)2 p(X; u)dX (11.8) CMSE(ˆ u, u) = EX (ˆ and the Bayesian MSE 33 � 2 u − u) = (ˆ u − u)2 p(X, u)dXdu BMSE(ˆ u) = EX,u (ˆ 33 = (ˆ u − u)2 p(X|u)p(u)dXdu
(11.9)
where E denotes expectation and � uˆ is an estimate of u based on the observations X = x(1) . . . x(N ) . The likelihood function p(X; u) is the PDF of X as a function of the deterministic parameter u and p(X, u) is the joint PDF of X and the random parameter u. The density p(X|u) is the PDF of X conditioned on u and p(u) is the prior PDF of the random parameter u. Although p(X; u) and p(X|u) have different interpretations, they will have identical mathematical forms, a fact that we will make use of later on. By 176
11.1. DOA ESTIMATION USING SEPARATED SUBARRAYS
dX we mean dx(1) dx(2) · · · dx(N ). We will also refer to the classical MSE as the local MSE, since it represents the MSE for a particular value of u. Accordingly, the Bayesian MSE will be referred to as the global MSE since it is an average of the local MSE over the prior PDF. Obviously, some constraint must be imposed on the estimator when the bound on the CMSE is considered. Otherwise, the trivial bound of zero would be obtained if we simply let uˆ = u. Usually, bounds on the CMSE are restricted to the class of unbiased estimators. For the DOA estimation problem, an unbiased estimator cannot exist since the parameter support is finite [ZZ69]. However, we have found in simulations that for the cases of interest in this example, the squared bias is very small compared to the variance. Therefore, we will not discuss the issue of bias any further herein. The A Priori Distribution Throughout this chapter, when treating u as random parameter, a uniform prior PDF on [−u0 , u0 ] will be assigned to u. This corresponds to a cosine distribution of the DOA p(θ) =
1 cos θ 2u0
|θ| ≤ arcsin u0
(11.10)
which means that DOAs close to boresight are more likely than DOAs near endfire2 . Although the reason for assigning a uniform prior PDF to u was mathematical convenience rather than physical considerations, some justification can be given. One could e.g. argue that in some applications the array boresight is mechanically aimed at a certain direction where targets are most likely to appear in a given scenario. Another motivation could be that in a practical sensor array the individual sensors usually have a directional beampattern. Although this variation in array gain has not been accounted for in the data model, it can provide justification for the assumed prior distribution. Handling Edge Effects If the inter-sensor spacing is λ/2 and u0 = 1, edge effects may cause troubles in evaluation of the Bayesian MSE. If u is slightly less than +1, it may be estimated as a value slightly greater than -1 due to the cyclical nature of the beampattern. This may cause the estimated MSE to become “unfairly” large. One way to get around this problem is to “unwrap” the estimation error by calculating it modulo-2. This re-definition of the estimation error requires 2
Endfire means parallel to the array axis.
177
CHAPTER 11. APPLICATION EXAMPLES
that the bounds are modified accordingly, see [BB00] for a modification of the Ziv-Zakai bound to this case. We will not take this approach herein. Instead, the problem is avoided by ascertaining that these types of errors never occur. The problem is the nature of exp(−j2πdn u) in the array steering vector when dn u is close to 0.5. Clearly, it is difficult to tell the difference between exp[jπ(1 − �)] and exp[−jπ(1 − �)], where � is a small number, from noisy observations. If the phase error is measured modulo 2π, it will be very small, if not it will be close to 2π. By assuring that dn u never comes close to 0.5, we can avoid this problem. This can be achieved either by letting dn < 0.5, which corresponds to spatial oversampling, or by letting u0 < 1, i.e. constraining the parameter range by the prior PDF. General Optimal Estimation In the classical case, there is no general procedure for finding the minimum variance unbiased estimator. In the Bayesian case however, it is well known [Tre68] that the Minimum MSE (MMSE) estimator is given by the mean of the posterior PDF 3 uˆ = E[u|X] = up(u|X)du. (11.11) The MSE of this estimator is thus a tight lower bound. Since evaluation of this MSE is computationally intractable, a number of bounds which are easier to compute have been reported in the literature. In this chapter we will study the Weiss-Weinstein bound (WWB) which we will compare with other bounds and results from Monte Carlo simulations. The subsequent sections will provide expressions for the Cram´er-Rao, Barankin and Weiss-Weinstein bounds for the problem at hand. The chapter ends with a comparison of these different bounds. The Cram´ er-Rao Bound Two different CRBs will be used to illustrate different modes of operation. Above the ambiguity threshold, the data from the subarrays can be combined (spatially) coherently to obtain DOA estimates based on the full aperture. We call the CRB for this case the coherent CRB and denote it BC . Below the ambiguity threshold, the data from the subarrays can be combined only incoherently. In this case we assume that we have available two independent DOA estimates, one from each subarray, making use only of the subarray aperture. We call the CRB for this case the incoherent CRB and denote it BI . In Appendix 11A it is shown that the coherent and incoherent CRBs are 178
11.1. DOA ESTIMATION USING SEPARATED SUBARRAYS
given by 3(2SK + 1) 3 ≈ 2 2 2 2 (dn (K − 1) + 3Dn ) 4π N KS (d2n K 2 + 3Dn2 ) 3(SK + 1) 3 � 2 �≈ 2 2 = . (11.12) 2 2 2 2 4π dn N SK 3 4π dn N S K K − 1
BC = BI
8π 2 N S 2 K 2
The coherent CRB is thus a factor 1 + 3Dn2 /d2n K 2 lower than the incoherent CRB. If 3Dn2 /d2n K 2 � 1 this factor is 3D2 /L2 where L = Kd is the effective length of a subarray. This means that if the SNR is sufficient for neglecting ambiguity errors, the standard deviation of the estimation error using separated subarrays is reduced by a factor which is proportional to the distance between the subarray phase centers divided by the effective length of one subarray. The Barankin Bound The Barankin bound (BB) for an underwater matched-field processing problem with a model similar to the one considered here has been derived in [TK99]. We use their result adapted to our model. The BB for the classical MSE of any unbiased estimator of u from the data vector x is given by �−1 T � h (11.13) CMSE ≥ BB = h B − 11T where 1 is a column vector of ones and h is the 1 × T row vector � h = u1 − u · · · uT − u ,
(11.14)
where ui , i = 1, . . . , T are referred to as test points. They represent perturbations in the true parameter value u. If the test points are selected judiciously, the number of test points T can be relatively few. The test points should be chosen so as to maximize the right hand side of (11.13) in order to obtain as tight a bound as possible. A common choice is to pick the test points as the parameter values that correspond to ambiguity peaks in the criterion function, see e.g. [MS69]. We therefore choose the test points as the values of u corresponding to the mainlobe and the nearest grating lobes. The original formulation of the BB is actually more general. For details concerning this general form, see [Bar49]. The elements of the B matrix is given by Bij = E [L(X, ui , u)L(X, uj , u)]
i, j = 1, . . . , T,
(11.15)
where L(X, ui , u) is the likelihood ratio L(X, ui , u) =
p(X|ui ) . p(X|u)
179
(11.16)
CHAPTER 11. APPLICATION EXAMPLES
The elements in the B matrix can be shown to be given by [TK99] � Bij =
|R(u)| −1 |R(ui )| · |R(uj )| · |R (ui ) + R−1 (uj ) − R−1 (u)|
�N
which can be simplified to � � � H H 1 + 4SK ˜ ˜ ˜ ˜ ˜H ˜ Bij = 2 + 2(1 + 2SK)Re a ai ai aj aj a (1 + 2SK) � H �2 � H �2 � H �2 �−N ˜ a ˜ i � + �a ˜j � − (1 + 4SK) �a ˜j � ˜ a ˜i a + �a ,
,
(11.17)
(11.18)
where 1 ˜i = a
S a(ui ). 1 + 2SK
(11.19)
The Barankin bound can then be evaluated by substituting (11.18) into (11.13). The Weiss-Weinstein Bound The WWB states that [WW85] BMSE ≥ WWB = hΓ−1 hT , where h is the 1 × T row vector of test points � h = h1 · · · hT
(11.20)
(11.21)
and Γ = E[wwT ],
(11.22)
where wi �
L1/2 (X; u + hi , u) − L1/2 (X; u − hi , u) , E[L1/2 (X; u + hi , u)]
(11.23)
is the i-th element in the T × 1 real random vector w. The likelihood ratio L(X; u + h, u) is given by L(X; u + h, u) �
p(X, u + h) . p(X, u)
180
(11.24)
11.1. DOA ESTIMATION USING SEPARATED SUBARRAYS
The original formulation of the WWB is actually more general. For details concerning this general form, see [WW85]. Again, the test points are chosen from the grating lobe positions in the array beampattern. In [DeL93], the WWB on azimuth and elevation estimation using a general planar array is derived. A slight modification of those calculations gives that the (i, j)-th element in Γ for the problem at hand is given by C(hi , hj ) − C(hi , −hj ) , C(hi , 0)C(hj , 0)
(11.25)
C(hi , hj ) = A(hi , hj )B(hi , hj ).
(11.26)
Γij = 2 where
Here, � A(hi , hj ) =
(2KS)2 1+ 4(2KS + 1)
B(hi , hj ) = 1 −
$ 1−
� % � H �a (hi )a(hj )�2 4K 2
1 max {|hi |, |hj |, |hi − hj |} . 2u0
−N
, (11.27) (11.28)
The Bayesian Cram´ er-Rao Bound The Bayesian CRB requires some regularity conditions which are not satisfied when a uniform prior PDF is assigned to u (the prior PDF is not twice differentiable). However, by smoothing the edges of the uniform distribution one can show [NV94] that the Bayesian CRB approaches the classical CRB at high SNR. We will therefore use the classical CRB when we compare with other bounds and with simulations. Comparison of Bounds In this section, the different bounds described in the previous sections will be compared. As noted in the introduction, comparing classical and Bayesian bounds is usually not meaningful. There are, however, some circumstances in the present study that make such a comparison meaningful. The key is that the local MSE is approximately independent of u. From (11.12) it is seen that the CRB is independent of u. Later on, we will find by simulation that also the optimal Bayesian estimator will have a local MSE which is approximately independent of u, when it is evaluated in the classical sense. By this we mean that the Bayesian philosophy is used to derive the optimal estimator. This estimator is then evaluated in a Monte Carlo simulation as 181
CHAPTER 11. APPLICATION EXAMPLES
if u were deterministic, i.e. u is fixed from trial to trial. The local (classical) MSE is then computed for this particular value of u. This property, that the local MSE is independent of u, means that it does not matter if we evaluate the performance of an estimator in the classical or in the Bayesian sense. To see this, compare the local MSE 3 (11.29) CMSE(ˆ u, u) = (ˆ u − u)2 p(X; u) dX with the global (Bayesian) MSE 33 3 2 BMSE(ˆ u) = (ˆ u − u) p(X|u) p(u) dX du = CMSE(ˆ u, u) p(u) du (11.30) since p(X; u) and p(X|u) have identical mathematical forms. Now, if CMSE(ˆ u, u) is independent of u we obtain 3 BMSE(ˆ u) = CMSE(ˆ u) p(u)du = CMSE(ˆ u). (11.31) Although there might be some philosophical controversy in comparing classical and Bayesian estimators, the above calculations show that the local and global MSEs are the same if the local MSE is independent of the parameter value. Therefore, the MSE of the Bayesian MMSE estimator is also a lower bound on the MSE for the class of classical estimators that have an MSE which is independent of the parameter value. Suppose now that the Bayesian MMSE estimator, when evaluated in the classical sense, has a local MSE which is independent of the parameter value. If this is the case, this estimator is also the MMSE estimator in the classical sense for the class of estimators that have an MSE which is independent of the parameter value. In the next chapter, we will find by simulation that the Bayesian MMSE estimator has a local MSE that is approximately independent of u if the SNR is sufficiently high and if the edge effects discussed in a previous section are neglected. In Figure 11.3, the BB, WWB, the incoherent and coherent CRBs are plotted versus the subarray separation Dn . For small subarray separation, the BB, WWB and coherent CRB coincide. In this region, ambiguity errors have no effect on the bounds. The MSE decreases as the subarray separation increases up to a certain point when ambiguous estimates begin to affect the bounds. We call this point the ambiguity threshold. Beyond this point the MSE starts to increase since ambiguous estimates occur more often. This effect is captured by the BB and WWB, but not by the CRB. At very large 182
11.1. DOA ESTIMATION USING SEPARATED SUBARRAYS
subarray separation, the BB and WWB approach the incoherent CRB. In this region, only the envelope of the array beampattern provides useful information. It is interesting to note that there is indeed an optimal subarray separation that minimizes the MSE. A system that is able to operate just to the left of this threshold is the optimal design and provides a significant reduction of the MSE compared to a standard ULA with corresponding number of sensors. It can also be seen from the figure that the WWB is a much tighter bound than the BB. Therefore, the BB is not considered any further in this chapter. In the next section, the Bayesian MMSE estimator is implemented and its MSE is compared with the WWB in order to investigate the tightness of the WWB. K = 4, N = 20, S = 2, d = 0.5 n
−35 incoherent CRB −40 −45 WWB
MSE [dB]
−50
BB
−55 −60 −65 −70
coherent CRB
−75 10
20
30
40 50 60 D [wavelengths]
70
80
90
100
n
Figure 11.3: Bounds on MSE vs subarray separation
11.1.4
Performance of Estimators
In this chapter, the optimal Bayesian estimator for the problem at hand is derived. We also develop the Maximum A Posteriori (MAP) estimator and show its relation to the classical ML estimator and the conventional beamformer. A simple, approximate expression for the MSE of the MAP estimator is also derived. The performance of the different estimators are evaluated by means of Monte Carlo simulations. This is compared to the performance predicted by the approximation of the MAP MSE and the bounds treated in the previous section. 183
CHAPTER 11. APPLICATION EXAMPLES
Optimal Bayesian Estimation The optimal (in the Bayesian MSE sense) MMSE estimator is given by the mean of the posterior PDF (see e.g. [Tre68]) 3 up(u|X)du (11.32) uˆ = E[u|X] = U
To compute the MMSE estimator, the posterior PDF of the parameter u given the data X is needed. From Bayes’ rule we have p(u|X) =
p(X|u)p(u) p(X|u)p(u) . =3 p(X) p(X|u)p(u)du
(11.33)
U
We assume u has a uniform prior PDF on [−u0 , u0 ] so that p(u) = 1/(2u0 ) for −u0 ≤ u ≤ u0 and p(u) = 0 elsewhere. The posterior PDF then simplifies to p(u|X) = 3
p(X|u) u0
(11.34)
p(X|u)du −u0
The MAP estimator is thus identical in form to the ML estimator when the prior PDF is uniform. It also follows that the MMSE estimator is given by 3 up(X|u)du U 3 uˆMMSE = (11.35) p(X|u)du U
which is recognized as the center of gravity of the conditional density p(X|u). This conditional PDF p(X|u) is in the white Gaussian case given by p(X|u) =
N � t=1
1 π 2K |R|
� exp −xH (t)R−1 x(t)
� N � 1 exp − xH (t)R−1 x(t) = π 2KN |R|N t=1
(11.36)
where |R| denotes the determinant of R. Applying the matrix inversion lemma [L¨ ut96] to (11.7) gives R−1 = I −
S aaH 1 + 2SK 184
(11.37)
11.1. DOA ESTIMATION USING SEPARATED SUBARRAYS
so that N �
ˆ − xH (t)R−1 x(t) = N Tr{R}
t=1
NS ˆ aH Ra 2SK + 1
(11.38)
where Tr{·} denotes the trace of a matrix and N 1 � ˆ R= x(n)xH (n) N n=1
(11.39)
is the sample covariance matrix. To compute the determinant of R we use the rule |IM + AAH | = |IN + AH A| for an M × N matrix A [L¨ ut96]. This gives |R| = |I2K + SaaH | = |1 + SaH a| = 2SK + 1
(11.40)
The conditional density p(X|u) then reduces to �
� ˆ exp −N Tr(R)
�
� 2SKN p(X|u) = 2KN exp V (u) , π (2SK + 1)N 2SK + 1
(11.41)
where V (u) =
ˆ ˆ aH (u)Ra(u) aH (u)Ra(u) = aH (u)a(u) 2K
(11.42)
is the conventional beamformer spectrum. The only quantity in the posterior PDF that depends on u is V (u). Therefore, the ML and MAP estimators are identical to a conventional beamforming estimator in this case. Combining (11.35) and (11.41) we find that the MMSE estimator is given by � 2SKN V (u) du u exp 2SK + 1 U � � = 3 2SKN V (u) du exp 2SK + 1 U 3
uˆMMSE
�
(11.43)
� 2SKN The MMSE estimator is thus given by the center of gravity of exp 2SK+1 V (u) . Notice that the MAP estimator is independent of S, and that the dependence of the MMSE estimator on S is weak if 2SK � 1. The assumption that S is known is therefore not particularly restrictive for the single signal case. 185
CHAPTER 11. APPLICATION EXAMPLES
Performance Evaluation Next, we investigate the performances of the MMSE and MAP estimators, and compare them with the WWB and CRB. First, we show in a simulation example that the local MSE of the MAP and MMSE estimators is approximately independent of u. This was the justification for comparing classical and Bayesian bounds in the previous chapter. Figure 11.4 shows the local MSE for the MAP and MMSE estimators versus u. To avoid the edge effects described previously, the normalized distance between the sensors in a subarray was dn = 0.4. Clearly, the local MSE is independent of u. It should be noted that it is not true that the local MSE is independent of u for very low SNR. As an example of this, consider a case where the SNR is so low that uˆ is uniformly distributed between -1 and 1 irrespective of what the actual true value of u is. Now, if the true value is u = 0 we u2 ] = 1/3. If, however, u = 1 we have that have that E[(ˆ u − 0)2 ] = E[ˆ u2 ] + 1 = 4/3. Therefore, in this case, the local MSE cannot E[(ˆ u − 1)2 ] = E[ˆ be equal to the global MSE. The requirement for the local MSE to be independent of u is that the SNR is sufficiently high so that the estimates come from the mainlobe or its nearest grating lobes. If this is not the case, the estimates obtained are useless anyway, so this is not considered as a practical problem. K = 4, N = 10, S = 2, dn = 0.4 −25 −30 −35
MSE [dB]
−40
MMSE MAP
−45 −50 −55 −60 −65 −1
−0.5
0 u
0.5
1
Figure 11.4: MSE of MAP and MMSE estimators vs u. Figure 11.5 shows the MSE obtained by Monte Carlo simulations as a function of the distance Dn between the phase centers of the two subarrays. 186
11.1. DOA ESTIMATION USING SEPARATED SUBARRAYS
For small subarray separation, it can be seen that CRB and WWB both are tight bounds. Beyond the ambiguity threshold however, there is gap between the WWB and the MSE of the MMSE estimator, which is the greatest lower bound. The WWB is thus not a tight bound in the ambiguity region. Comparing the MSE of the MAP and MMSE estimators we see that they have the same accuracy in the ambiguity free region, and that the difference in the ambiguity region is small. The location of the ambiguity threshold is the same for the MAP and MMSE estimators. The performance of the MAP estimator is thus very close to the performance of the optimal MMSE estimator in the region where a working system would be desired to operate. Since the MAP estimator is equivalent to a conventional beamformer in this case, we conclude that the beamformer, for all practical purposes, is the optimal estimator for this problem. K = 4, N = 20, S = 2, d = 0.5 n
−35
−40
MMSE simulation MAP simulation WWB Coherent CRB
MSE [dB]
−45
−50
−55
−60
−65
−70
5
10
15 20 D [wavelengths]
25
30
n
Figure 11.5: MSE of MAP and MMSE as a function of the distance between the subarray phase centers compared with WWB and CRB
Approximate MSE of the MAP Estimator We have seen that the WWB is not a tight bound. The MSE of the MMSE estimator is a tight bound, but to the author’s knowledge there exists no closed form expression for its computation. It would be desirable to have a simple, closed form expression for this MSE that could provide insights into array design trade-offs without having to resort to time-consuming Monte 187
CHAPTER 11. APPLICATION EXAMPLES
Carlo simulations. We have already noted that the MAP estimator has essentially the same MSE as the MMSE estimator in the region where a working system would be designed to operate. Next, we derive a simple approximation for the MSE of the MAP estimator that accurately predicts the ultimate estimation accuracy that can be achieved with this class of arrays. Although not strictly a lower bound, we will show by simulation that this approximation is accurate enough as a tool for analyzing the fundamental limitations in DOA estimation with separated subarrays. Derivation of the MSE The approach we take is similar to the one reported in [HL00], where an approximate expression for the ML MSE has been derived heuristically for the problem of Doppler frequency estimation of a coherent pulse train. Since the MAP estimator is identical in form to the ML estimator if we assume a uniform prior PDF, this approximation can be applied also to the MAP estimator. One way to interpret the array beampattern in Figure 11.2, is that the MAP (ML, beamformer) criterion function for coherent estimation is modulated by the criterion function for incoherent estimation. The peak of the “incoherent” envelope, or subarray pattern, will determine which of the narrower “coherent” peaks, or grating lobes, that will produce the MAP estimate. Ambiguous estimates will occur when fluctuations in the position of the peak of the subarray pattern cause the global maximum in the overall beampattern to appear at a grating lobe. For large number of snapshots or high SNR, the peak of the subarray pattern is assumed to be distributed according to � � 1 1 2 (11.44) exp − (ˆ u − u0 ) p(ˆ u|u0 ) = √ 2BI 2πBI This is motivated by general ML theory which states that the ML estimator is asymptotically Gaussian distributed with mean equal to the true value and variance equal to the CRB [Tre68]. Since ML, MAP and beamforming all are equivalent estimators in the present problem, this is a reasonable assumption. The probability of choosing the k-th peak in the array beampattern can then be expressed as � � 3 u0 +(2k+1)/2Dn 1 1 2 √ (11.45) exp − (u − u0 ) du Pk = 2BI 2πBI u0 +(2k−1)/2Dn where 1/Dn is the distance between the grating lobes. The numbering of k is such that k = 0 corresponds to the true peak in the array beampattern, 188
11.1. DOA ESTIMATION USING SEPARATED SUBARRAYS
k = 1 corresponds to the first grating lobe to the right of the true peak, etc. These probabilities can be expressed in terms of the complimentary error function according to � � � � (2k + 1) (2k − 1) √ √ − erfc (11.46) Pk = erfc 2Dn BI 2Dn BI where
3 erfc(x) = x
∞
1 2 √ e−t /2 dt 2π
(11.47)
If the true peak is chosen, the MSE is given by the coherent CRB. If the k-th grating lobe is chosen, the contribution to the MSE is approximately (k/Dn )2 . The local MSE is then approximated by a sum of all MSE contributions, weighted by their respective probabilities of occurrence M 2 � 2 k Pk , MSE(ˆ u) ≈ P0 BC + 2 Dn k=1
(11.48)
where M is the number of grating lobes included in the approximation. Since nothing depends on u in (11.48), averaging the local MSE over the prior PDF has no effect. The approximation of the local MSE in (11.48) is therefore also a valid approximation of the global MSE. Interpretation of the MAP MSE The approximation (11.48) provides valuable insights into the nature of the ambiguity effects on the MSE. Figure 11.7 shows the individual terms in (11.48) as a function of the subarray separation. For comparison purposes, the coherent CRB and the total MSE using all terms in (11.48) is included. It can be seen that the contribution of the mainlobe follows essentially the coherent CRB. For large separation, the mainlobe contribution starts to deviate from the CRB. This is due to that the probability of mainlobe estimates becomes appreciably below one. For small subarray separation, there is a good match between the total MSE and the CRB. In this region, there is no contribution from the grating lobes. At the threshold, the first grating lobe starts to give significant contribution and, at wider separation, also the second grating lobe begins to produce ambiguous estimates. Further Simplification of the MAP MSE We are interested in finding a good approximation of the MSE in the vicinity of the threshold. From Figure 11.7 we conclude that only the mainlobe and 189
CHAPTER 11. APPLICATION EXAMPLES
−35 total MSE −40 −45 2nd grating lobe
MSE [dB]
−50 −55 −60 −65 st 1 grating lobe
−70
CRB mainlobe
−75 −80
5
10
15
20
25
30
35
40
45
50
Dn
Figure 11.6: MSE contributions from the mainlobe and different grating lobes. K = 4, N = 20, dn = 0.5, S = 2 the first grating lobe has significant contribution to the total MSE at the threshold. We also note that P0 ≈ 1 in this region. These observations together with the following approximation [Tre68] erfc(x) ≈ √
1 2 e−x /2 2πx
leads to the following expression 1 MSE(ˆ u) ≈ BC +
x > 0,
� � 1 8BI 1 exp − π Dn 8BI Dn2
(11.49)
(11.50)
where BC and BI are given in (11.12). Figure 11.7 shows the approximations in eq. (11.48) and (11.50) labeled Approximation 1 and Approximation 2 respectively. Clearly, the further approximations that took us to (11.50) were reasonable, since there is no visible difference between the two approximations except at large subarray separations. If the approximations are to be used for determining the ambiguity threshold, the simpler approximation in (11.50) is just as accurate as the one in (11.48). The ambiguity threshold can easily be obtained by finding the minimum of (11.50). Included in the plot is also the result from Monte Carlo simulation (also shown in Figure 11.5) of the MAP MSE. The MSE approximations derived are very good at predicting the MSE of the MAP estimator. Since the MAP MSE is very close 190
11.1. DOA ESTIMATION USING SEPARATED SUBARRAYS
K = 4, N = 20, S = 2, dn = 0.5 −35 Approximation 1 Approximation 2 Simulation
MSE [dB]
−40
−45
−50
−55
−60
5
10
15 20 D [wavelengths]
25
30
n
Figure 11.7: Approximations of MAP MSE compared with simulations to the MMSE, we conclude that the approximations derived can be used to predict the ultimate estimation accuracy that can be achieved with this class of arrays. As a last comparison, Figure 11.8 shows the MSE as a function of SNR for a fixed subarray separation. One can discern different SNR regions where the estimates have different nature. At high SNR, there are no unresolved ambiguities and the coherent CRB is reached. There is an ambiguity threshold also in this plot. Below this threshold the MSE increases to the incoherent CRB. At low SNR, only the envelope of the full array beampattern gives useful information. At very low SNR, the data provide no information and the MSE reaches the variance of the prior PDF. In this region, the MSE approximation is not good since the large estimation errors are not caused by grating lobes. The observant reader notes that points for the MMSE estimator are missing at high SNR. This is due to the extremely high dynamic range of the posterior PDF. Double precision in the computations was not sufficient to implement the MMSE estimator at these SNR values.
11.1.5
Conclusions
We have investigated the fundamental limitations in DOA estimation with a sensor array consisting of two spatially separated subarrays. Particular attention was paid to ambiguity errors caused by grating lobes in the ar191
CHAPTER 11. APPLICATION EXAMPLES
K = 4, N = 10, D = 20, d = 0.4 n
0
n
a priori variance
−10
MAP simulation MMSE simulation Approx. MAP MSE
−20
MSE
−30 −40
incoherent CRB
−50 −60 coherent CRB −70 −80 −90 −10
−5
0
5
10 SNR [dB]
15
20
25
30
Figure 11.8: MSE as a function of SNR ray beampattern. It was shown by simulation that the beamformer has essentially the same performance as the optimal MMSE estimator. A simple approximation of the beamformer’s MSE that takes ambiguity errors into account was derived. This approximation provides valuable insights into how different array design parameters affect the attainable estimation accuracy.
11A
Derivation of CRB for separated subarrays
The CRB based on the Gaussian signal model has been derived in [SN90b]. For the case of a single signal this reduces to BC =
1 H −1 2N S 2 dH P⊥ a da R a
(11A.1)
where d=
∂a(θ) ∂u
H H P⊥ a = I − aa /a a = I −
1 aaH 2K
(11A.2)
Taking the derivative of the steering vector in (11.6) w.r.t. θ gives d = −j2πb � a 192
(11A.3)
11.1. DOA ESTIMATION USING SEPARATED SUBARRAYS
where b�a denotes element-wise multiplication of the elements in the vectors b and a and T � b � 0 dn . . . (K − 1)dn Dn Dn + dn . . . Dn + (K − 1)dn (11A.4) Denoting the elements in b by bk we have � T � 2π 2 2 b � aH (b � a) − dH P⊥ a d = 4π K $ 2K %2 2K � 2π 2 � = 4π b2k − bk = K k=1 k=1
�
� bT � aH aaH (b � a)
� � 2π 2 � 2 � 2 K dn K − 1 + 3Dn2 3 (11A.5)
Applying the matrix inversion lemma to (11.7) gives R−1 = I −
S aaH 1 + 2SK
(11A.6)
so that aH R−1 a = 2K −
S 2K aH aaH a = 1 + 2SK 1 + 2SK
(11A.7)
Substituting (11A.5) and (11A.7) into (11A.1) then gives BC =
3(2SK + 1) (d2n (K 2 − 1) + 3Dn2 )
8π 2 N S 2 K 2
(11A.8)
If 2KS � 1 and K 2 � 1 this reduces to BC ≈
4π 2 N KS
3 (d2n K 2 + 3Dn2 )
(11A.9)
The incoherent CRB, BI , is given by the CRB for one subarray divided by two, since it is assumed that two independent estimates are obtained from the two subarrays. Thus, BI =
1 H −1 ⊥ 4N S 2 dH 1 Pa1 d1 a1 R a1
,
(11A.10)
where d1 =
∂a1 (θ) = −j2πb1 � a1 , ∂u 193
(11A.11)
CHAPTER 11. APPLICATION EXAMPLES
and b1 =
�
0 dn . . .
(K − 1)dn
.
(11A.12)
In a similar fashion as for the coherent CRB we obtain %2 $K K 2 � � 2π π 2 d2n K(K 2 − 1) ⊥ 2 dH P d = 4π b − b = 1 1k 1 a1 1k K k=1 3 k=1 (11A.13) and K 1 + KS
(11A.14)
3(SK + 1) � 2 � K −1
(11A.15)
−1 aH 1 R a1 =
so that BI =
4π 2 d2n N S 2 K 2
If 2KS � 1 and K 2 � 1 this reduces to BI ≈
3 4π 2 d2n N SK 3
194
(11A.16)
11.2. OPTIMIZATION OF ELEMENT POSITIONS IN SPARSE ARRAYS
11.2
Optimization of Element Positions in Sparse Arrays
In this example we propose a method for optimizing the element positions in sparse linear arrays. Due to their high sidelobes, sparse arrays are plagued by the threshold effect. It is therefore important to acknowledge this effect in any sparse array design. We propose herein a novel criterion based on the SNR threshold in the Weiss-Weinstein bound (WWB).
11.2.1
Introduction
The DOA estimation accuracy depends to a great extent on the array size. Large arrays can thus provide very accurate estimates. DOA estimation for arrays with many elements are, however, expensive to implement, both in terms of receiver hardware and computational complexity. For non-ambiguous DOA estimation with ULAs, the inter-element spacings should not exceed half a wavelength of the impinging wavefronts. In sparse arrays, elements are spaced further apart in order to obtain a large aperture with few elements. Sparse arrays thus have the potential of very accurate DOA estimation at a low cost. The price paid is the risk of obtaining ambiguous estimates, caused by grating lobes in the array beampattern. To reduce such grating lobes, non-uniform element spacing is employed. An important problem is then to determine which element positions yield the most accurate DOA estimates. Different approaches to optimizing the element positions with respect to DOA estimation accuracy have been taken in the literature. In [AGGS96, GB97], the element positions of non-uniform linear arrays (NULAs) were optimized by minimization of the CRB. A problem with this approach is that the CRB is a local bound that does not take into account large estimation errors caused by near ambiguities. For the single signal problem this means that only the curvature of the mainlobe is considered; high sidelobes have no effect. At low SNR, these sidelobes may cause large estimation errors, rendering the CRB a far too optimistic bound in this case. Various approaches have been proposed to account for near ambiguities. In [VE99] the mainlobe area was minimized subject to a peak sidelobe constraint and in [AS00] competitive criteria involving maximum aperture and identifiability were considered. Although these approaches are intuitively appealing, there is no explicit connection between these ambiguity/aperture trade-offs and the resulting mean square estimation error. In this section, another approach is taken. A lower bound on the mean 195
CHAPTER 11. APPLICATION EXAMPLES
square estimation error that takes ambiguity errors into account is used to optimize the element positions of a NULA with fixed aperture. The bound used is the Weiss-Weinstein Bound (WWB), which was first presented in [WW85] and subsequently applied to DOA estimation in e.g. [Ver87, DeL93, NV94, ZS98, AE00].
11.2.2
Problem Formulation
Consider a linear array of K sensors receiving a single planar wavefront from the DOA θ measured relative to the array boresight. For mathematical convenience, the estimation of u � sin θ is considered. The element positions, denoted by dk , k = 1, . . . , K are normalized by the standard spacing λ/2 where λ is the wavelength, i.e. dk = 2d˜k /λ where d˜k is the physical distance. In the sequel, different linear array geometries, keeping the array length D (normalized by λ/2) fixed, will be studied. Without loss of generality, the end elements d1 and dK are fixed at 0 and D respectively. Assuming an ideal array with omnidirectional elements, the array output at time t can be modeled by the K × 1 complex vector x(t) = a(u)s(t) + n(t),
t = 1, . . . , N
(11A.17)
where a(u) =
�
1 e−jπd2 u . . . e−jπdK−1 u e−jπDu
T
is the K × 1 array steering vector. Furthermore, s(t) denotes the impinging signal at baseband, n(t) is an additive noise term and N denotes the number of temporal snapshots. The signal s(t) and noises n(t) are assumed independent and are modeled as white (spatially and temporally), zero mean, circular complex Gaussian random variables with second order moments � � E |s(t)|2 = SNR and E n(t)nH (t) = I.
(11A.18)
The signal variance is thus equal to the SNR per space-time sample since the noise variance has been normalized to unity. The SNR is further assumed to be known. The problem considered in this example is, given the noisy observations x(t), t = 1, . . . , N , to determine the element positions d2 , . . . , dK−1 that maximize the DOA estimation performance. A crucial issue that is addressed herein is how to define DOA estimation performance when the estimation is prone to ambiguities. 196
11.2. OPTIMIZATION OF ELEMENT POSITIONS IN SPARSE ARRAYS
11.2.3
Optimization Method
The DOA estimation performance is often evaluated by means of the CRB. This bound is relatively easy to compute but is a local bound that does not take into account large errors that may be caused by near ambiguities. Various global bounds have been proposed in the literature. These are more tedious to compute but, on the other hand, they provide insights into how ambiguity errors affect the overall estimation error. One such bound is the Weiss-Weinstein Bound (WWB) [WW85]. This is a lower bound on the Mean Square Error (MSE) that rests on the Bayesian framework of estimation. This means that the parameter of interest is considered to be a random variable with known prior distribution. Throughout this section, a uniform distribution on [−1, 1] is assigned to u. For details concerning the computation of the WWB for DOA estimation, see [DeL93]. To illustrate the difference between the WWB and the CRB, Figure 11.9 shows the CRB and WWB as a function of SNR for a particular NULA with 8 elements3 . At high SNR, the WWB and CRB coincide since, in this region, ambiguous estimates do not occur. Below a certain SNR threshold the WWB increases rapidly. At this threshold, ambiguous estimates from grating lobes begin to yield contribution to the total MSE which is comparable to that of the mainlobe. This threshold effect is not captured by the CRB. There are two main factors to consider when deciding upon an optimization criterion. On the one hand, the elements should be spread out as much as possible in order to get the lowest possible CRB. This implies good accuracy at high SNR. On the other hand, such a design will have a high SNR threshold. Since the array length is fixed, the difference in the CRB for different arrays will be relatively small. Therefore, we focus mainly on the SNR threshold. The basic ideas behind the optimization procedure are as follows: 1. Generate a large number of different arrays with random element positions. 2. Compute the WWB as a function of SNR for each array. 3. Identify a reduced set of arrays with the lowest SNR thresholds. 4. The element positions of these arrays are used as starting points in a numerical optimization routine to improve the best arrays from the previous step. 3
Since the WWB is a Bayesian bound, a direct comparison with the CRB is not meaningful in general. However, according to the discussion in Section 11.1.3, such a comparison can be justified in this case.
197
CHAPTER 11. APPLICATION EXAMPLES
d = [0 1 2 11 15 18 21 23], N = 16 0 CRB WWB −10
MSE of u [dB]
−20
−30
−40
−50
−60
−70 −20
−15
−10
−5 SNR [dB]
0
5
10
Figure 11.9: CRB and WWB as a function of SNR for a NULA. 5. The optimal element positions are then taken from the best array after the numerical optimization. The SNR threshold can be defined in different ways, e.g. where the WWB exceeds the CRB by a certain amount or the maximum of the second derivative of the WWB curve. Unfortunately, we do not have an analytical expressions for the SNR threshold available. Furthermore, importance was attached to analyzing as many random arrays as possible within a limited computing time. Therefore, a somewhat simplified procedure was implemented: • The WWB as a function of SNR was computed for 103 different arrays. The array with the lowest SNR threshold of these arrays was identified simply by looking at the plots of the WWB versus SNR. This array had a threshold at about SNR = -5 dB. Then, the WWB at SNR = −5 dB was computed for 106 random arrays. • The 10 arrays with the lowest WWB at SNR = - 5 dB were selected for numerical optimization. • The element positions of these arrays were used as starting points when minimizing the WWB with respect to element positions at SNR = -5 dB. The “fminsearch” routine in Matlab’s Optimization Toolbox was used for this purpose. • The array with the lowest WWB after the numerical optimization was then considered to be the optimal array. 198
11.2. OPTIMIZATION OF ELEMENT POSITIONS IN SPARSE ARRAYS
q
A side-effect of this pragmatic approach is that we actually minimize the WWB for a fixed SNR and not the SNR threshold itself. However, since this fixed SNR is close to the threshold of the “best” array, we consider this an almost equivalent approach. In a way, it is a desired side-effect since we assure that we obtain also a low MSE; not just a low threshold. There is no guarantee that the global optimum is found with this procedure. If a very large number of random arrays are generated, however, it is likely that the obtained solution is “sufficiently optimal” for any practical purposes. The optimization procedure was evaluated by generating 106 eight-element linear arrays with random element positions and D = 23, N = 16. The element positions were generated according to a uniform distribution on [0, D]. Figure 11.10 shows the WWB as a function of SNR for the arrays which had the lowest and highest WWB at SNR = -5 dB. In order to show the
Histogram of WWB at SNR = - 5 dB
Figure 11.10: WWB for the best and worst array and a histogram of WWB at SNR = -5 dB. statistical nature of the WWB of the randomly generated arrays, there is also a histogram of the WWB at SNR = -5 dB for all the arrays in the plot. The histogram has been rotated 90◦ compared to the standard orientation of a histogram. It can be seen from the figure that the difference between the WWB for the best and the worst array is quite large. The positions of the array elements thus have a great influence on the attainable estimation performance. The element positions of the 10 best arrays were then used as starting points in a numerical optimization routine to minimize the MSE 199
CHAPTER 11. APPLICATION EXAMPLES
at SNR = -5 dB. Finally, the optimal element positions are taken from the array with the lowest MSE at this SNR. The numerical optimization reduced the minimum MSE from -44.8 dB to -45.2 dB. Hitherto, the element positions were considered as continuous variables. This implies an infinite number of possible arrays with different element positions. On the other hand, constraining the element positions to a discrete grid leads to a finite number of possible different arrays. Therefore, it should be possible to compute the WWB for all these possible arrays if the number of grid points and array elements are not too large. A common approach is to start with a ULA with λ/2 element spacing and the required length. Then, a given number of elements are removed from the full array in order to produce the sparse array. These arrays are often called thinned arrays. In the present example, the two end elements are fixed. Thus, there are 22 element positions to choose 6 positions from. �22� The number of different ways to pick 6 elements out of 22 is equal to 6 = 74 613. This is a reasonable number of arrays for being able to compute the WWB for all of these arrays on a standard PC. The WWB at SNR = -5 dB was computed for all these 74 613 arrays and the result is illustrated in Figure 11.11. The WWB vs 0 continuous discrete −10
WWB of u = sinθ [dB]
−20
−30
−40
−50
−60
−70 −20
−15
−10
−5 SNR [dB]
0
5
10
Figure 11.11: WWB for the best array using continuous and discrete element positions respectively. SNR for the arrays with the lowest WWB at SNR = -5 dB using continuous and discrete positions respectively is shown. Clearly, the difference between the two is insignificant. 200
11.2. OPTIMIZATION OF ELEMENT POSITIONS IN SPARSE ARRAYS
11.2.4
Comparison with other arrays
The arrays obtained from the optimization procedure described in the previous section were compared with a couple of other array configurations that have been studied in the literature. For such a comparison to be fair, all arrays had the same length and the same number of elements. A type of thinned array that has been widely studied is the so called minimum redundancy array [Mof68]. Another array configuration that also has been studied is two separated subarrays where each subarray is a ULA with λ/2 interelement spacing, see e.g. [ZS98, BS01, ES02, Zat03] and Section 11.1. The array geometry that minimizes the CRB for one source and NULAs with fixed length is given by two point clusters at the array end points [GB97]. Due to mutual coupling effects and mechanical considerations, the element spacing cannot be too small. The separated subarrays configuration can thus be viewed as a realizable approximation of the CRB-optimal geometry. Figure 11.12 shows the element positions for the arrays under consideration. The beampatterns of the minimum redundancy array and the optimal thinned array are compared in Figure 11.13. Optimized array, continuous positions
Optimized array, discrete positions
Minimum redundancy array
Separated subarrays
0
1
2
3
4
5
6
7
8
9 10 11 12 13 14 15 16 17 18 19 20 21 22 23
Element positions [λ/2]
Figure 11.12: Element positions In Figure 11.14, the WWB of the best thinned array obtained from the numerical optimization is compared with the WWB of a minimum redundancy array. There is practically no difference between the WWB for the two arrays. Recall that the difference between the WWB for the arrays obtained from minimization over continuous and discrete element positions respectively was very small. Therefore, it is concluded that the minimum redundancy array is nearly optimal under the criterion used in this example. Figure 11.15 shows WWB vs SNR for the array obtained from optimiza201
CHAPTER 11. APPLICATION EXAMPLES
Optimized array, discrete positions 20
15
15
10
10
Beampattern [dB]
Beampattern [dB]
Minimum redundancy array 20
5
0
5
0
−5
−10 −1
−5
−0.5
0 u=sin θ
0.5
1
−10 −1
−0.5
0 u=sin θ
0.5
1
Figure 11.13: Array beampatterns
tion over continuous element positions and the separated subarray structure. The separated subarray structure has a considerably higher SNR threshold and somewhat lower WWB at high SNR as compared to the optimal array. This is expected, since the separated subarray structure has a narrower mainlobe but higher sidelobes, due to concentration of the elements near the array endpoints. Common engineering practice suggests that low sidelobes are important for ambiguity-free DOA estimation. In order to investigate the adequacy of this in the current setting, Figure 11.16 displays a 2-D histogram of the WWB at SNR = -5 dB and the peak sidelobe in the beam pattern for each of the 106 arrays as a contour plot. Some interesting conclusions can be drawn from Figure 11.16. For most arrays, high peak sidelobe means high WWB. A few ridges can be discerned in the contour plot. These are probably due to the peak sidelobe being at different distances from the mainlobe. An ambiguous estimate from a sidelobe far from the mainlobe gives a greater contribution to the MSE than from a sidelobe close to the mainlobe. A interesting property appears if we scrutinize the lowest contour of the histogram. Apparently, if only the best arrays are considered, there seems to be no relationship between the peak sidelobe and the WWB, at least as long as the peak sidelobe does not exceed -3 dB (relative to the mainlobe). Inspection of the corresponding beampatterns revealed that for the arrays with low WWB and high peak sidelobe, the peak sidelobe is relatively close to the mainlobe. Obviously, as far as the MSE is concerned, a higher peak sidelobe can be tolerated if it is close to the mainlobe. 202
11.2. OPTIMIZATION OF ELEMENT POSITIONS IN SPARSE ARRAYS
0 minimum redundancy array discrete −10
WWB of u = sinθ [dB]
−20
−30
−40
−50
−60
−70 −20
−15
−10
−5 SNR [dB]
0
5
10
Figure 11.14: WWB for minimum redundancy array and the best thinned array.
11.2.5
Conclusions
A novel criterion for optimizing the element positions of sparse linear arrays has been presented. The criterion used was the ambiguity threshold of the Weiss-Weinstein Bound (WWB). This is a lower bound on the mean square DOA estimation error that takes into account large errors caused by ambiguities. An optimization procedure was implemented in order to find the array with lowest ambiguity threshold. The WWB for this array was compared with a minimum redundancy array and a separated subarrays structure. It was found that the optimal array and the minimum-redundancy array had nearly identical WWB.
203
CHAPTER 11. APPLICATION EXAMPLES
0 Optimized array, continuous positions Separated subarrays −10
WWB of u = sinθ [dB]
−20
−30
−40
−50
−60
−70 −20
−15
−10
−5 SNR [dB]
0
5
10
Figure 11.15: WWB for optimized array, continuous positions and separated subarrays respectively.
−15
WWB at SNR = −5 dB
−20
−25
−30
−35
−40
−7
−6
−5 −4 −3 −2 Peak sidelobe relative mainlobe [dB]
−1
Figure 11.16: 2-D histogram of WWB at SNR = -5 dB and peak sidelobe, displayed as a contour plot.
204
Chapter
12
Conclusions In the second part of this thesis we have developed a theory for predicting the threshold region performance of the ML DOA estimator. We treated the cases of deterministic and stochastic source signals for the single and multisource estimation problems. Approximations of the MSE and probability of outlier were derived for the different cases of interest. Results of Monte Carlo simulations showed that these approximations could accurately predict the threshold region performance of the ML estimator. The MSE approximation is based on a simple application of the total probability theorem. The difficulties arise when the probabilities of ambiguous estimates are to be computed. We found that these calculations can be treated in a common framework, since in all cases the calculations lead to computing the distribution of quadratic forms in complex Gaussian random variables. Closed form expressions for these probabilities were obtained, as well as fast and accurate approximations for cases when these expression were not practical to implement. As compared to Monte Carlo simulations, the analysis developed herein is a time-efficient alternative to evaluate the ML performance. For the special case of a single stochastic source signal and a single snapshot, we showed that the ML estimator is not statistically efficient as SNR → ∞ due to the effect of outliers. Furthermore, results of Monte Carlo simulations indicated that this is also the case for multiple snapshots. However, in this case the inefficiency is due to the local errors not being small enough to reach the CRB. We also presented two examples concerning DOA estimation with sparse arrays. In the first example we studied an interferometric-like system composed of two separated subarrays. We derived the Bayes-optimal estimator for this problem and compared it to other estimators as well as lower bounds 205
CHAPTER 12. CONCLUSIONS
on the estimation performance. We found that the conventional beamformer, the ML, and the Bayesian MAP and MMSE estimators had essentially the same performance in this example. A simple expression for the MSE of the MAP estimator was then derived. This was shown to be in good agreement with results of Monte Carlo simulations. In the second example we used the Weiss-Weinstein lower bound to optimize the element positions of sparse linear arrays. By minimizing the lower bound on the MSE close to the SNR threshold we obtained an array configuration that has high asymptotic estimation accuracy and yet is robust to ambiguity errors. The array obtained from the optimization was compared with a minimum redundancy array with the same length and the same number of elements. We found that these arrays have nearly identical WeissWeinstein lower bounds. We have identified some topics for future research. Our observation that the stochastic ML estimator appears to be statistically inefficient for high SNR needs to be verified analytically. We have only showed it for the special case of a single source and a single snapshot. The theory for the multisource stochastic ML estimator can be developed further. In particular, the probabilities associated with the concentrated likelihood function remains to be computed. The quest for tight and computable lower bounds on estimation accuracy is still ongoing. It would be interesting if some connections between existing bounds and the approximations developed herein could be established. Maybe this could lead to new insights and improved bounds. Finally, it would be interesting to apply the MSE approximations to the problem of optimizing the element positions in sparse arrays. In particular, an optimization criterion involving the capability of resolving two sources would be interesting to investigate.
206
Bibliography
[AE00]
F. Athley and C. Engdahl. “Direction-of-Arrival Estimation Using Separated Subarrays”. In Proc. 34th Asilomar Conf. Signals, Syst., Comput., 2000.
[AGGS96] Y. I. Abramovich, D. A. Gray, A. Y. Gorokhov, and N. K. Spencer. “Comparison of DOA Estimation Performance for Various Types of Sparse Antenna Array Geometries”. In Proceedings of EUSIPCO-96, 1996. [AS00]
Y. I. Abramovich and N. K. Spencer. “Design of Nonuniform Linear Antenna Array Geometry and Signal Processing Algorithm for DOA Estimation of Gaussian Sources”. Digital Signal Processing, 10(4):340–54, October 2000.
[Asy98]
Asym P. Tomaniac, a.k.a. P. Stoica. “Asymptomania?”. IEEE Signal Processing Magazine, 15(1):16, Jan. 1998.
[Ath99]
F. Athley. “Asymptotically Decoupled Angle-Frequency Estimation with Sensor Arrays”. In Proc. 33:rd Asilomar Conf. on Signals, Systems and Computers, Pacific Grove, CA, USA, 1999.
[Ath01a]
F. Athley. “Angle and Frequency Estimation Using Sensor Arrays”. Technical Report No. 370L (Lic. thesis), Chalmers University of Technology, G¨oteborg, Sweden, Feb. 2001.
[Ath01b]
F. Athley. “Optimization of Element Positions for Direction Finding with Sparse Arrays”. In Proc. 11th IEEE Signal Processing Workshop on Statistical Signal Processing, Singapore, 2001.
[Ath02a]
F. Athley. “Performance Analysis of DOA Estimation in the Threshold Region”. In Proc. ICASSP 2002, Orlando, FL, USA, 2002. 207
BIBLIOGRAPHY
[Ath02b]
F. Athley. “Threshold Region Performance of Deterministic Maximum Likelihood DOA Estimation of Multiple Sources”. In Proc. 36th Asilomar Conf. on Signals, Systems and Computers, Pacific Grove, CA, USA, 2002.
[Ath02c]
F. Athley. “Threshold Region Performance of Maximum Likelihood DOA Estimation for a Single Source”. In Proc. 10th Annual Workshop on Adaptive Sensor Array Processing, MIT Lincoln Lab., Lexington, MA, USA, 2002.
[AVE]
F. Athley, M. Viberg, and J. Eriksson. “High-Resolution SpaceTime Signal Processing for Radar”. In Y. Hua, A. Gershman, and Q. Cheng, editors, High-Resolution and Robust Signal Processing. Dekker, New York, NY, USA. To be pubslihed.
[Bag89]
E. J. Baghdady. “Hybrid Interferometry for High-Resolution DOA Measurement”. In Proc. IEEE National Aerospace Electronics Conf., 1989.
[Ban71]
W. J. Bangs. Array Processing with Generalized Beamformers. PhD thesis, Yale University, New Haven, CT, 1971.
[Bar49]
E. W. Barankin. “Locally Best Unbiased Estimates”. Ann. Math. Statist., 20:477–501, 1949.
[Bar88]
D. K. Barton. Modern Radar System Analysis. Artech House, Norwood, 1988.
[BB00]
S. Basu and Y. Bresler. “A Global Lower Bound on Parameter Estimation Error with Periodic Distortion Functions”. IEEE Transactions on Information Theory, 46(3):1145–50, 2000.
[Bel95]
K. L. Bell. Performance Bounds in Parameter Estimation with Application to Bearing Estimation. PhD thesis, George Mason University, Fairfax, VA, 1995.
[Ben93]
G. R. Benitz. “Asymptotic Results for Maximum Likelihood Estimation with an Array of Sensors ”. IEEE Trans. on Information Theory, 39(4):1374–1385, July 1993.
[BET96]
K. L. Bell, Y. Ephraim, and H. L. Van Trees. “Explicit Ziv-Zakai Lower Bound for Bearing Estimation”. IEEE Transactions on Signal Processing, 44(11):2810–2824, Nov. 1996. 208
BIBLIOGRAPHY
[B¨oh84]
J.F. B¨ohme. “Estimation of Source Parameters by Maximum Likelihood and Nonlinear Regression”. In Proc. ICASSP 84, pages 7.3.1–7.3.4, 1984.
[B¨oh86]
J. F. B¨ohme. “Estimation of Spectral Parameters of Correlated Signals in Wavefields”. Signal Processing, 11:329–337, 1986.
[B¨oh95]
J. F. B¨ohme. Statistical array signal processing of measured sonar and seismic data. In Proc. SPIE, The International Society for Optical Engineering, volume 2563, San Diego, 1995.
[Bom00]
K. Boman. “Low-Angle Estimation: Models, Methods and Bounds”. Technical Report Lic. Thesis, Uppsala University, 2000.
[Box54]
G. E. P. Box. “Some Theorems on Quadratic Forms Applied in the Study of Analysis of Variance Problems, I. Effect of Inequality of Variance in the One-way Classification”. Ann. Math. Statist., 25:290–302, 1954.
[Bra62]
R. N. Bracewell. Radio astronomy techniques. In Handbuch der Physik, pages 42–129. Springer, Berlin, 1962.
[Bre61]
L. E. Brennan. “Angular Accuracy of a Phased Array Radar”. In IRE Trans. on Antennas and Propagation, pages 268–275, 1961.
[Bre78]
J. W. Brewer. “Kronecker Products and Matrix Calculus in System Theory”. IEEE Trans. on Circuits and Systems, 25(9):772– 781, Sept. 1978.
[Bre88]
Y. Bresler. “Maximum Likelihood Estimation of Linearly Structured Covariance with Application to Antenna Array Processing”. In Proc. 4th ASSP Workshop on Spectrum Estimation and Modeling, pages 172–175, Minneapolis, MN, Aug. 1988.
[BS01]
K. Boman and P. Stoica. “Low Angle Estimation: Models, Methods, and Bounds”. Digital Signal Processing, 11:35–79, 2001.
[Cap69]
J. Capon. “High Resolution Frequency Wave Number Spectrum Analysis”. Proc. IEEE, 57:1408–1418, 1969.
[Car88]
B. D. Carlson. “Covariance Matrix Estimation Errors and Diagonal Loading in Adaptive Arrays”. IEEE Trans. on Aerospace and Electronic Systems, 24(4):397–401, July 1988. 209
BIBLIOGRAPHY
[CF02]
G. Cohen and J. M. Francos. “Least squares estimation of 2-D sinusoids in colored noise: asymptotic analysis ”. IEEE Trans. on Information Theory, 48(8):2243–2252, Aug. 2002.
[CH96]
Q. Cheng and Y. Hua. “Detection of Two-Dimensional Frequencies”. In Proc. ISSPA, Bisbane, Australia, 1996.
[Cla93]
M. P. Clark. “Cramer-Rao bounds for Two-Dimensional Deterministic Modal Analysis”. In Proc. 27th Asilomar Conf. on Signals, Systems and Computers, Pacific Grove, CA, USA, 1993.
[Cox73]
H. Cox. “Resolving Power and Sensitivity to Mismatch of Optimum Array Processors”. Journal of the Acoustical Society of America, 54(3):771–785, Sept. 1973.
[Cra46]
H. Cram´er. Mathematical Methods of Statistics. Princeton University Press, Princeton, NJ., 1946.
[Dan54]
H. E. Daniels. “Saddlepoint Approximations in Statistics”. Annals of Mathematical Statistics, 25:631–650, 1954.
[DeL93]
D. F. DeLong. “Use of the Weiss-Weinstein Bound to Compare the Direction-Finding Performance of Sparse Arrays”. Technical Report TR-982, MIT Lincoln Lab., Aug. 1993.
[DL97]
H. Dropkin and C. Ly. “Superresolution for Scanning Antenna”. In IEEE National Radar Conference, Syracuse, NY, USA, 1997.
[DM84]
D. E. Dudgeon and R. M. Merserau. Multidimensional Digital Signal Processing. Prentice-Hall, Englewood-Cliffs, NJ, 1984.
[DN02]
A. Dogandˇzi´c and A. Nehorai. “Space-Time Fading Channel Estimation and Symbol Detection in Unknown Spatially Colored Noise”. IEEE Transactions on Signal Processing, 50(3):457–474, March 2002.
[DS83]
J.E. Dennis and R.B. Schnabel. Numerical Methods for Unconstrained Optimization and Nonlinear Equations. Prentice Hall, Englewood Cliffs, NJ., 1983.
[Eri01]
J. Eriksson. Multiple signal detection under a false alarm constraint. In Proc. ICASSP, Salt Lake City, USA, 2001. 210
BIBLIOGRAPHY
[Eri02]
J. Eriksson. On Detection and Estimation of Multiple Sources in Radar Array Processing. PhD thesis, Chalmers University of Technology, G¨oteborg, Sweden, March 2002.
[ES02]
C. Engdahl and P. Sunnergren. “Model-based Adaptive Detection and DOA Estimation Using Separated Sub-arrays ”. In Proc. 2002 IEEE Radar Conference, Long Beach, CA, USA, 2002.
[Far92]
A. Farina. Antenna-Based Signal Processing Techniques for Radar Systems. Artech House, Boston, 1992.
[Fis22]
R. A. Fisher. “On the Mathematical Foundations of Theoretical Statistics”. Phil. Trans. Royal Soc., 222, 1922.
[Ful96]
W. A. Fuller. Introduction to Statistical Time Series. Wiley, New York, 2nd edition, 1996.
[GB97]
A. B. Gershman and J. F. B¨ohme. “A Note on Most Favorable Array Geometries for DOA Estimation and Array Interpolation”. IEEE Signal Processing Letters, 4(8):232–5, August 1997.
[Goo63]
N.R. Goodman. “Statistical Analysis Based on a Certain Multivariate Complex Gaussian Distribution (An Introduction)”. Annals Math. Stat., Vol. 34:152–176, 1963.
[GP73]
G. H. Golub and V. Pereyra. “The Differentiation of Pseudoinverses and Nonlinear Least Squares Problems whose Variable Separate”. SIAM Journal of Numerical Analysis, 10(2):413–432, April 1973.
[GR94]
I. S. Gradshteyn and I. M. Ryzhik. Table of Integrals, Series, and Products. Academic Press, Inc., Boston, fifth edition, 1994.
[GS92]
G. R. Grimmett and D. R. Stirzaker. Probability and Random Processes. Oxford Science Publications, Oxford, second edition, 1992.
[Hay95]
S. Haykin, editor. Advances in Spectrum Analysis and Array Processing, volume I-III. Prentice-Hall, 1991-1995.
[Hel86]
C.W. Helstrom. “Calculating Error Probabilities for Intersymbol and Cochannel Interference”. IEEE Trans. Commun., COM34(5):430–5, 1986. 211
BIBLIOGRAPHY
[HGC]
Y. Hua, A. Gershman, and Q. Cheng, editors. High-Resolution and Robust Signal Processing. Dekker, New York, NY, USA. To be pubslihed.
[HL00]
S. D. Howard and P. Lavoie. “Analysis of SNR Threshold for Differential Doppler Frequency Measurement in Digital Receivers”. In Proc. ICASSP 2000, Istanbul, Turkey, 2000.
[HLE93]
S. Haykin, J. Litva, and T. J. Shepherd (Eds.). Radar Array Processing. Springer-Verlag, Berlin, 1993.
[HRKV92] S. Haykin, J. P. Reilly, V. Kezys, and E. Vertatschitsch. “Some Aspects of Array Signal Processing”. IEE Proceedings-F, 139(1):1–26, February 1992. [HS92]
S. Haykin and A. Steinhardt, editors. Adaptive Radar Detection and Estimation. John Wiley & Sons, Inc, New York, 1992.
[Hua92]
Y. Hua. “Estimating Two-Dimensional Frequencies by Matrix Enhancement and Matrix Pencil”. IEEE Trans. on Signal Processing, 40(9):2267–2280, September 1992.
[Imh61]
J. P. Imhof. “Computing the Distribution of Quadratic Forms in Normal Variables”. Biometrika, 48(3/4):419–426, 1961.
[JD93]
D. H. Johnson and D. E. Dudgeon. Array Signal Processing. Concepts and Techniques. Prentice-Hall, Inc., Englewood Cliffs, NJ, 1993.
[JK70]
N. L. Johnson and S. Kotz. Distributions in Statistics: Continuous Univariate Distributions - 2. Wiley, New York, 1970.
[JR81]
E. Jacobs and E. W. Ralston. “Ambiguity Resolution in Interferometry”. IEEE Trans. on Aerospace and Electronic Systems, 17(6):766–780, Nov. 1981.
[Kau75]
L. Kaufman. “A Variable Projection Method for Solving Separable Nonlinear Least Squares Problems”. BIT, 15:49–57, 1975.
[Kay80]
S. M. Kay. Modern Spectral Estimation: Theory and Application. Prentice-Hall, Englewood-Cliffs, NJ, 1980.
[Kay93]
S. M. Kay. Fundamentals of Statistical Signal Processing. Vol. 1 Estimation Theory. Prentice Hall, Upper Saddle River, N.J., 1993. 212
BIBLIOGRAPHY
[Kay98]
S. M. Kay. Fundamentals of Statistical Signal Processing. Vol. 2 Detection Theory. Prentice Hall, Upper Saddle River, N.J., 1998.
[Kle98]
R. Klemm. Space-Time Adaptive Processing: Principles and Applications. IEE, London, 1998.
[KM96]
D. Kundu and A. Mitra. “Asymptotic Properties of the Least Squares Estimates of 2-D Exponential Signals”. Multidimensional Systems and Signal Processing, 7:135–150, 1996.
[KN01]
D. Kundu and S. Nandi. “On Asymptotic Properties of a Two Dimensional Frequency Estimator”. Communications in Statistics — Theory and Methods, 30(8&9):1561–1577, July 2001.
[Kuo99]
D. Kuonen. “Saddlepoint Approximations for Distributions of Quadratic Forms in Normal Variables”. Biometrika, 86(4):929– 935, 1999.
[KV96]
H. Krim and M. Viberg. “Two Decades of Array Signal Processing Research: The Parametric Approach”. IEEE Signal Processing Magazine, 13(4):67–94, July 1996.
[Leh83]
E.L. Lehmann. Theory of Point Estimation. John Wiley & Sons, New York, 1983.
[LHSV95]
J. Li, B. Halder, P. Stoica, and M. Viberg. “Computationally Efficient Angle Estimation for Signals with Known Waveforms”. IEEE Trans. on Signal Processing, 43(9):2154–2163, Sep. 1995.
[Lju99]
L. Ljung. System Identification. Theory for the User. Prentice Hall, Upper Saddle River, N.J., 2nd edition, 1999.
[LL66]
Y. T. Lo and S. W. Lee. “A Study of Space-Tapered Arrays”. IEEE Trans. on Antennas and Propagation, 14(1):22–30, Jan. 1966.
[LR93]
J. Li and R. T. Compton, Jr. “Maximum Likelihood Angle Estimation for Signals with Known Waveforms”. IEEE Trans. on Signal Processing, 41(9):2850–2862, Sep. 1993.
[LST93]
D. A. Linebarger, I. H. Sudborough, and I . G. Tollis. “Difference Bases and Sparse Sensor Arrays”. IEEE Trans. on Information Theory, 39(2):716–721, March 1993. 213
BIBLIOGRAPHY
[LSZ96]
J. Li, P. Stoica, and D. Zheng. “An Efficient Algorithm for TwoDimensional Frequency Estimation”. Multidimensional Systems and Signal Processing, 7:151–178, April 1996.
[L¨ ut96]
H. L¨ utkepohl. Handbook of Matrices. Wiley, 1996.
[LvdVD98] A. N. Lemma, A. J. van der Veen, and E. F. Deprettere. “Joint Angle-Frequency Estimation Using Multi-Resolution ESPRIT”. In Proc. ICASSP 98, 1998. [LvdVD99] A. N. Lemma, A. J. van der Veen, and E. F. Deprettere. “Multiresolution ESPRIT Algorithm”. IEEE Trans. on Signal Processing, 47(6):1722–1726, Jun. 1999. [LZS93]
J. Li, D. Zheng, and P. Stoica. “Angle and Waveform Estimation Via RELAX”. IEEE Trans. on Aerospace and Electronic Systems, 33(3):1077–1087, July 1993.
[Mai94]
R. J. Mailloux. Phased Array Antenna Handbook. Artech House, Boston, 1994.
[McC82]
J. H. McClellan. “Multidimensional Spectral Estimation”. Proceedings of the IEEE, 70(9):1029–1039, September 1982.
[Mes92]
H. Messer. “Source Localization Performance and the Array Beampattern”. Signal Processing, 28(2):163–181, Aug. 1992.
[MH71]
R. J. McAulay and E. M. Hofstetter. “Barankin Bounds on Parameter Estimation”. IEEE Trans. on Information Theory, 17(6):669–676, Nov. 1971.
[MKB79]
K.V. Mardia, J.T. Kent, and J.M. Bibby. Multivariate Analysis. Academic Press, London, 1979.
[ML00]
Y. Ma and T. J. Lim. “Bit Error Probability for MDPSK and NCFSK over Arbitrary Rician Fading Channels”. IEEE J. Select. Areas Commun., 18(11):2179–89, 2000.
[MLP02]
Y. Ma, T. J. Lim, and S. Pasupathy. “Error Probability for Coherent and Differential PSK over Arbitrary Rician Fading Channels with Multiple Cochannel Interferers”. IEEE Trans. Commun., 50(3):429–41, 2002.
[MM80]
R. A. Monzingo and T. W. Miller. Introduction to Adaptive Arrays. John Wiley and Sons, 1980. 214
BIBLIOGRAPHY
[Mof68]
A. T. Moffet. “Minimum-Redundancy Linear Arrays”. IEEE Trans. Antennas Propagat., AP-16(2):172–175, March 1968.
[MP92]
A. M. Mathai and S. B. Provost. Quadratic Forms in Random Variables : Theory and Applications. Dekker, 1992.
[MS69]
R. J. McAulay and L. P. Seidman. “A Useful Form of the Barankin Lower Bound and its Application to PPM Threshold Analysis”. IEEE Trans. on Information Theory, 15(2):273–279, March 1969.
[MS02]
A. Mitra and P. Stoica. “The Asymptotic Cram´er-Rao Bound for 2-D Superimposed Exponential Signals”. Multidimensional Systems and Signal Processing, 13:317–331, July 2002.
[Ngu94]
H. Nguyen. Robust Beamforming Using Direction of Arrival Estimates. PhD thesis, George Mason University, Fairfax, VA, 1994.
[Nic87]
U. Nickel. “Angular Superresolution with Phased Array Radar: A Review of Algorithms and Operational Constraints”. IEE Proceedings F, 134(1):53–9, 1987.
[NRC91]
F. E. Nathanson, J. P. Reilly, and M. N. Cohen. Radar Design Principles: Signal Processing and the Environment. McGrawHill, New York, 2nd edition, 1991.
[NV94]
H. Nguyen and H. L. Van Trees. “Comparison of Performance Bounds for DOA Estimation”. In Seventh SP Workshop on Statistical Signal & Array Processing, pages 313–316, 1994.
[OVK92]
B. Ottersten, M. Viberg, and T. Kailath. “Analysis of Subspace Fitting and ML Techniques for Parameter Estimation from Sensor Array Data”. IEEE Trans. on SP, SP-40:590–600, March 1992.
[OVSN93] B. Ottersten, M. Viberg, P. Stoica, and A. Nehorai. “Exact and Large Sample Maximum Likelihood Techniques for Parameter Estimation and Detection in Array Processing”. In S. Haykin, J. Litva, and T. J. Shepherd, editors, Radar Array Processing. Springer-Verlag, Berlin, 1993. [PR96]
S. B. Provost and E. D. Rudiuk. “The Exact Distribution of Indefinite Quadratic Forms in Noncentral Normal Vectors”. Annals of the Institute of Statistical Mathematics, 48(2):381–394, 1996. 215
BIBLIOGRAPHY
[Pro95]
J. G. Proakis. Digital Communications. McGraw-Hill, Inc., 3rd edition, 1995.
[Rao45]
C.R. Rao. “Information and Accuracy Attainable in the Estimation of Statistical Parameters”. Bull. Calcutta Math. Soc., 37:81–91, 1945.
[Rap96]
D. Raphaeli. “Distribution of Noncentral Indefinite Quadratic Forms in Complex Normal Variables”. IEEE Trans. Inform. Theory, 42(3):1002–7, 1996.
[RB74]
D. C. Rife and R. B. Boorstyn. “Single-Tone Parameter Estimation from Discrete-Time Observations”. In IEEE Trans. on Information Theory, pages 591–598, 1974.
[Rei88]
N. Reid. “Saddlepoint Methods and Statistical Inference”. Statistical Science, 3(2):213–238, 1988.
[Ric80]
S. O. Rice. “Distribution of Quadratic Forms in Normal Random Variables - Evaluation by Numerical Integration”. SIAM J. Sci. Stat. Comput., 1(4):438–448, Dec. 1980.
[Ric03]
C. Richmond. “Mean-Squared Error Performance Prediction of Maximum-Likelihood Signal Parameter Estimation ”. In Proc. 11th Annual Workshop on Adaptive Sensor Array Processing, MIT Lincoln Lab., Lexington, MA, USA, 2003.
[RPK86]
R. Roy, A. Paulraj, and T. Kailath. “ESPRIT – A Subspace Rotation Approach to Estimation of Parameters of Cisoids in Noise”. IEEE Trans. on ASSP, ASSP-34(4):1340–1342, October 1986.
[RW80]
˚. Wedin. “Algorithms for Separable Nonlinear A. Ruhe and P.A Least Squares Problems”. SIAM Review, 22:318–327, July 1980.
[RW90]
L. R˚ ade and B. Westergren. Beta. Mathematics Handbook. Lund: Studentlitteratur; Bromley: Chartwell-Bratt, 2nd edition, 1990.
[RZ93]
C. R. Rao and L. C. Zhao. “Asymptotic Behavior of Maximum Likelihood Estimates of Superimposed Exponential Signals”. In IEEE Trans. on Signal Processing, pages 1461–1464, 1993.
[RZZ93]
C. R. Rao, L. C. Zhao, and B. Zhou. “A Novel Algorithm for 2-Dimensional Frequency Estimation”. In Proc. 27th Asilomar 216
BIBLIOGRAPHY
Conf. on Signals, Systems and Computers, Pacific Grove, CA, USA, 1993. [RZZ94]
C. R. Rao, L. C. Zhao, and B. Zhou. “Maximum Likelihood Estimation of 2-D Superimposed Exponential Signals”. IEEE Trans. on Signal Processing, 42(7):1795–1802, July 1994.
[Sch79]
R.O. Schmidt. “Multiple Emitter Location and Signal Parameter Estimation”. In Proc. RADC Spectrum Estimation Workshop, pages 243–258, Rome, NY, 1979.
[Shu83]
R. H. Shumway. Replicated time-series regression: An approach to signal estimation and detection. In D.R. Brillinger and P. R. Krishnaiah (eds), Handbook of Statistics, pages 383–408. Elsevier Science Publishers B. V., Inc, 1983.
[Sko86]
M. I. Skolnik. Introduction to Radar Systems. McGraw-Hill, New York, 2nd edition, 1986.
[Sko89]
M. I. Skolnik. Radar Handbook. McGraw-Hill, New York, 2nd edition, 1989.
[SM97]
P. Stoica and R. Moses. Introduction to Spectral Analysis. Prentice-Hall, Upper Saddle River, NJ, 1997.
[SN89]
P. Stoica and A. Nehorai. “MUSIC, Maximum Likelihood, and Cram´er-Rao Bound”. IEEE Trans. on Acoustics, Speech, and Signal Processing, 37(5):720–741, May 1989.
[SN90a]
P. Stoica and A. Nehorai. “MUSIC, Maximum Likelihood, and Cram´er-Rao Bound: Further Results and Comparisons”. IEEE Trans. on Acoustics, Speech, and Signal Processing, 38(12):2140– 2150, Dec. 1990.
[SN90b]
P. Stoica and A. Nehorai. “Performance Study of Conditional and Unconditional Direction-of-Arrival Estimation”. IEEE Trans. on Acoustics, Speech, and Signal Processing, 38(10):1783– 1795, Oct. 1990.
[SN95]
P. Stoica and A. Nehorai. “On the Concentrated Stochastic Likelihood Function in Array Signal Processing”. Circuits, Systems, and Signal Processing, 14(5):669–674, 1995. 217
BIBLIOGRAPHY
[SOVM96] P. Stoica, B. Ottersten, M. Viberg, and R. Moses. “Maximum Likelihood Array Processing for Stochastic Coherent Sources”. IEEE Trans. SP, SP-44:96–105, Jan. 1996. [SS89]
P. Stoica and T. S¨oderstrom. “On Reparametrization of Loss Functions Used in Estimation and the Invariance Principle”. Signal Processing, 17:383–387, Aug. 1989.
[SS92]
P. Stoica and T. S¨oderstr¨om. “On Array Signal Processing in Spatially Correlated Noise Fields ”. IEEE Trans. on Circuits and Systems II: Analog and Digital Signal Processing, 39(12):879– 882, Dec. 1992.
[SS98]
A. L. Swindlehurst and P. Stoica. “Maximum Likelihood Methods in Radar Array Processing”. Proceedings of the IEEE, 86(2):421–441, Feb. 1998.
[SSM93]
J. L. Sacchini, W. M. Steedly, and R. L. Moses. “TwoDimensional Prony Modeling and Parameter Estimation”. IEEE Trans. on Signal Processing, 41(11):3127–3137, November 1993.
[TK99]
J. Tabrikian and J. L. Krolik. “Barankin Bounds for Source Localization in an Uncertain Ocean Environment”. IEEE Trans. on Signal Processing, 47(11):2917–2927, Nov. 1999.
[Tre68]
H. L. Van Trees. Detection, Estimation, and Modulation Theory, Part I. John Wiley and Sons, New York, 1968.
[Tre02]
H. L. Van Trees. Detection, Estimation, and Modulation Theory, Part IV, Optimum Array Processing. John Wiley and Sons, 2002.
[Tur60]
G. L. Turin. “The Characteristic Function of Hermitian Quadratic Forms in Complex Normal Variables”. Biometrika, 47(1/2):199–201, June 1960.
[VB88]
B. D. Van Veen and K. M. Buckley. “Beamforming: A versatile approach to spatial filtering”. IEEE ASSP Magazine, 5(2):4–24, 1988.
[VE99]
M. Viberg and C. Engdahl. “Element position considerations for robust direction finding using sparse arrays”. In Proc. 33rd Asilomar Conf. on Signals, Systems, and Computers, 1999. 218
BIBLIOGRAPHY
[Ver87]
E. J. Vertatschitsch. Linear Array Structures for Direction of Arrival Estimation. PhD thesis, McMaster Univ., Hamilton, ON, Canada, 1987.
[VH91]
E. J. Vertatschitsch and S. Haykin. “Impact of Linear Array Geometry on Direction-of-Arrival Estimation for a Single Source”. IEEE Trans. on Antennas and Propagation, 39(5):576–84, 1991.
[Vib93]
M. Viberg. “Sensitivity of Parametric Direction Finding to Colored Noise Fields and Undermodeling”. Signal Processing, 34(2):207–22, 1993.
[Vib95]
M. Viberg. “Performance Analysis of Direction Finding with Large Arrays and Finite Data”. IEEE Trans. on Signal Processing, 43(2):469–477, February 1995.
[VO91]
M. Viberg and B. Ottersten. “Sensor Array Processing Based on Subspace Fitting”. IEEE Trans. on Signal Processing, 39(5):1110–1121, May 1991.
[VOK91]
M. Viberg, B. Ottersten, and T. Kailath. “Detection and Estimation in Sensor Arrays Using Weighted Subspace Fitting”. IEEE Trans. on Signal Processing, 39(11):2436–2449, November 1991.
[War94]
J. Ward. “Space-Time Adaptive Processing for Airborne Radar”. Technical Report 1015, MIT Lincoln Laboratory, December 1994.
[War95]
J. Ward. “Cramer-Rao Bounds for Target Angle and Doppler Estimation with Space-Time Adaptive Processing Radar”. In 29th Asilomar Conference on Signals, Systems and Computers, Pacific Grove, CA, USA, 1995.
[Wax85]
M. Wax. Detection and Estimation of Superimposed Signals. PhD thesis, Stanford Univ., Stanford, CA, March 1985.
[Wax91]
M. Wax. “Detection and Localization of Multiple Sources via the Stochastic Signals Model”. IEEE Trans. on SP, 39(11):2450– 2456, Nov. 1991.
[WJ65]
J. M. Wozencraft and I. M. Jacobs. Principles of Communication Engineering. Wiley, New York, 1965. 219
BIBLIOGRAPHY
[WK85]
M. Wax and T. Kailath. “Detection of Signals by Information Theoretic Criteria”. IEEE Trans. on Acoustics, Speech, and Signal Processing, 33(2):387–392, April 1985.
[Woo53]
P. M. Woodward. Probability and Information Theory, with Applications to Radar. Pergamon Press Ltd., London, 1953.
[WT00]
M. Wax and R. Tweg. “Direction of Arrival Tracking Below the Ambiguity Threshold”. IEEE Trans. on Aerospace and Electronic Systems, 36(2):354–363, April 2000.
[WW85]
A. J. Weiss and E. Weinstein. “A Lower Bound on the MeanSquare Error in Random Parameter Estimation”. IEEE Trans. on Information Theory, 31(5):680–682, Sep. 1985.
[WZ89]
M. Wax and I. Ziskind. “Detection of the Number of Coherent Signals by the MDL Principle”. IEEE Trans. on ASSP, ASSP37(8):1190–1196, Aug. 1989.
[WZ98]
K. T. Wong and M. D. Zoltowski. “Direction-Finding with Sparse Rectangular Dual-Size Spatial Invariance Array”. IEEE Trans. on Aerospace and Electronic Systems, 34(4):1320–1335, Oct. 1998.
[Xu01]
W. Xu. Performance Bounds on Matched-Field Methods for Source Localization and Estimation of Ocean Environmental Parameters. PhD thesis, Massachusetts Institute of Technology, Cambridge, MA, 2001.
[Xu02]
W. Xu. “Quantitative Ambiguity Analysis for Matched-Field Source Localization”. In Proc. 36th Asilomar Conf. on Signals, Systems and Computers, Pacific Grove, CA, USA, 2002.
[Zat03]
M. Zatman. “Space-Time Adaptive Processing Using Sparse Arrays”. In Proc. 11th Annual Workshop on Adaptive Sensor Array Processing, MIT Lincoln Lab., Lexington, MA, USA, 2003.
[ZF96]
A. Zeira and B. Friedlander. “Direction of Arrival Estimation Using Parametric Signal Models”. IEEE Trans. on Signal Processing, 44(2):339–350, February 1996.
[ZLS97]
D. Zheng, J. Li, and P. Stoica. “One-Dimensional MODE Algorithm for Two-Dimensional Frequency Estimation”. In Proc. ICASSP 97, 1997. 220
BIBLIOGRAPHY
[ZS98]
M. Zatman and S. T. Smith. “Resolution and Ambiguity Bounds for Interferometric-Like Systems”. In Proc. 32nd Asilomar Conf. on Signals, Systems, and Computers, 1998.
[ZW88]
I. Ziskind and M. Wax. “Maximum Likelihood Localization of Multiple Sources by Alternating Projection”. IEEE Trans. on ASSP, ASSP-36:1553–1560, Oct. 1988.
[ZW00]
M. D. Zoltowski and K. T. Wong. “Closed-Form EigenstructureBased Direction Finding Using Arbitrary but Identical Subarrays on a Sparse Uniform Cartesian Array Grid”. IEEE Trans. on Signal Processing, 48(8):2205–2210, Aug. 2000.
[ZZ69]
J. Ziv and M. Zakai. “Some Lower Bounds on Signal Parameter Estimation”. IEEE Trans. on Information Theory, 15(3):386– 391, May 1969.
221


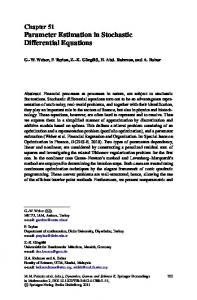


![[PDF] Download Phased-Array Radar Design: Application of Radar ...](https://m.moam.info/img/260x300/pdf-download-phased-array-radar-design-application_6477d7f2097c4786708c28fc.jpg)


