seagrasses) along two transects in the oligotrophic Florida Everglades coastal landscape ... In the southern Everglades transect, there was a productivity peak in.
Hydrobiologia (2006) 569:459–474 Ó Springer 2006 J.C. Trexler, E.E. Gaiser & D.L. Childers (eds), Interaction of Hydrology and Nutrients in Controlling Ecosystem Function in Oligotrophic Coastal Environments of South Florida DOI 10.1007/s10750-006-0149-5
Spatial and temporal patterns of aboveground net primary productivity (ANPP) along two freshwater-estuarine transects in the Florida Coastal Everglades Sharon M.L. Ewe1,*, Evelyn E. Gaiser1, Daniel L. Childers1, David Iwaniec1, Victor H. Rivera-Monroy2 & Robert R. Twilley2 1
Southeast Environmental Research Center and the Department of Biological Sciences, Florida International University, Miami, FL 33199, USA 2 Wetland Biogeochemistry Institute, Department of Oceanography and Coastal Science, Louisiana State University, Baton Rouge, LA 70803, USA (*Author for correspondence: E-mail: Sharon.ewe@fiu.edu) Key words: Cladium jamaicense, periphyton, Rhizophora mangle, Avicennia germinans, Laguncularia racemosa, Thalassia testudinum
Abstract We present here a 4-year dataset (2001–2004) on the spatial and temporal patterns of aboveground net primary production (ANPP) by dominant primary producers (sawgrass, periphyton, mangroves, and seagrasses) along two transects in the oligotrophic Florida Everglades coastal landscape. The 17 sites of the Florida Coastal Everglades Long Term Ecological Research (FCE LTER) program are located along fresh-estuarine gradients in Shark River Slough (SRS) and Taylor River/C-111/Florida Bay (TS/Ph) basins that drain the western and southern Everglades, respectively. Within the SRS basin, sawgrass and periphyton ANPP did not differ significantly among sites but mangrove ANPP was highest at the site nearest the Gulf of Mexico. In the southern Everglades transect, there was a productivity peak in sawgrass and periphyton at the upper estuarine ecotone within Taylor River but no trends were observed in the C-111 Basin for either primary producer. Over the 4 years, average sawgrass ANPP in both basins ranged from 255 to 606 g m)2 year)1. Average periphyton productivity at SRS and TS/Ph was 17– 68 g C m)2 year)1 and 342–10371 g C m)2 year)1, respectively. Mangrove productivity ranged from 340 g m)2 year)1 at Taylor River to 2208 g m)2 year)1 at the lower estuarine Shark River site. Average Thalassia testudinum productivity ranged from 91 to 396 g m)2 year)1 and was 4-fold greater at the site nearest the Gulf of Mexico than in eastern Florida Bay. There were no differences in periphyton productivity at Florida Bay. Interannual comparisons revealed no significant differences within each primary producer at either SRS or TS/Ph with the exception of sawgrass at SRS and the C)111 Basin. Future research will address difficulties in assessing and comparing ANPP of different primary producers along gradients as well as the significance of belowground production to the total productivity of this ecosystem.
Introduction One excellent assessment of ecosystem function is via aboveground net primary productivity (ANPP). Aboveground NPP, the measure of net
rate of photosynthetic carbon sequestration by plants into aboveground components, is often used to provide insight into key ecological processes (e.g. Clark et al., 2001). For example, ANPP can be compared across landscapes to
460 identify the primary ecosystem drivers and delineate the sources and relative importance of these drivers (Graumlich et al., 1989; Raich et al., 1997; Hansen et al., 2000; Schuur & Matson, 2001; Childers et al., 2006a). In terrestrial ecosystems, drivers of spatial and temporal landscape productivity patterns include factors such as precipitation, temperature, humidity, soil moisture, and topography (Sala et al., 1988; Chen & Twilley, 1999; Hansen et al., 2000). In coastal ecosystems such as the Everglades, overall productivity of key producers is influenced by hydrology, nutrient supply and availability, as well as salinity (Fourqurean et al., 1992; Fourqurean & Zieman, 2002; Childers et al., 2006a). The Everglades is an oligotrophic (Noe et al., 2001) phosphorus (P) limited (Koch & Reddy, 1992; Davis, 1994) wetland system largely driven by rainfall-derived seasonal sheetflow. This system encompasses a broad range of habitats, from sawgrass (Cladium jamaicense) dominated marshes in the freshwater wetlands to mangrove forests in estuarine ecotones, and shallow subtidal seagrass beds in Florida Bay. In most subtropical estuaries worldwide, productivity tends to be nitrogen (N) limited (Vitousek & Howarth, 1991; Chen et al., 2000), with the limiting nutrient being supplied by the upstream watershed. In estuaries of the Everglades however, P is primarily supplied by the Gulf of Mexico and not the oligotrophic upstream areas (Childers et al., 2006b). The low levels of P (�0.25 lM l)1) in most of the Everglades limit production and control the dominant biotic processes within this ecosystem (Fourqurean et al., 1992; Chen & Twilley, 1999; Noe et al., 2001; Fourqurean & Zieman, 2002; Gaiser et al., 2006). Over the last 100 years however, agriculturally derived P inputs have increased (Davis, 1994; McCormick et al., 1996; Smith & McCormick, 2001). Phosphorus enrichment has altered species composition, standing biomass and nutrient turnover within primary producer communities (Noe et al., 2001; Sklar et al., 2001), potentially affecting food web relationships within the ecosystem. The Florida Coastal Everglades Long Term Ecological Research program (FCE LTER) presents a unique opportunity to determine trends in ANPP at a landscape scale. The purpose of the FCE LTER is to investigate how freshwater flows control estuarine dynamics over spatial (i.e.
landscape-level) and temporal (i.e. multi-decadal) scales, taking into account key drivers, such as hydrologic restoration and sea level rise (Childers et al., 2006a). We are interested in understanding how patterns and the magnitude of primary productivity are controlled by nutrient source and availability. We originally hypothesized a productivity peak in the low salinity ecotone region of the western Everglades but not in the southern Everglades. This productivity peak was hypothesized to be a result of the mixing of freshwater that was low in P and higher in N with marine water that was higher in P and lower in N (Rudnick et al., 1999; Childers et al., 2006b). Due to lower hydrologic exchanges between eastern Florida Bay and the Gulf of Mexico, marine waters intruding inland at the southeastern Everglades were not expected to be a significant contributor of P to the estuarine ecotone of this area (Nuttle et al., 2000; Childers et al., 2006b). Gradients of hydrology, salinity and nutrient availability have been well documented in this region (Fourqurean et al., 1992; Boyer et al., 1999; Fourqurean & Robblee, 1999; Rudnick et al., 1999; Childers et al., 2006b). Relationships between ANPP and the quantity and timing of water inputs to the freshwater Everglades freshwater wetlands have been documented by previous researchers (e.g. Childers et al., 2006a; Iwaniec et al., 2006). The relationship between nutrient inputs and ANPP of key producers has also been examined in the freshwater Everglades (e.g. Craft et al., 1995; Chiang et al., 2000; Daoust and Childers, 2004, Iwaniec et al., 2006) and Florida Bay (e.g. Frankovich and Fourqurean, 1997; Armitage et al., 2005). Although ANPP has been examined in individual producers across sites within habitats, landscape scale spatial and temporal patterns of ANPP from the freshwater– marine gradient in the Everglades have never been contrasted. In this paper we have synthesized ANPP of dominant ecosystem components from two freshwater–marine transects, collected by various researchers, from 2001 to 2004. These data do not attempt to represent total ecosystem productivity nor do they include primary production by all autotrophs. Instead, we present measures of ANPP by the dominant primary producers in each ecosystem type studied. Spatial and temporal
461 patterns in these ANPP data provide a broadstroke picture of productivity patterns across the coastal Everglades landscape. Specifically, we compare and contrast the spatial and temporal patterns of ANPP of sawgrass, periphyton, mangroves, and seagrasses across the landscape. We also address limitations of the existing data and suggest refinements for future data collection.
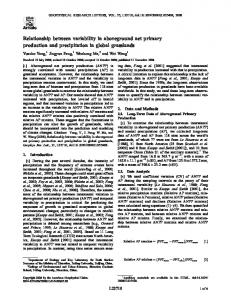
Methods Study sites Seventeen study sites were established in two major drainage basins of Everglades National Park (ENP), Florida, USA (Fig. 1). Both transects extend from the freshwater marshes to the estuarine
and subtidal marine environments. The large Shark River Slough (SRS) basin discharge is channeled via Shark River (Fig. 1). The Taylor River/C-111/Florida Bay Basin (TS/Ph) drains southeast Everglades National Park and is a much smaller basin that drains into a considerably larger estuarine and subtidal area (Fig. 1). This system contributes to the upper Florida Bay ecosystem and has been the focus of much ecological research and restoration (e.g. Rudnick et al., 1999). Six sites are located along the SRS transect. The three upstream sites (SRS 1–3) are representative of freshwater marshes with vegetation dominated by sawgrass (Cladium jamaicense) interspersed with wet prairie, open sloughs, and tree islands (Fig. 1, Table 1). Although other emergent species (e.g. Eleocharis spp., Nelumbo nucifera, Panicum hemitomon, etc.) and submergent aquatics (e.g. Utricu-
Figure 1. Map of Everglades National Park indicating the locations of the Shark River Slough (SRS) and Taylor River/Everglades Panhandle (TS/Ph) study sites along the two transects (dotted red lines).
Mangrove
Mangrove
Marsh and slough
SRS 6
TS/Ph 1–5
and brackish water (dry season) inputs.
C. erectus
SRS 5
Fresh (wet season)
Mangrove and
SRS 4
Same as SRS 1–3.
and tidal oceanic inputs.
Seasonal fresh water
and tidal oceanic inputs.
Seasonal fresh water
slough.
Peat-marl mix (�1 m)
Peat, 4–6.5 m
Peat, 2–3 m
Peat (1.5–2 m)
Same as SRS 1–3. Same as SRS 1–3 except ANPP determined by integrating area below the curve for multiple measures.
(0.1–3 cm thick)
Same as SRS 4.
Same as SRS 4.
Novelli (1984), and Day et al. (1987)).
wood growth (Chen & Twilley (1999), Cintron &
20�20 m plots. Tree height and dbh measured annually in plots. Annual ANPP=total litterfall+
Litter collected (10, 0.25 m2 traps) monthly from 2,
annual basis.
converted to ANPP by averaging and scaling up to
for ash-free dry mass (AFDM). Daily productivity
pling, all periphyton within a known area harvested
production (Iwaniec et al., 2006). After BOD sam-
Biological oxygen demand (BOD) measured (n=3) when water depth >1 cm, and converted to carbon
2006a).
grated annually to obtain ANPP (Childers et al.,
(Childers & Daoust, 1998). Biomass gain/site inte-
3 plots (1�1 m2) sampled 6�/year non-destructively
Methods
C. jamaicense Mat periphyton
(15–20 m tall)
Same as SRS 5
L. racemosa (�10 m tall)
R. mangle, A. germinans,
L. racemosa, C. erectus (5–7 m tall)
R. mangle,
Mat periphyton (0.1–3 cm thick)
0.5–1.5 m tall)
permanently flooded
(Cladium jamaicense;
Sawgrass
Dominant producers
interspersed with
Peat (0.3–1.5 m)
Soil
hydroperiod marsh
Short and long
Hydrology
Marsh and slough
Habitat
Productivity
SRS 1–3
Site
Table 1. Descriptions of the communities and physical attributes of each study site
462
Mangrove forest
TS/Ph 8
Seasonal fresh water
deep) lagoon.
Shallow (3–6 m
estuarine inputs.
Seasonal fresh water and wind-driven
estuarine inputs.
and wind-driven
Methods used to measure ANPP of the dominant species are shown.
estuarine
TS/Ph 9–11 Subtidal
Estuarine ecotone
and wind-driven estuarine inputs
Seasonal freshwater
Estuarine ecotone
(mangrove and marsh)
TS/Ph 7
TS/Ph 6
marking technique (Zieman, 1974). Biomass gain/
between 15 and 30 days (Gaiser et al., 2005)
aggregate)
multiple samplings during year.
determined. Annual ANPP calculated as integral of
bi-monthly. Accumulated AFDM/area/time was
ANPP. Glass slides (n=15) deployed onto sediment surface
Periphyton (loose
area was calculated and scaled up to obtain annual
T. testudinum was measured using the modified leaf
placed in a 10�10 m plot. Aboveground NPP of
Quarterly, six 10�20-cm quadrats were haphazardly
Same as SRS 4 except litter traps are deployed only in 1 20�20 m plot.
Same as TS/Ph 6.
Same as TS/Ph 1–5.
Leaf turnover (losses and gains) counted twice year.
11: >1 m
(0.1–0.5 m tall)
T. testudinum
Laguncularia racemosa, C. erectus (3–4 m tall)
R. mangle (1–3 m tall)
(1–2 m) C. jamaicense
Rhizophora mangle
10: