Journal of Coastal Development Volume 10, Number 3, Juny, 2007 : 153 - 169
ISSN : 1410-5217 Accredited : 23a/Dikti/Kep/2004
SPATIAL AND TEMPORAL PATTERNS OF THE MACROBENTHIC ASSEMBLAGES IN RELATION TO ENVIRONMENTAL VARIABLES Sapto P. Putro* Biology Study Program, Faculty of Mathematics and Natural Science, ,Diponegoro University Semarang 50275, Central Java, Indonesia Received : September, 28. 2006 : Accepted : May, 29, 2007
ABSTRACT This study focuses on the effect of fallowing of southern blue-fin tuna farms in southern Spencer Gulf, South Australia, on macrobenthic assemblage comparing spatial and temporal patterns of distribution and abundance at eight control sites and eight fallowed pontoon sites, during the period October 2002 to October 2003. Two stations at each site were sampled five times throughout the year with four replicates. Polychaetes were the most abundant organisms both at control sites (76.4%) and fallowed pontoon sites (80.5%). Five dominant taxa (Capitellidae, Cirratullidae, Lumbrineridae, Nephtyidae, and Spionidae), relatively tolerant to organic enrichment, were generally recorded in higher numbers at the fallowed sites than at control sites. Assessed using univariate and multivariate analyses, a significant difference in abundance between the control and fallowed pontoon sites was found, which also showed a significant effect of time. A slight decreased in diversity, number of taxa, and evenness at fallowed pontoon sites compared to those at control sites was observed. Seasonal fluctuations caused by natural variability, especially hydrodynamic conditions and sediment characteristics, are likely to be responsible for the observed changes of the assemblages. Keywords: Fallowed fish farms; macrobenthic assemblages; Polychaeta; opportunistic taxa. *) Correspondence: ; Phone: +62.24.70799494; Fax: +62.24.76480923; e-mail:
[email protected]
INTRODUCTION The structure of macrobenthic assemblages vary at different spatio-temporal scales (Chapman, 2002; Ysebaert and Herman, 2002; Dauvin et al., 2004), and thus need to be understood in order to identify the processes that govern ecosystems (Levin, 1992), and to measure the potential effects of environmental disturbance (Chapman, 2002; HernandezArana et al., 2003). An environmental disturbance, whether natural (Hernandez -
Arana et al., 2003; Aller, 1997) or anthropogenic (Karakassis et al., 2000), may change the pattern of macrobenthic assemblages spatially and temporally in taxa richness, abundance, and biomass. The changes may be used as an indicator of “community” disturbance and provide an assessment of the levels of disturbance (Pearson and Rosenberg, 1978; Rosenberg, 2001). A shift in the proportions of
Spatial and Temporal Patterns of the Macrobenthic Assemblages in Relation to Environmental Variables
153
Journal of Coastal Development Volume 10, Number 3, Juny, 2007 : 153 - 169
ISSN : 1410-5217 Accredited : 23a/Dikti/Kep/2004
different phyla, changes in relative distribution of species abundance and biomass with increasing levels of disturbance, reduction in trophic complexity, and increase in densities of opportunistic taxa are some of the benthic responses to a disturbance (Pearson and Rosenberg, 1978; Flemer et al., 1999; Warwick et al., 1990; Hernandez-Arana et al., 2003; Norkko et al., 2006). Sediments organically enriched by fish farming, are dominated by small opportunistic species whose size decreased with proximity to the farm (Weston 1990). In soft-sediment environments, spatial variability in the richness and abundance of macrobenthic fauna has been observed (Dauvin et al., 2004), with a high degree of variability at the smallest temporal and spatial scales (Chapman, 2002). Temporal variability in the distribution and abundance of macrofauna caused by environmental disturbance has been recognized in both shortterm (Livingston, 1987; Warwick and Uncles, 1980; Morrisey et al., 1992) and long-term studies (Brooks et al., 2004; Fraser et al., 2006; Macleod et al., 2004). Thus, understanding spatial and temporal distribution and abundance has become essential part of ecological research on benthic “communities” (Dauvin et al., 2004). Environmental variability is believed to play a major role in the change of structure expressed by variation in species richness, abundance, and biomass (Ysebaert and Herman, 2002). It has been suggested that spatial distribution of organisms in soft-bottom habitats is mainly controlled by both biotic factors (eg. life history, competition, predation) and abiotic factors (eg. food availability, sediment characteristics, tidal current) (Warwick and Uncles, 1980; Thrush, 1991; Rosenberg, 2001; Ysebaert et al., 2003; Cusson and Bourget, 2005). The structure of macrobenthic assemblages has been used as an environmental quality criterion for managing marine aquaculture (Pearson and Black, 2001). However, their distributional patterns at different spatio-temporal scales are still neglected. The relationship between temporal
and spatial variability of environmental variables and biological patterns are thus poorly understood (Ysebaert and Herman, 2002). Furthermore, most macrobenthic studies are from soft muddy sediments in different parts of the world (Kempf et al., 2002; Crawford et al., 2003; Mistri et al., 2002; Rosenberg et al., 2002; Constable, 1999), not really necessary comparable to the environments of the southern Spencer Gulf, South Australia, where southern bluefin tuna farms are located. As a consequence, only little information is available about spatial and temporal structure of macrobenthic assemblages in coarse sediments under fish farms. In this study, the changes in the dominance pattern of the abundance and biomass as an indicator of community disturbance are discussed. Abundance, diversity, evenness, and taxa richness between control and impacted sites are compared.
MATERIALS AND METHODS The study sites The sampling sites were located between 135o 58.25' to 135o 59.82' E and 34o 35.41' to 34o 42.43' S, in southern Spencer Gulf, South Australia, where farming of southern bluefin tuna (Thunnus maccoyii) takes place (Fig 1). The farms consist of a series of pontoons 40-50 m in diameter, with a 15 m deep net. Pontoons are stocked at rates of 1.5 – 2.5 kg m-3 (Cheshire et al., 2005). They are situated in areas with relatively strong microtidal ( 0.7) was excluded to avoid the violation of the multicollinearity assumption, while others were retained in the analysis (Tabachnick and Fidell, 2001). Outliers were checked by inspecting the values of Mahalanobis distances and scatterplot produced by the multiple regression program (Pallant, 2004). The coefficient of determination (r2) was calculated to assess how much the level of the variance in the benthic abundance is explained by the regression model. The statistical significance of the result was then assessed using ANOVA at the 95% confidence level. The contribution of each environmental variable to explaining the dependent variable (benthic abundance) was compared using Beta values at the 95% confidence level.
RESULTS AND DISCUSSION
General trends of macrobenthic structure The macrobenthic assemblages were dominated by polychaetes (28 families) at both control and fallowed sites (Fig. 3) The proportion of Polychaeta at the control and fallowed pontoon sites was 76.4% and 80.5%, respectively. Other major taxa in the assemblages were Crustacea, Echinodermata, Mollusca, and Sipuncula. control and fallowed sites (Fig. 3) The proportion of Polychaeta at the control and fallowed pontoon sites was 76.4% and 80.5%, respectively. Other major
taxa in the assemblages were Crustacea, Echinodermata, Mollusca, and Sipuncula. The second most abundant group of animals was the Crustacea, which was relatively more abundant at control sites by 3.3% compared to the fallowed sites. Seven families of bivalve molluscs were recorded during sampling period. Other phyla were relatively rare and varied little between fallowed and control sites. During the sampling period, the number of individuals increased at control sites, while they decreased at fallowed pontoon sites from October 2002 to May 2003 (Fig 4). From May 2003 and onwards, however, there was a slight decrease in the number of individuals for the control sites, while those at fallowed increased slightly. Both sites increased in their numbers after July 2003. Because the trends between the first six months and the last six months were different, a two-way analysis of variance was used to assess the effect of site and time for each six-month period. In the first six months, the abundance at fallowed sites decreased while at control sites increased. Although the effect was small (partial eta squared= 0.043), the two sites were significantly different during this period (F(1,383)= 16.919, p0.05). However, at the fallowed sites, there were significant differences between sites (F(7, 40) = 4.425; p = 0.002), with a large effect (partial eta squared = 0.492), explaining 49,2% of the variance. Post hoc comparisons using Tukey HSD test At the control sites, number of taxa between sites was not significantly different (F(7, 40) = 0.667; p>0.05), and there was also no significant difference between
Spatial and Temporal Patterns of the Macrobenthic Assemblages in Relation to Environmental Variables
159
evenness
Journal of Coastal Development Volume 10, Number 3, Juny, 2007 : 153 - 169
ISSN : 1410-5217 Accredited : 23a/Dikti/Kep/2004
35
Number of taxa (N) (N))
Number of taxa (N) (N))
35
30
25
20
30
25
20
15
15 PO 1
PO 2
PO 3
PO 4
PO 5
PO 6
PO 7
PO 8
RC1
RC3
RC5
RC7
BC4
BC5
BC7
BC8
( Margallef richness (d)
( Margallef richness (d)
RC3
8
8
6
4
2
6
4
2 PO 1
PO 2
PO 3
PO 4
PO 5
PO 6
PO 7
PO 8
RC5
RC7
BC4
BC5
BC7
BC8
1
Pielou's evenness (J')(J)')
1
Pielou's evenness (J')(J)')
RC1
0.9 0.8 0.7 0.6
0.9
0.8
0.7
0.5 PO 1
PO 2
PO 3
PO 4
PO 5
PO 6
PO7
RC1
PO 8
RC3
RC5
RC7
BC4
BC5
BC7
BC8
(( H')
2.9
Shannon diversity (
Shannon diversity (
(( H')
3.2
2.5
2.1
1.7
2.8
2.4
2 PO1
PO 2
PO 3
PO 4
PO5
PO 6
PO 7
PO 8
RC1
RC3
RC5
RC7
BC4
BC5
BC7
BC8
Fallowed sites
Control sites
Sampling site
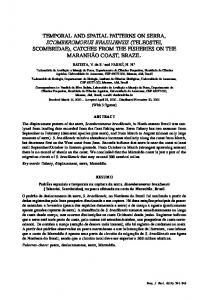
Fig. 5. Spatial patterns of taxon richness, diversity and evenness of macrobenthic assemblages averaged from five sampling times. Error bars displayed are 95% confidence intervals. sites was not significantly different (F(7, 40) = 0.667; p>0.05), and there was also no significant difference between zones (t = 0.44; p>0.05). However, at the fallowed sites, there were significant differences between sites (F(7, 40) = 4.425; p = 0.002), with a large
effect (partial eta squared = 0.492), explaining 49,2% of the variance. Post hoc comparisons using Tukey HSD test showed that the difference at site P01 ( X = 26.8, SD = 3.27) was significant from site
Spatial and Temporal Patterns of the Macrobenthic Assemblages in Relation to Environmental Variables
160
Journal of Coastal Development Volume 10, Number 3, Juny, 2007 : 153 - 169
ISSN : 1410-5217 Accredited : 23a/Dikti/Kep/2004
Temporal variability
P03 ( X = 19.6, SD = 2.61); site P02 ( X = 23.2, SD = 1.30) from site P04 ( X = 30.6, SD = 4.04); site P03 from site P04, site P06 ( X = 27.8, SD = 5.45), or site P07 ( X = 26.8, SD = 1.30). However, no significant difference in the number of taxa was observed between zones (t = 0.927; p>0.05). Similarly results were obtained for other indices, i.e. Margalef richness, Pielou’s evenness, and ShannonWiener diversity, with large magnitude differences.
(H')
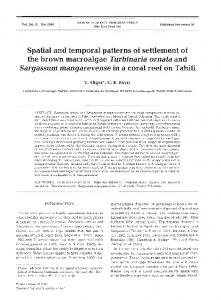
The diversity, evenness, and taxon richness at both control and fallowed sites differed at the five sampling times, but with high variability. At the last sampling time, higher values were observed for all indices at the control sites compared to the fallowed sites (Fig 6).
3.00
Shannon diversity index
Number of taxa (S)
30 .0 0
25 .0 0
20 .0 0
15 .0 0 Ja n0 3
M ay03
Jul03
1.0 0
0.9 0
0.8 0
0.7 0
0.6 0 O ct02
J an 03
M ay0 3
J ul0 3
2.00 Oct02
Jan03
M ay03
Jul03
Oct03
O ct0 2
Ja n03
M ay0 3
Ju l0 3
O ct03
O ct03
Margalef's richness index (d)
Pielou's evenness index (J')
O ct0 2
2.50
O ct03
6.5 0
5.5 0
4.5 0
3.5 0
Sampling time
Fig. 6. Temporal patterns of taxon richness, diversity and evenness of macrobenthic assemblages generated from eight control sites ( ) and eight fallowed sites ( Error bars displayed are 95% confidence intervals. In general, the number of taxa and Maragalef’s richness index at both sites increased gradually throughout the investigated period. A two-way analysis of variance revealed no significant differences in Margalef’s richness with site and time. However, the number of taxa varied significantly with sampling time (F(4, 80) = 3.594, p=0.01). Post hoc tests showed that the
number of taxa varied significantly with the highest in May 2003 ( X = 26.62, SD= 3.53) or October 2003 ( X = 26.87, SD= 3.65) and lowest in October 2002 ( X = 22.5, SD= 4.26). Shannon diversity was significantly higher at control sites than fallowed sites over the sampling period (F(1, 80)= 6.129, p