Nr 2(135) - 2018
Rynek Energii
Str. 89
SPATIAL PREDICTION MODELS OF WIRELESS NETWORK EFFICIENCY ESTIMATED BY KRIGING METHOD Anna Kamińska-Chuchmała Key words: WiFi prediction, wireless network efficiency, kriging method, Access Points Summary. Nowadays, the main Internet traffic is provided by wireless networks due to their mobility. Therefore, it should be more attention paid on efficiency of wireless network and find appropriate methods which could predict performance of considered network. In the paper spatial (3D) prediction of wireless network has been proposed. The data for research were collected from open WiFi network named PWR-WiFi located in building belonging to the main campus of Wrocław University of Science and Technology in Poland. Spatial prediction models of wireless network efficiency were performed by kriging estimation method.
1. INTRODUCTION Currently, access to the wireless network Internet is more frequent used than by wired network because of its mobility. Independent web analytics company StatCounter announced that Internet usage by mobile and tablet devices exceeded desktop worldwide for the first time in October 2016 [1]. Its research show that mobile and tablet devices accounted for 51.3% of internet usage worldwide in October compared to 48.7% by desktop. According to this fact, there is a need to improve efficiency of wireless networks and analysis of their performance in future, especially in open WiFi network were behaviour of users are difficult to predict. Regarding this fact Author decided to conduct the research on open access university wireless network named PWR-WiFi. The data obtained from Access Points (APs) were used to create spatial (3D) prediction model of wireless network efficiency with using ordinary kriging - geostatistical estimation method. The paper is structured in the following way. Firstly, related works are presented, after that estimation kriging method is described. Next, databases of wireless network are discussed. Subsequently preliminary and structural analysis of APs are shown and finally models of spatial PWR-WiFi prediction are presented. Conclusions from research ending this paper.
2. RELATED WORKS In recent years many new research associated with prediction of wireless network efficiency were conducted. In [2] authors considered Wireless Local Area Networks (WLANs) and they have proposed an AP throughput prediction method that considers terminal distribution. The predicted throughput of the proposed method with a method that uses linear order computation were compared and confirmed the performance
of the proposed method. They improved the throughput prediction formula to consider data frame collision and CSMA/CA. Authors of paper [3] leverage statistical analysis of real-world WiFi traces to learn aggregated traffic characteristics in terms of Inter-Arrival Time (IAT) that, once captured into a specific 2nd order Markov Modulated Poisson Process (MMPP(2)) model, enable accurate estimation of interference. They further use a hidden Markov model (HMM) for channel occupancy prediction. In another paper [4] authors propose a network traffic prediction based on deep belief network in wireless mesh backbone networks. Based on the predictors of two components, they obtain a predictor of network traffic. Authors of paper [5] aim to improve wireless network throughput by suppressing duplicate data transmissions from network links. It has been demonstrated that IP-layer Redundancy Elimination (RE) with content overhearing can significantly improve the goodput and utilization of wireless channels in wireless environment. Authors in paper [6] use of Wireless Sensor Networks to monitor the environmental parameters. The data from each sensor is required to be collected at the central node for further processing. In spite of special designs and routing protocols for improving efficiency, data can often be delayed or go missing due to node failures. This problem can be overcome by predicting the data beforehand and using the predicted data when there is a delay in the arrival of the data or when the data goes missing. Because no one till now using geostatistical methods to prediction performance of wireless networks the author of this paper decided to present her own investigations.
Str. 90
Rynek Energii
3. BACKROUND THEORY: ORDINARY KRIGING METHOD Ordinary Kriging (OK) is also named Linear Kriging with an Unknown Mean. It was developed by Georges Matheron in the early 1960s and is the form of kriging used mostly because it works under simple stationarity assumptions and does not require knowledge of the mean.
Nr 2(135) - 2018
one on second floor, two on third floor, five on fourth floor, and two on fifth floor. Projection of APs in building is presented in figure 2.
Consider that a random variable, Z, has been measured at sampling points , α=1,…,N. This information was used to estimate its value at a point x0 by punctual kriging with the same support as the data by ∗(
)=
(
), (1)
where:
usually represents the data points within the local neighbourhood, V, and is much smaller than the total number in the sample, N;
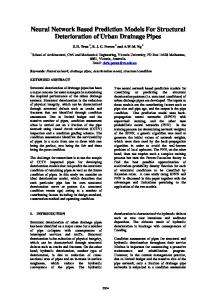
Fig. 1. B4 building located in main campus of WUST
– are the weights.
To ensure that the estimate is unbiased the weights are made to sum to one:
= 1 , (2) and the expected error is
[
∗(
) − ( )] = 0 (3)
More information on kriging estimation method could be found in [7], [8].
4. DESCRIPTION OF WIFI NETWORK AND DATA USED IN RESEARCH PWr-WiFi wireless network is an university network. The data collected to this research are obtained from eleven AP’s given in five-storey building (fig. 1), named B4, located in main campus at Wrocław University of Science and Technology. APs work with using frequency 2.4 GHz in IEEE 802.11b/g/n standards and 5 GHz in IEEE 802.11a/n standards. In this university network PWR-WiFi APs are wireless connected to switch and configured to get IP address from network and connecting to WiFi controller by LWAPP (Light Weight Access Point Protocol) protocol. The analysed data were obtained from passive experiment which were taken from 14th - 29th April over three consecutive years: 2014, 2015 and 2016. In research are considered data collected every hour between 7:00 AM and 9:00 PM. Examined APs are installed in B4 building as follows: one on first floor,
Fig. 2. Localization of APs in B4 building
Author was performed all research in R language under R environment in version 3.4.1 which is available as Free Software on GNU licence [9]. Author was used also RGeostats package [10] to made geostatistical estimation prediction model with kriging method. RGeostats is the Geostatistical Package (under R platform) developed by the Geostatistical Team of the Geosciences Research Center of MINES ParisTech.
5. PRELIMINARY AND STRUCTURAL DATA ANALYSIS OF PWR-WIFI WIRELESS NETWORK Three databases from years 2014-2016 which are examined during research contain every hour measurement from 16 days between 7:00 AM and 9:00 PM each day. This part of day was chosen because of distinguishing behaviour of users. PWR-WiFi is an
Nr 2(135) - 2018
Rynek Energii
university wireless network thus most of users that are students and employees of WUST like lecturers or administrative workers. Therefore the B4 building located at WUST campus is closed by night and main traffic in network is during office hours and lectures. Mainly, the first classes are started at 7:30 AM and the last one finished at 8:30 PM. Generally, during the day, classes are started quarter after an odd hour. Moreover this part of month April is a period in semester where students coming regularly on classes thus regularly need to access to the wireless network. Experiment relies on analyses on expanse three years to better show the dynamic grow of number of PWRWiFi network users and indicate periodical users’ behaviour as well as pay attention on this wireless network performance. The most adequate parameter of PWR-WiFi network which was obtained from measurement is number of users which will be next investigated during research and presented in this paper.
Str. 91
users. However, there is a growing trend over the last three years that could lead to overload PWR-WiFi wireless network. To confirm the increasing trend it could be seen that on average number of served users was between 20 and 30 in 2016 whereas on average was only 5 to 15 served users in 2014 and 10 to 20 in 2015.
Fig. 4. Number of users of PWR-WiFi wireless network served by 11 APs in B4 building, 28th April 2014
Fig. 5. Number of users of PWR-WiFi wireless network served by 11 APs in B4 building, 28th April 2015
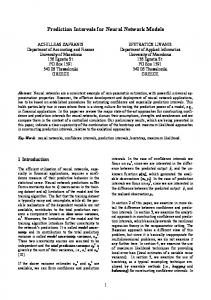
Fig. 3. Number of users served by 11 APs in B4 building between 14th and 29th April 2014
Figure 3 presents number of users connected to all of considered APs in B4 building in April 2014. It could be seen that during weekend 19th - 20th April there are no users or at most 1 to 2 users. In the other days average value of users of PWR-WiFi is on the level 10 users per AP’s. The highest occupancy network is in 28th April where maximum number exceed 50 users in the middle of the day when the students have classes and administrative workers are at offices. In figures 4-6 there are presented data for 28th April within three years 2014-2016 respectively where number of users is the highest among all of days from measurements. Cisco producer claim that one hundred is maximum number of served users by one Access Point in acceptable time. On basis these three figures it could be seen that number of users growing up about 10% per year thus in 2016 there is 20% more users than in 2014. An important is the fact that 3 Access Points where disabled in 2016, but nevertheless maximum number of users is equal almost 80, therefore there is still a reserve to upper limit 100
Fig. 6. Number of users of PWR-WiFi wireless network served by 8 APs in B4 building, 28th April 2016
Fig. 7. Histogram of number of users served by 8 APs connected to PWR-WiFi network in B4 building in 2016
Str. 92
Rynek Energii
Number of users in 2016 served by 8 Access Points connected with PWR-WiFi confirm histogram presented in figure 7. The highest frequency of users is in between 0 to 10 and also between 10 to 20 and 20 to 30 users. The histogram is skewed left. Table 1 Fundamental statistics of number of users for all considered APs located in building within three years 14-29.04. 14-29.04. 14-29.04. Parameters 2014 2015 2016 0
0
0
92
72
90
18
10
14
156.48
158.94
215.80
12.51
12.61
14.69
2.30
1.75
1.28
Kurtosis
6.82
3.04
1.64
Variability
0.70
1.21
1.02
Min number of users Max number of users Mean number of users Variance Standard deviation Skewness
Table 1 presents basic statistics of data within three years 2014-2016. The maximum number of users is about 90 in 2014 and 2016 and 72 in 2014. Mean value is the highest in 2014 and the lowest in 2015. Variance of data in 2014 and 2015 is similar and much higher is in 2016 what could means significant data differentiation. Furthermore dispersion of data characterized by standard deviation is also the largest in 2016. Variability of coefficient is similar and equal around 1 in 2015 and 2016 while in 2014 is smaller than 1 and equals 0.7. Skewed and asymmetric distribution is for data in 2014 where Kurtosis in the largest equals 6.82 and also skewness equals 2.30.
Nr 2(135) - 2018
culating variogram. For three databases from three years 2014-2016 three variograms were calculated in four different direction: 0, 45, 90, 135 degrees. As example variogram of number of users in 2014 is presented in figure 8. Distance lags for each calculation direction equals 5. The number of lags for each calculation direction equals 15. For all directions it could be seen the nugget effect. The range of variogram function for two directions was equal about 30 meters and for two others direction almost 60 meters. In the next step variogram function was approximated by theoretical functions: nugget effect, exponential, and spherical.
6. MODELS AND RESULTS OF SPATIAL PREDICTION OF WIRELESS NETWORK EFFICIENCY ESTIMATED BY KRIGING METHOD Three models of spatial prediction were prepared for three consecutive years 2014, 2015 and 2016. Models have 3 dimensions (x and y geographical coordinates and z the altitude coordinate) and prediction cover the space, where there is present the signal from APs belonging to PWR-WiFi wireless network in building B4. Space prediction was performed by geostatistical estimation method named kriging described in third chapter. Model of spatial prediction contains theoretical model of variogram approximation (described in chapter 4) and moving neighborhood. The moving neighborhood search is performed by angular sectors and the neighborhood ellipsoid is anisotropic. The search ellipsoid has three dimensions. In table 2 the results of estimation the spatial prediction models by kriging methods are presented. Maximum number of users is the highest in 2014 and equals 17 as well as variance and standard deviation. If in 2016 working APs was 11 as in previous years certainly the number of users and variability of data would be higher than it is and would maintain an upward trend. The smallest changeability of number of PWR-WiFi users is in 2015. Table 2 Fundamental statistics of estimated by kriging methods number of users of PWR-WiFi wireless network in whole building within three years 14-29.04. 14-29.04. 14-29.04. Parameters 2014 2015 2016
Fig. 8. Variogram calculated in four directions for number of PWR-WiFi wireless network users in 2014
The first step in structural analysis in geostatistical approach to create of spatial prediction model is cal-
Min number of users
2
0
0
Max number of users
17
6
7
Mean number of users
8
2
2
Variance
22.11
3.41
3.70
Standard deviation
4.70
1.85
1.93
Nr 2(135) - 2018
Rynek Energii
Str. 93
Consequently in figures 9 to 11 there are presented raster maps of mean number of PWR-WiFi users estimated by kriging method in years 2014-2016. Localization of more concentrations of users such as students, lecturers or administrative workers are similar for all years. Probably it is related to the fact that it is nearby (depends of floor in the building): lecture hall, library or deanery.
Fig. 10. Raster map of number of PWR-WiFi users estimated by kriging method in B4 building in April 2015
Fig. 9. Raster map of number of PWR-WiFi users estimated by kriging method in B4 building in April 2014
In figure 12 raster maps of spatial prediction of numbers of PWr-WiFi wireless network users on each level on the floor in B4 building for all three years are presented. Depending on localization of APs on each floor the spread of users are different. The main concertation of users is on the first two floors. On the fifth floor there are the least of users because on this floor there is no lecture hall or classroom where students could generated the largest number of users during the day. Fig. 11. Raster map of number of PWR-WiFi users estimated by kriging method in B4 building in April 2016
Fig. 12. Scatter 3D plot of number of PWR-WiFi wireless network users on each floor in B4 building at WUST campus
Str. 94
Rynek Energii
7. CONCLUSIONS Spatial prediction models of PWR-WiFi wireless network efficiency with using kriging estimator were presented in this paper. There were three models of spatial prediction for three consequently years: 2014, 2015, and 2016. Before prediction, preliminary and structural analysis of data had been discussed. Generally, this kind of spatial prediction could be very helpful for administrators of networks. Raster maps show the spread of good signal from Access Points because there are more users connected to the
Nr 2(135) - 2018
wireless network. It could be valuable to see efficiency and capacity of network on this kind of map. In future, Author plan to perform spatial prediction of PWR-WiFi wireless network with using more parameters like channel utilization. Models of prediction will be performed with using not only geostatistical estimation (Kriging) methods but also simulation methods (Turning Bands, Sequential Gaussian Simulation). Moreover, author will be trying create 4D (space-time) model of wireless network prediction.
REFERENCES [1] http://gs.statcounter.com/press/mobile-and-tablet-internet-usage-exceeds-desktop-for-first-time-worldwide, available and checked on 19.11.2017 [2] Ryo Hamamoto, Chisa Takano, Hiroyasu Obata, Kenji Ishida, Improvement of Throughput Prediction method for Access Point in Multi-rate WLANs Considering Media Access Control and Frame Collision, Third International Symposium on Computing and Networking (CANDAR), 2015, pp. 227-233 [3] Indika Sanjeewa Abeywickrama Dhanapala, Ramona Marfievici, Sameera Palipana, Piyush Agrawal, Dirk Pesch, Modeling WiFi Traffic for White Space Prediction in Wireless Sensor Networks, Local Computer Networks (LCN), 2017 IEEE 42nd Conference on, 2017. [4] Laisen Nie, Dingde Jiang, Shui Yu, Houbing Song, Network Traffic Prediction Based on Deep Belief Network in Wireless Mesh Backbone Networks, Wireless Communications and Networking Conference, 2017 IEEE. [5] Haiying Shen, Shenghua He, Lei Yu, Ankur Sarker, Prediction-based redundant data elimination with content overhearing in wireless networks, Pervasive Computing and Communications (PerCom), 2017 IEEE International Conference on. [6] R. A. Avinash, Janardhan H. R., Sudarshan Adiga, Vijeth B., Manjunath S., S. Jayashree, N. Shivashankarappa, Data prediction in Wireless Sensor Networks using Kalman Filter, Smart Sensors and Systems (IC-SSS), International Conference on, 2017. [7] Wackernagel H. Multivariate Geostatistics: An Intr. with Apps. Springer-Verlag Berlin Heidelberg, 2003. [8] Chile J-P, Delfiner P. Geostatistics: Modeling Spatial Uncertainty, Wiley, 2012. [9] R Core Team (2017). R: A language and environment for statistical computing. R Foundation for Statistical Computing, Vienna, Austria. URL https://www.R-project.org/ [10] Renard D., Bez N., Desassis N., Beucher H., Ors F., Freulon X. RGeostats: The Geostatistical R package 11.1.1 MINES ParisTech / ARMINES. Free download from: http://cg.ensmp.fr/rgeostats
PRZESTRZENNE MODELE PREDYKCJI WYDAJNOŚCI SIECI BEZPRZEWODOWEJ ESTYMOWANE METODĄ KRIGINGU Słowa kluczowe: predykcja WiFi, wydajność sieci bezprzewodowej, metoda krigingu, punkty dostępowe Streszczenie. Obecnie przewagę ruchu w Internecie stanowią sieci bezprzewodowe ze względu na swobodę dostępu jaką oferują użytkownikom. W związku z tym, wskazane jest zwrócenie większej uwagi na wydajność sieci bezprzewodowej i znalezienie odpowiednich metod, które mogłyby posłużyć do prognozy wydajności takiej sieci. W pracy została zaproponowana przestrzenna (3D) prognoza sieci bezprzewodowej. Dane do badań zostały zgromadzone z sieci WiFi z otwartym dostępem o nazwie PWR-WiFi zlokalizowanej w budynku znajdującym się na kampusie głównym Politechniki Wrocławskiej w Polsce. Modele przestrzennej predykcji wydajności rozważanej sieci bezprzewodowej zostały obliczone za pomocą estymacyjnej metody krigingu zwyczajnego. Anna Kamińska-Chuchmała, Ph.D. Eng., Assistant Professor, Faculty of Computer Science and Management, Wrocław University of Science and Technology, Wybrzeże Wyspiańskiego 27, 50-370 Wrocław, Poland, e-mail:
[email protected]