used in Brazilian soil surveys (Oliveira et al., 1992) and Soil Taxonomy Keys (Soil. Taxonomy, 1992). At local scale, a systematic soil sampling scheme was used ...
Spatial variability of soil properties affected by agriculture at different scales in Central Brazil COUTO Eduardo (1), KLAMT Egon (2), STEIN Alfred (1) Departamento de Solos e Engenharia Rural, Universidade Federal do Mato Grosso, 78 060-900 Cuiabá, Brazil (2) Departamento de solos, Universidade Federal do Rio Grande do Sul, 90 001-970 Porto Alegre, RS, Brazil (3) ITC, PO Box 6, 7500 AA Enschede, The Netherlands Introduction Reserves of potassium are low in the deeply weathered soils of Mato Grosso state in Central Brazil, and deficiencies have been reported (Lopes and Cox, 1977; Couto et al., 1990). Leaching of potassium in soils with low cation exchange capacity is intense, specially during the rainy season. Similarly, the sum of bases (SB, calculated as Ke+Cae+Mge) is below the critical level for plant nutrition in the majority of soils. Together with high Al-saturation, it represents the major constraints for plant root development as reported by Lopes and Cox (1977). In large areas, as in the present study, grouping soils into homogeneous units is useful. Soil units are considered suitable for management systems and may provide information on the spatial interplay of the soil-forming process (Yost et al., 1982). In this area soil units are not suitable for quality evaluation, such as for land use planning, because information is obtained from large-scale soil surveys (Radambrasil 1982). Moreover, values for soil properties are extrapolated for the majority of locations from a few modal profiles only. Therefore, it is crucial to understand the variability of soil properties at a regional scale to estimate changes in Ke and SB affected by agriculture. In the same way, it is crucial to study the soil variability in a local scale to estimate changes in soil properties affected by agriculture. Understanding the spatial distribution pattern of soil properties is also important to determine soil constraints to plant nutrition and appropriate management of soil resources in recently cultivated areas. This study focused on the spatial variability of major constraints for plant production which are pH, available phosphorus, exchangeable potassium, sum of bases (SB), content of manganese and zinc ) according to Lopes and Cox (1977) and Couto et al.(1990) in a Rhodic Haplustox (the most important soil under cultivation. The study area selected is a crop field under a center-pivotirrigated system intensively managed for 14 years. Spatial variability can be partitioned into random and systematic based on the source of the error that produces the variation (Wilding and Drees, 1983). The distinction between systematic and random variation will likely be scale dependent. For example, classification at the sub-soil level may be systematic variability in a small-scale soil survey, but random variation at reconnaissance level. Random variation, on the other hand, may originate from processes of soil formation, human activities, soil fauna and weather influences. The precise cause is either unknown or
2
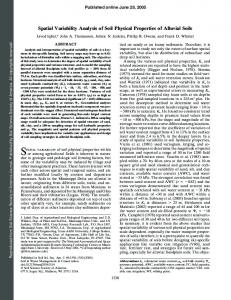
difficult to model as an explanatory variable. In general, the systematic variability of natural or undisturbed soils in large areas of land is expected to be larger than the random variability, because obvious relations with the landscape exist and other sources such as human influences are largely absent. A further distinction can be made between variation caused by differences of properties according to their spatial position, and variation caused by nonspatial sources, such as measurement error. The first is a function of the distance between observations and may be modeled by geostatistics, the second of the location itself. Geostatistics, originally used in the mining industry, has proven useful to sustainability studies, e.g. for characterising and mapping spatial variation of soil properties. Common procedures include characterisation and modelling of spatial variability, estimating values at unvisited locations, spatial simulations of random fields and optimisation spatial sampling (Cahn et al., 1994). Geostatistical methods are mainly applied to soil chemical properties over distances of metres or tens of metres (Trangmar et al, 1985) with some applications as well to larger areas (Yost et al., 1982). At a regional scale it is useful to describe spatial variability and relate soil to land use parameters. The objectives of the current study at regional scale are: (i) to identify, the variation of chemical soil properties affected by agriculture and relate it to the main soil classes; (ii) to determine the structure of spatial dependence of exchangeable potassium and sum of bases (SB) over long distances by means of within-strata variograms. At local scale, the objectives are : (i) to identify, the variation of important chemical and physical soil properties affected by agriculture. (ii) to determine the structure of spatial dependence of clay content, pH, available phosphorus, exchangeable potassium, sum of bases (SB), manganese and zinc content in a Rhodic Haplustox in crop field intensively managed for 14 years under a center-pivot irrigated system. Material and Methods At regional scale, land use types were defined by means of satellite image interpretation, whereas physiographic units identified by using plane-altimetric, geomorphologic, geological and soil maps. The area was checked during a fifteen days field trip and the major representative areas were selected. Actual land use was recorded. Sixtyseven soil samples were taken in different physiographic units. Observations were made on the A and B horizons by means of augering. Sample locations were georeferenced using a Trimble-GPS with a 15 m accuracy. The soil profiles were described according to standard procedures (De Lemos and Dos Santos, 1984) and classified according to the classification used in Brazilian soil surveys (Oliveira et al., 1992) and Soil Taxonomy Keys (Soil Taxonomy, 1992). At local scale, a systematic soil sampling scheme was used, in which sampling points were located at regular intervals of 167m in the center-pivot irrigated system, in such a way that it was possible to capture the soil variability at one 1m interval (Figure 1). Soil samples were taken at 0-20 and 20-40cm depths. The soil samples were analyzed according Embrapa (1979). The statistical approach was two-fold. First, classical statistics was applied to identify the soil variability affected by land use by Systat package (Wilkson, 1992). Next, geostatistical methods were applied to analyze the short distance variability (Webster, 1985). The variograms were estimated by SPATANAL and SPATIN software (Stein &
3
Staritsky, 1993) and the models fitted by WLSFIT (Heuvelink, 1993) and DISCO softwares ( Finke & Stein, 1992).
Figure 1. Soil sampling scheme in the center-pivot irrigated system (I, II, III, and IV refers to the stratifieds). Results and discussion Table 1 summarizes the statistics for the regional scale. The A horizon presents significantly higher values of Ke and SB than the B horizon according to the Tukey test. Both variables are likely to be influenced by agriculture. Differences in land use, soil management and soil types, influence these properties, mainly in the A horizon. The high mean Ke value in the A horizon can be related to mobilization by periodic burning during the dry season. This is an almost universal practice of grassland management for cattle raising, because farmers do not utilize any source of chemical fertilization (Sanchez, 1976). For both Ke and SB the A horizon shows the highest mean values for areas used with cultivated pasture, whereas Ke shows significant differences for the original vegetation. Soil parent material, stage of weathering and soil management practices such as periodic burning, liming, fertilization through mechanized operations and similar histories of cultivation, all contribute to increase the concentration and to distribute more uniformly Ke, Cae and Mge over the area (Lopes and Cox, 1977; Couto et al., 1990). Because these yield the SB, a decrease of the CV is observed. Land use in this area has modified deeply the properties of these soil classes (Couto et al., 1990).
4
Geostatistics were applied to analyze soil spatial variability. The unstratified variogram of Ke follows a Gaussian model and presents spatial dependence for both horizons (Figure 3). Table 1. Summary statistics for Ke and SB in the two horizons, stratified according to different land use and soil types. Hor Ke Total
N Mean* cmol(+)kg-1 6 0.15 a 7 0.07 b 4 7 1 0.17 ac 2 0.20 a 3 0.05 bc 8 9
A B
Annual crops Pastures Original vegetation
A
SB Total
Sd
CV
Min
Max
0.15 0.09
0.86 1.15
0.02 0.01
0.51 0.33
0.15 0.16 0.02
0.89 0.79 0.40
0.03 0.03 0.02
0.51 0.51 0.08
A B
6 1.58 a 1.49 0.95 0.23 7.69 7 0.82 b 0.90 1.10 0.21 4.25 4 7 Annual crops A 1 1.94 a 1.40 0.72 0.33 4.91 Pastures 2 1.83 a 1.69 0.93 0.23 7.69 Original vegetation 3 0.42 b 0.14 0.34 0.23 0.68 8 9 Mean values followed by the same letter in the columns, do not differ significantly at 0.05 level (Tukey).
The A horizon shows spatial dependence with a range of 13.5 km, and the B horizon a range of 8.4 km. The nugget effect was equal to 0.013 (cmolc kg-1)2 for the A horizon and to 0.002 (cmolc kg-1)2 for the B horizon. The nugget effect for the B horizon is approximately 6 times lower than for the A horizon. Different soil management practices adopted by farmers, including type, amount and incorporation of fertilizers, affect the chemical soil properties in the A horizon, causing the larger nugget effect in this horizon. Also, the effect of fertilization of annual crops as well as burning the grass in cattle farms, being the source of Ke in these
A horizon
0,04
13
0,010
81
0,03
138
89 123
0,008
(h)
101
264
0,02
60
144
37 272 266
(h)
B Horizon
0,012
67
125
143
0,006
60
0,004
28
72
87
31
0,01
0,002
Ke 0,00 0
20
40
60
80
Ke
0,000
100
0
20
40
distance (km )
60
80
100
distance (km)
2,00
4,0
13 37
1,50
3,0
60
89 266 144
81 123
(h)
(h)
272 67
101
2,0
1,00
72
28
125
31
60
143
87
264 138
0,50
1,0
SB
SB
0,00
0,0 0
20
40
60
distance (km)
80
100
0
20
40
60
distance (km)
80
100
5
agro- Figure 3. Variograms of Ke and SB for the A and B horizons for the regional scale. ecosystems, affects more the A horizon than the B horizon. In general, natural or undisturbed horizons would be expected to have a larger systematic than random variability (Upchurch and Edmonds, 1991). The variogram for SB showed a nugget effect of 1.33 (cmolc kg-1)2 for the A horizon and of 0.65 (cmolc kg-1)2 for the B horizon (Fig. 3), which indicates that there is a source of spatial variation with a range much smaller than the smallest sampling interval (Webster, 1985). Because SB is a sum of concentrations (Ke + Cae + Mge), the error is likely to be large. At local scale , detailed examination of the frequency distribution related to the stratifieds in the center-pivot, considering the critical level established for this region (Lopes and Cox,1977), showed that all soil properties in this scale presented local deficiency (Figure 4). The results for the surface horizon (0-20cm) showed that 16%, 14%, 7.5 %, 25%, 95% and 1.5 % of the samples showed presented values below the critical level, respectively for pH, Ke, SB, P, Mn and Zn distributed in different stratifieds, confirming that fertilizers application and/or soil tillage were not efficient in the fertilizers distribution.
21 samples ( 15.9% )
Quadrants
SB < 2,15 cmol/kg
Ke < 0,15 cmol/kg 18 samples ( 13.7% )
pH < 5,0
Quadrants
10 samples ( 7.5% ) Quadrants
3 (11.11%)
2 (10.00%)
2 (14.29%)
4 (16.67%)
1 (20.00%)
4 (23.81%)
2 (33.33%) 4 (30.00%)
1 (28.57%)
3 (33.33%)
1 (38.89%) 3 (40.00%)
Zn < 1,0 mg/kg Mn < 5,0 mg/kg
P < 10 mg/kg 33 samples( 25% )
125 samples (94.7%)
Quadrants
Quadrants
2 (15.15%)
1 (22.40%)
Quadrants
2 samples ( 1.5% )
1 (0.00%) 4 (0.00%) 2 (50.00%)
3 (18.18%) 4 (24.00%)
1 (33.33%) 3 (25.60%)
3 (50.00%) 4 (33.33%)
2 (28.00%)
Figure 4. Percentage of soil samples below the critical level in the surface horizon (0 - 20cm), considering the different stratifieds in center-pivot irrigated Table 2 presents only the variograms of the soil properties in which the ratios VDE 50% and SSD/SST 0.50 (see comments below Table 2). Based on these criteria, the
6
results showed that the majority of soil properties showed hig variability. The spatial behavior varied in function of type of stratification, soil depth and soil property. Considering, for example, the unstratified variograms, the results showed that the fitted variograms for the superficial horizon was two times higher than the subsuperficial horizon. It is interesting to say that the high frequency of variograms exhibiting high spatial dependency was not associated to low CV values. The majority of soil properties in this study showed similar CVs. In the same way, the presence of pure nugget effect was not associated to high values of CV. The clay and manganese content were the soil properties that showed the highest frequency of fitted variogram. For the clay content this behavior is expected, considering that the centerpivot is on strongly weathered soil (Rhodic Haplustox). For t manganese, the generalized deficiency in whole pivot was very uniform between the stratifieds of the center-pivot irigated system (Figure 4). Table 2. Variogram parameters for the soil properties at regional scale Propr.
Depth (cm)
Stratification/VariogramCo model Quadrant
c
Sill
VDEa Range (m.) SSD/SSTb
Clay Clay Clay Clay Clay Clay Clay
0-20cm 0-20cm 0-20cm 0-20cm 20-40cm 20-40cm 20-40cm
unstratified 1 4 stratified stratified 2 unstratified
gaussian gaussian gaussian gaussian gaussian linear gaussian
486,000 144,000 331,000 452,000 694,000 428,000 622,000
2250,000 1220,000 1300,000 2340,000 2780,000 5,050 3240,000
2736,000 1364,000 1631,000 2792,000 3474,000
82 89 80 84 80
347 321 230 397 439
3862,000
84
425
0,07 0,16 0,22 0,15 0,07 0,31 0,05
Mn Mn Mn Mn Mn
0-20cm 0-20cm 0-20cm 0-20cm 20-40cm
4 stratified 3 unstratified stratified
spherical gaussian gaussian spherical exponential
0,839 0,916 0,590 0,873 0,250
1,900 1,330 1,860 1,460 0,330
2,739 2,250 2,450 2,333 0,570
69 59 76 63 57
416 202 230 385 412
0,20 0,01 0,11 0,09 0,29
PH PH PH (log pH) PH (log pH)
0-20cm 0-20cm 20-40cm 20-40cm
stratified unstratified 4 1
exponential spherical gaussian gaussian
0,053 0,055 0,00017 0,00023
0,165 0,071 0,00022 0,00027
0,218 0,126 0,00039 0,0005
76 56 56 54
816 631 201 216
0,21 0,12 0,40 0,26
P (log P) 0-20cm 4 SB 0-20cm unstratified SB (log SB+1) 20-40cm 4
linear 0,0750 exponential 0,600 gaussian 0,004
0,00019 0,630 0,006
1,230 0,010
51 58
188 197
0,37 0,23 0,40
Zn (log Zn +1) 20-40cm 4
exponential 0,005
0,010
0,015
62
59,5
0.50
VDE= 100 –(Co/c*100); bSSD/SST: ratio of the square sum of deviances to the total sum of squares to quantify the fit of a variogram model. A value close to 0 gives an excellent fit, a value close to 1 a poor fit. a
Conclusions At regional scale, the values of both soil properties studied are influenced by agriculture and differences in land use. Soil types and soil management are major factors, especially in the A horizon. The highest Ke and SB values are found in the A horizon within cultivated pastures. Mean values differ significantly at 0.05 level (Tukey) for land use and soil classes in the A horizon for Ke and SB. Ke in particular, shows a well developed spatial dependence and reveals anisotropy for disturbed and undisturbed horizons. The variables Ke and SB, analyzed at regional scale, are easily determined in soil laboratories. Because of their importance to identify soil constraints to plant production they
7
are useful as predictive indicators related to soil quality for sustainable management. The use of geostatistics in a traditional soil fertility survey and exploratory soil survey was essential to determine the spatial soil variability. This may be used in turn to guide anticipatory planning soil management, by decision-makers. At local scale , the majority of soil properties showed high variability. pH, organic matter and clay originated the lowest CVs in the soil under center-pivot irrigated system in both depths studied. The range of spatial dependence decreased with depth in soil under center-pivot irrigated system, showing the presence of anisotropy in the soil profile .
References Cahn, M.D., Hummel, J.W. and Brouer, B.H., 1994. Spatial analysis of soil fertility for sitespecific crop management. Soil Sci. Soc. Am. J. 58: 1240-1248. Couto, E.G., Higa, N.T., Filipaldi, B.P, Ayres, R.M. and Lobo F.A., 1990. O uso da terra e o garimpo na bacia do Rio São Lourenço, Malo Gross: Reflexos no ambiente. FEMA/UFMT, Cuiabá. De Lemos, R.C. and Dos Santos, R.D., 1984. Manual de descrição e coleta de solo no campo. 2. ed. SBCS/SNLCS. Embrapa, 1979. Manual de métodos de análise de solo. Serviço Nacional de Levantamento e Conservação do Solo. Rio de Janeiro. Heuvelink, G. B. M. Wlsfit software version 3.5. Utrecht, Geographical Institute RUU, 1993. Lopes, A. and Cox. F.R., 1977. A survey of the fertility status of surface soils under "Cerrado vegetation" in Brazil. Soil Sci. Soc. Am. J. 41: 742-747. Oliveira. J.B., Jacomine, P.K.T., and Camargo, M.N., 1992. Classes gerais de solos do Brasil: guia auxiliar para seu reconhecimeto. FUNEP, Jaboticabal. Radambrasil, 1982. Levantamento de Recursos Naturais - Folha SD.21 - Corumbá -Volume 27. MMESG, Rio de Janeiro. Sanchez, P.A., 1976. Properties and management of soils in the tropics. John Wiley & Sons, New York. Soil Survey Staff., 1992. Keys to the Soil Taxonomy, 5th edition. SMSS technical monograph No. 19. Pocahontas Press, Blacksburg. Stein, A. & Staritsky, I. G. SPATANAL , SPATIN and OPTIM Software. Wageningen, Wageningen Agricultural University, 1993. Trangmar, B.B., Yost, R.S. and Uehara, G., 1985. Application of geostatistics to spatial studies of soil properties. Adv. Agron. 38: 45-94. Wilding, L.P., and Drees, L.R., 1983. Spatial variability and pedology. In: L.P.Wilding, N.E. Smeck, and G.F. Hall Editors), Pedogenesis and Soil Taxonomy. I. Concepts and Interactions. Elsevier, Amsterdam. pp. 83-116. Yost, R.S., Uehara, G. and Fox, R.L., 1982. Geostatistical analysis of soil chemical properties of large areas. I. Semi-variograms. Soil Sci. Soc. Am. J. 46: 1028-1032.
8