Spatial Variability of Soil propertieS in an agrarian
Recommend Documents
recent Alqueva dam construction. Soil pH, electrical conductivity (EC), organic matter (OM), hydraulic conductivity and soil texture were analyzed in soil samples ...
Slovak Republic; e-mail: [email protected]. Abstract ... Key words: ecological farming, physical properties of soil, bulk density, porosity, maximum capil-.
b St. Johns Water Management District, Palatka, FL, United States ... response properties with fine-scale spatial autocorrelation; (ii) stable, slow response prop-.
Oct 10, 2008 - (e-mail: [email protected]). Spatial ... application in predicting surface map of ... In this study, spatial variation of bulk density organic.
Austin Cary. Memorial. Forest .... 3, 6, 9, 12, 15, 20, 25, 30, 35, 40, and 50) were obtained 1,000 ..... Forest Plantation (Austin Cary Memorial Forest). Property.
(2002) watched the infiltration of dye tracer (methylene blue) on small plots in sandy and silty loams under conventional tillage and minimum tillage. They found ...
Huot et al., 2017). Nevertheless, the heterogeneity of soils and vegetation within functional zones is also high and depends on both land-use history and current ...
evaluate the nutrient contents of apple leaves of the same sites from sub-division Dheerkot, Azad ... The diagnosis of apples ..... Soil available P (SAP, mg kg-1).
Soil Biology & Biochemistry 39 (2007) 2621â2627. Variability in soil properties at different spatial scales (1 mâ1 km) in a deciduous forest ecosystem. $. Charles ...
Jun 28, 2005 - Javed Iqbal,* John A. Thomasson, Johnie N. Jenkins, Phillip R. Owens, .... Jenkins, USDA-ARS, Crop Science Research Lab., P.O. Box 5367,.
Jul 12, 2017 - 80°56'45.03"E and covers 4,949 km2 areas, which comes under Kymore Plateau and Satpura. Hills Agro Climatic Zone (Zone-VII).The valley in.
management zones could help manage the in-field variability of yield- ies. .... Trak Professional1 software (Fleming et al., 1999). This pro- ..... Good, P. 2000.
ASSESSMENT OF SOIL CHEMICAL PROPERTIES AND RICE YIELD IN ... Fertilization based on soil fertility may also lead to reduced fertilizer inputs.
71.04. 0.95. K (meq/100g). 0.16. 0.092. 0.230. 0.038. 23.63. 0.20. S (mg kg-1). 18.41. 6.52. 39.26. 7.23. 39.27. 0.74. Spatial variation in soil chemical properties.
5. UFRRJ - Graduando em Engenharia Agronômica. *Corresponding author . ABSTRACT: ... do solo e das partÃculas e retenção de água a 10, 80 e 1500 kPa. EstatÃstica ..... 80. 90. 100. Distance (m). Water retention at 80 kPa. (cm3 cmâ3). 80 kPa .
used in Brazilian soil surveys (Oliveira et al., 1992) and Soil Taxonomy Keys (Soil. Taxonomy, 1992). At local scale, a systematic soil sampling scheme was used ...
Apr 9, 2015 - removal is crucial to create more accurate prediction maps in order to justify an assumption of normality. The interpolation maps for some ...
Apr 9, 2015 - derstand the current spatial variability in the Alqueva region. Facing the ... The construction of the Alqueva dam in a semiarid area of southern ...
ty (ECa) in soil surface horizons (0â30 cm). ... Depth [cm] ..... nano za pomocÄ metody TDR aparatem Field Operated Meter â Easy Test FOM/mts w 49 punk-.
Influencia de la maquinaria agrÃcola sobre la variabilidad espacial de la compactación del suelo. Aplicación de la metodologÃa geoestadÃstica-fractal. PhD thesis ...
Soil compaction is an inevitable consequence of forest harvest operations that can vary in intensity and distribution. Machine movements are highly dispersed ...
Keywords: Soil compaction, preconsolidation pressure, shear stress, sugar ... for sugar cane plant development has been causing irreversible damage to the ...
penetrometria: Novos equipamentos e amostragem correta. Revista Brasileira de Engenharia AgrÃcola e Ambiental. 16(5):584-590. Nagahama HJ, Cortez JW, ...
variability on soil liquefaction, Griffiths and Fenton (1993), Dham and Ghanem (1995), Fen- ton and Griffiths (1996) on seepage through spatially random soils, ...
Spatial Variability of Soil propertieS in an agrarian
Spatial Variability of Soil Properties in an Agrarian Reform Settlement James Ribeiro de Azevedo(1)*, Célia Regina Paes Bueno(2) and Gener Tadeu Pereira(3)
(1)
Universidade Federal do Maranhão, Centro de Ciências Agrárias e Ambientais, Chapadinha, Maranhão, Brasil. Universidade Estadual Paulista, Faculdade de Ciências Agrárias e Veterinária, Departamento de Solos, Jaboticabal, São Paulo, Brasil. (3) Universidade Estadual Paulista, Faculdade de Ciências Agrárias e Veterinária, Departamento de Ciências Exatas, Jaboticabal, São Paulo, Brasil. * Corresponding author. E-mail: [email protected] (2)
ABSTRACT The study of soil chemical and physical properties variability is important for suitable management practices. The aim of this study was to evaluate the spatial variability of soil properties in the Malhada do Meio settlement to subsidize soil use planning. The settlement is located in Chapadinha, MA, Brazil, and has an area of 630.86 ha. The vegetation is seasonal submontane deciduous forest and steppe savanna. The geology is formed of sandstones and siltstones of the Itapecuru Formation and by colluvial and alluvial deposits. The relief consists of hills with rounded and flat tops with an average altitude of 67 m, and frequently covered over by ferruginous duricrusts. A total of 183 georeferenced soil samples were collected at the depth of 0.00-0.20 m in Plintossolos, Neossolo and Gleissolo. The following chemical variables were analyzed: pH(CaCl2), H+Al, Al, SB, V, CEC, P, K, OM, Ca, Mg, SiO2, Al2O3, and Fe2O3; along with particle size variables: clay, silt, and sand. Descriptive statistical and geostatistical analyses were carried out. The coefficient of variation (CV) was high for most of the variables, with the exception of pH with a low CV, and of sand with a medium CV. The models fitted to the experimental semivariograms of these variables were the exponential and the spherical. The range values were from 999 m to 3,690 m. For the variables pH(CaCl2), SB, and clay, there are three specific areas for land use planning. The central part of the area (zone III), where the Plintossolos Pétricos and Neossolos Flúvicos occur, is the most suitable for crops due to higher macronutrient content, organic matter and pH. Zones I and II are indicated for environmental preservation. Keywords: geostatistics, soil chemical and physical properties, soil management.
Received for publication on March 6, 2015 and approved on July 21, 2015. DOI: 10.1590/01000683rbcs20150148
R. Bras. Ci. Solo, 39:1755-1763, 2015
1756
James Ribeiro de Azevedo et al.
RESUMO: Variabilidade Espacial de Atributos do Solo em um Assentamento de Reforma Agrária O estudo da variabilidade de atributos químicos e físicos do solo é muito importante para realizar seu manejo de forma adequado. Este trabalho objetivou avaliar a variabilidade espacial de atributos do solo no assentamento Malhada do Meio, para subsidiar o planejamento do uso do solo. O assentamento Malhada do Meio, localizado em Chapadinha, MA, possui uma área de 630,86 ha. A vegetação é de Floresta Estacional Decidual Submontana e Savana Estépica. A geologia é formada por arenitos e siltitos da Formação Itapecuru e por Depósitos Coluvionares e Aluvionares. O relevo é representado por colinas de topos arredondados e planos, com altitude média de 67 m, e frequentemente recobertos por cangas ferruginosas. Coletaram-se 183 amostras de solo georreferenciadas, na profundidade de 0,00-0,20 m, em Plintossolos, Neossolo e Gleissolo. Foram analisadas as variáveis químicas: pH(CaCl2), H+Al, Al, SB, V, T, P, K, MO, Ca, Mg, SiO2, Al2O3 e Fe2O3; e as granulométricas: argila, silte e areia. Realizaram-se análises de estatística descritiva e geoestatística. O coeficiente de variação (CV) foi alto para a maioria das variáveis, com exceção de pH, com CV baixo, e da areia, com CV médio. Os modelos ajustados aos semivariogramas experimentais dessas variáveis foram o exponencial e o esférico. Os valores do alcance variaram de 999 a 3.690 m. Para as variáveis pH(CaCl2), SB e argila, há ocorrência de três zonas específicas para o planejamento do uso do solo. A parte central da área (zona III), onde ocorrem os Plintossolos Pétricos e Neossolos Flúvicos, é a mais indicada para cultivos agrícolas, devidos aos maiores teores de macronutrientes, matéria orgânica e pH. As zonas I e II são indicadas para preservação ambiental. Palavras-chave: geoestatística, atributos químicos e físicos, manejo do solo.
INTRODUCTION From 1900 to 2011, 8,865 agrarian reform settlement projects were implemented in Brazil, encompassing an area of 87,559,858.95 ha, benefitting 931,730 families (Brasil, 2012). In Maranhão State, 952 settlement projects were implemented in an area of 4,600,598.87 ha, with 124,288 families settled. Malhada do Meio, one of those settlements, practices the slash and burn system, and there is no plan for soil use and management. Land use without adequate planning leads to soil impoverishment and low crop yield, which results in a decline in the socioeconomic and technological level of the rural population (Rampim et al., 2012). Therefore, to undertake soil planning for use and management purposes, it is important to evaluate how the chemical and physical properties of the soil are distributed in a determined area. A tool often used to analyze how soil properties are spatially distributed in an area is geostatistics. It is effective for understanding the magnitude and structure of the spatial variability of the physical and chemical properties (Wojciechowski et al., 2009). The study of spatial variability of soil chemical and physical properties is important for agriculture because it aims to minimize the effects of variability on crop yield, optimizing the agricultural production systems (Molin, 2000). In areas of native vegetation, the use of spatial variability may be found in the studies of Bekele and Hudnall (2006), Wojciechowski et al. (2009), and Skorupa et al. (2012). Cavalcante et al. (2007), Nascimento and Landim (2009), and Silva R. Bras. Ci. Solo, 39:1755-1763, 2015
Neto et al. (2011) evaluated spatial variability in different forms of soil use and management, and Carvalho et al. (2010) analyzed variability relation to environmental factors. In agrarian reform settlements, the spatial variability of soil properties for purposes of agricultural use has not been the object of many studies, as in the case of the study undertaken by Valladares et al. (2006), who analyzed the spatial relation between the technical effectiveness of the rice crop and some properties related to soil fertility. The aim of this study was to apply geostatistical techniques of soil chemical and physical properties to the agrarian reform settlement of Malhada do Meio in an area of native vegetation in the municipality of Chapadinha, Maranhão, Brazil, to assist in soil use planning.
MATERIAL AND METHODS The study was carried out in the agrarian reform settlement of Malhada do Meio, located in the municipality of Chapadinha, MA, Brazil, with central coordinates (UTM) of 9585546 W and 661510 S, with a mean altitude of 67 m and an area of 630.86 ha. The geological substrate consists of sandstones, siltstones, and ferruginous duricrusts of the Formação Itapecuru (Itapecuru Formation - Upper Cretaceous) and of sands, colluvial waterway of the Depósitos Aluvionares and Coluvionares (alluvial and colluvial deposits - Cenozoic-Quaternary-Holocene) (Vasconcelos et al., 2004). The relief is rounded
Spatial Variability of Soil Properties in an Agrarian Reform Settlement
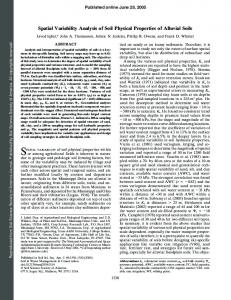
top hills of low altitude (Figure 1), frequently covered over by ferruginous duricrusts of varied dimensions. The predominant soil is Plintossolo Pétrico Concrecionário êndico latossólico, followed by Plintossolo Argilúvico Distrófico abrúptico gleissólico, Neossolo Flúvico, and Gleissolo Háplico Tb Distrófico cambissólico, classified according to Santos et al. (2013). Vegetation, according to the classification of Veloso et al. (1991), is Floresta Estacional Decidual Submontana (seasonal submontane deciduous forest) (the largest area), with the occurrence of Babassu palm; and Savana Estépica (steppe savanna) (Park and Tree), with the occurrence of Carnauba palm. Climate in the region according to the Thornthwaite (1948) classification is C 2WA’a’, with annual rainfall from 1,600 to 2,000 mm, and mean annual temperature ranging from 26 to 27 ºC (Maranhão, 2002). In Malhada do Meio, there are 38 farm families that acquired the area through land credit. The production system consists of intercropping of cassava, rice, corn, and common bean; the manufacture of cassava meal; raising of small to medium-sized animals in an extensive manner (poultry, pigs, and sheep); extraction of babassu palm (most important); hunting wild animals (agouti, paca, and armadillo); and fishing. The cropped area is approximately 1-ha per family, which consists of slashing and burning the vegetation, construction of a fence to avoid the entrance of domestic animals, planting, hoeing, and, or, application of herbicide, and harvest. After two years, when rice, corn, common bean, and, finally, cassava root have been harvested, the area is abandoned and remains fallow. After some years, the vegetation is once more cut down for planting new crops. The families grew rice for three consecutive years in an area of 65 ha with the use of mechanization, lime, and fertilizers, but the area was abandoned more than five years ago due to lack of technical assistance and credit.
9586500
In external validation, the values estimated by Ordinary Kriging (OK) were compared to the values observed in the 16 sampling points. To do so, the equations of the Root Mean Square Error (RMSE)
N
9584500
9584500
659000 660000 661000
Initially, the variability of the data was analyzed by descriptive statistics, with calculation of the mean, median, maximum, minimum, standard deviation, asymmetry, kurtosis, and coefficient of variation, to identify possible atypical values and the manner of distribution of the variables. Spatial dependence was modeled by fitting the theoretical mathematical models possible for the experimental semivariograms. The choice of these models was mainly based on cross validation, on the lowest RSS (Residual Sum of Squares), and on the greatest coefficient of determination (R2). In cross validation, all the modeling decisions of the semivariogram (choice of model, direction, and number of neighbors) were tested. Having defined the models, the data were interpolated (ordinary kriging) to create spatial pattern maps.
9585500
9585500
9583500
Soil samples were collected and georeferenced at the depth of 0.00-0.20 m in an irregular grid, with 92 points at a distance of 300 m and in five densifications, distributed in a manner representative of the total area, and 91 points at a distance of 150 m, for a total sampling network of 183 points. Sixteen more points were sampled for external validation (Figure 2). The pH values (in CaCl2), P (resin method), K, Ca, Mg, H+Al, and Al were determined by the methods of Raij et al. (1987), OM determined according to Raij et al. (2001), and the values of SiO2, Al2O3, and Fe2O3 by the method of Embrapa (1997). Soil particle size analysis was carried out by the pipette method, using a 0.1 mol L-1 NaOH solution as a chemical dispersant, and mechanical shaking at low rotation for 16 h (Embrapa, 1997). The clay fraction was separated by sedimentation, coarse and fine sands were separated by sieving, and silt was calculated by the difference.
9586500
N
1757
9583500
662000 663000
Figure 1. Elevation map with vectors of the different contour lines in the agrarian reform settlement.
659000 660000 661000 662000 663000
Figure 2. Sampling network (+) and points sampled for external validation (○) in the agrarian reform settlement.
R. Bras. Ci. Solo, 39:1755-1763, 2015
1758
James Ribeiro de Azevedo et al.
0 .5
2 1 n RMSE = ∑ Z ( Xi ) − ẑ ( Xi ) n i =1
and of the Mean Absolute Error (MAE) were used. MAE =
∑
n i =1
Z ( Xi ) − ẑ ( Xi ) n
In which n is the number of values used in the validation; z (xi) is the value of the property at point i, and ẑ (xi) is the estimated value of the property by OK at point i. Lower values of RMSE and MAE are related to greater accuracy and to greater precision in the estimates, respectively. The following programs were used: Minitab, GS+ version 9 (Robertson, 1998), and the program Surfer version 9 (Golden Software, 1999). The degree of spatial dependence (DSD) was calculated by the formula [DSD = (C0/(C0 + C1) × 100] developed by Cambardella et al. (1994), with the following classification: strong, if DSD≤25 %; moderate, if 26 %