WETLANDS, Vol. 28, No. 2, June 2008, pp. 411–422 ’ 2008, The Society of Wetland Scientists
SPATIAL VARIABILITY OF SOIL PROPERTIES IN CYPRESS DOMES SURROUNDED BY DIFFERENT LAND USES Matthew J. Cohen1, Edmond J. Dunne2, and Gregory L. Bruland3 1 School of Forest Resources and Conservation, University of Florida 328 Newins Ziegler Hall Gainesville, Florida, USA 32611-0410 E-mail:
[email protected] 2
St. Johns River Water Management District 4049 Reid Street Palatka, Florida, USA 32177
3
Department of Natural Resources and Environmental Management University of Hawai’i at Mnoa 1910 East-West Road Honolulu, Hawaii, USA 96882
Abstract: Anthropogenic activities affect self-organization in wetlands, in turn affecting spatial patterns of soil properties such as pH, nutrient concentrations, and soil organic matter content. To better understand the effects of anthropogenic disturbance in wetlands, we examined soil patterns in wetlands subject to a gradient of human impact. Four cypress domes in north Florida representing reference/ unmanaged, forest plantation, improved pasture, and urban land uses were sampled (n 5 60 site21) for soil pH, organic matter (OM), and total phosphorus (TP). Mean values varied significantly both within and among sites, with low pH, SOM, and TP at minimally impacted and plantation sites, and high values at pasture and urban sites. Within-site variability was large for SOM and TP in all sites (average coefficient of variation 5 48% and 62%, respectively), and small for pH (average CV 5 7%). Strong radial patterns for SOM and TP in minimally impacted and plantation sites were observed. In contrast, at pasture and urban sites linear/quadratic trends in pH were observed. We quantified spatial patterns by soil property for each site, observing significant structure (long range, low nugget:sill) for TP and SOM in minimally impacted and forest plantation sites. We infer a transition from endogenous to exogenous drivers with increasing anthropogenic influence. Our findings indicate that, for pH, a small number of samples (n , 3 for characterization within 10% of true mean) are needed, while more (n 5 11–33) are needed for SOM and TP; sampling density requirements increase with the scale of spatial structure. Our results allow the definition of the necessary sampling intensity and design to achieve effective monitoring. Key Words: biogeochemistry, geostatistics, isolated wetlands, Monte Carlo simulation, sampling intensity, spatial structure, variability
INTRODUCTION
wetlands where spatial patterns in soil properties have been measured, the resulting information has been useful. For example, observations of soil phosphorus (P) spatial patterns in the Everglades provided insight on the extent and severity of P enrichment zones and processes that govern the enrichment processes (Debusk et al. 1994, Debusk et al. 2001 Grunwald et al. 2006). Spatial variability in wetland soils can provide insight into underlying ecosystem processes and may itself indicate wetland condition. As such, it is important to distinguish systematic variability (i.e., pattern) from random variability and determine the relative importance of each (Stolt et al. 2001).
Wetland ecosystems are heterogeneous environments, which can exhibit substantial spatial and temporal variability in soil properties (Lyons et al. 1998, Stolt et al. 2001, Bruland and Richardson 2004, Grunwald et al. 2006). This variability can have important consequences on wetland biota and biogeochemistry. Spatial variability of wetland soils, which are a focal point for regulatory conditional assessment under the numeric nutrient criteria programs (USEPA 2000), often confounds inference about ecosystem processes (e.g., nutrient assimilative capacity) and condition (Bridgham et al. 2001, Bruland et al. 2006, Corstanje et al. 2006). In 411
412 Numerous processes can influence soil spatial patterns at a particular location (Stolt et al. 2001, Bruland and Richardson 2004). For example, Bruland and Richardson (2005) suggested that prior land-use and mitigation activities reduced soil variability, and Bruland and Richardson (2004) illustrate that wetland type may strongly affect spatial pattern. Spatial variability can also introduce uncertainty when sampling is undertaken to establish wetland soil nutrient status. Guidelines for sampling adequacy are not well integrated into assessment efforts, and the magnitude of potential errors that might arise from undersampling is largely unknown. Spatial pattern in ecosystem characteristics such as soil biogeochemical properties is of considerable interpretive importance, as pattern in soil properties responds to and integrates across the exogenous ecosystem drivers (Holling and Gunderson 2002). Examples of exogenous factors and endogenous factors that influence spatial patterns in wetland soils abound, from the endogenous factors contributing to forming ridge and slough mosaic of the central Everglades (Clark and Reddy 2003, Ross et al. 2006) and patterned fens of boreal biomes (Siegel 1983, Glaser 1987), to the strongly exogenous factors such as nutrient loading observed in WCA2A of the Florida Everglades (Richardson and Vaithiyanathan 1995, Reddy et al. 1998, DeBusk et al. 2001) and in response to tidal influence in coastal marsh systems (Adams 1963, Earle and Kershaw 1989). While the spatial pattern emerging from system self-organization is well-known (Rietkerk et al. 2004), particularly in peatlands (Belyea and Lancaster 2002) and arid areas (Klausmeier 1999), this information is rarely used in a conditional assessment framework because of the inherent complexity of establishing wetland soil spatial pattern. Cypress domes offer a useful model system for examining changes in spatial pattern in response to anthropogenic disturbance because the hydrologic drivers and wetland morphology are relatively uniform across reference sites. Domes are forested wetlands that develop within, and possibly help form (Spangler 1984), landscape depressions; they are typically round, and generally hydrologically isolated from other water bodies (Ewel and Odum 1984, Lugo 1984). Soils within cypress domes are typically very poorly drained (Coultas and Duever 1984), with hydroperiod and permeability typically decreasing with distance from the wetland center (Heimburg 1984, Haag et al. 2005). This systematic hydrologic gradient (Haag et al. 2005) strongly affects the biota, with radial zones of different
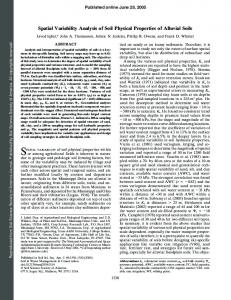
WETLANDS, Volume 28, No. 2, 2008 communities in undisturbed domes that should result in radial trends in soil properties related to hydroperiod, e.g., organic matter, soil total P (Florida’s mineral soils have extremely limited P binding capacity), and pH. Reese and Moorehead (1996) report radial spatial characteristics of soil properties (e.g., clay content) in Carolina Bay isolated wetlands (South Carolina). The specific objectives of our study were to: 1) determine surface soil (0–10 cm) characteristics of small (, 2 ha) forested wetlands (cypress domes) that were impacted by different land uses, 2) describe the soil spatial patterns of selected soil properties (soil TP, organic matter and pH), 3) determine whether land use impacts result in differing soil spatial patterns, and 4) use spatially intensive sampling to help quantify the number of soil samples required to adequately describe variability in soil properties of individual wetlands. We hypothesize that increased wetland disturbance (or development surrounding the wetland) alters soil spatial patterns, soil spatial patterns respond differently to different types of impact, and spatial patterns are soil property specific. MATERIALS AND METHODS Study Sites and Descriptions We sampled four forested wetlands (cypress domes) in Alachua County, North Central Florida (Figure 1) during spring 2006. All sites are located within Florida’s Northern Highlands physiographic province (White 1970). We selected these sites to represent a land use gradient ranging from minimally impacted to wetlands in agricultural (forest plantation; improved pasture, defined here as pastures with hydrologic and nutrient modification) and urban/residential settings (Table 1). While soil mapping units varied among sites, all were typical of isolated wetland systems with similar taxonomic properties (high SOM content, very poorly drained, siliceous), and dominated by a cypress (Taxodium ascendens) canopy. They were of equal size allowing application of the same sampling frame for exploring spatial pattern. Sampling Methods Soils were sampled along three transects in each wetland. Each transect started at the wetland center and extended outwards into the surrounding uplands (Figure 1c). The compass direction of the three transects were north, south south east, and south south west, respectively. In general, transects
Cohen et al., SPATIAL PATTERN IN ISOLATED WETLAND SOILS
413
Figure 1. Study locations in Alachua County, north central Florida (A). Sites are all in the vicinity of the City of Gainesville (B), and represent the various land uses that dominate the region. At each site 60 samples were collected from 12 Y-frame clusters (C), each consisting of five samples collected at known spacings (D).
Table 1.
Site descriptions of the four North Florida cypress domes sampled.
Site
Type
Location
Present Land Use
Odum Land
Minimal Impact
82u790.790 W 29u3697.040 N
Unmanaged, except for prescribed fire
Austin Cary Memorial Forest
Tree 82u12918.710 W Plantation 29u45959.780 N
Hague Dairy
BuckBay
Commercial Forest (Pinus elliottii ca. 15 years old)
Improved Pasture
82u25917.410 W 29u47951.190 N
Medium Density Improved Pasture
Urban
82u21912.140 W 29u43931.690 N
Medium density residential; limited storm water control
Soil Type Surrency Sand series; very poorly drained siliceous thermic Arenic Umbric Paleaquult. Pomona Sand Depressional series; very poorly drained sandy, siliceous hyperthermic Ultic Alaquod. Samsula Muck series; very poorly drained, sandy, siliceous, hyper-thermic Terric Haplosaprist.
Monteocha Loamy Sand series; very poorly drained sandy, siliceous, hyper-thermic Ultic Alaquod.
Vegetation Canopy dominated by Taxodium ascendens (Pond Cypress). Understory of Cephalanthus occidentalis and Eriocaulon spp. Canopy dominated by Taxodium ascendens. Understory dominated by Panicum hemitomon; shrub invasion at edges. Canopy dominated by Taxodium ascendens and hardwood species. No mid-canopy (cattle browsing). NW corner impacted by cattle. Understory of grazing resistant herbs. Canopy dominated by Taxodium ascendens, Liquidambar styraciflua (sweetgum), and Quercus nigra L. (water oak); understory dominated by exotics.
414 ranged between 50 and 100 meters in length. Along each of the three transects (at discrete distances), three sampling stations were established. Three other stations were randomly located and sampled within each wetland (Figure 1c). At each of the 12 stations, soil samples were collected to a depth of 10 cm. Soil samples were collected at the sampling station center and at discrete distances from the center (1, 2, 3, and 4 m) using a fixed frame, which was orientated due north (Figure 1d). The center of each sampling station was georefereneced using a survey grade differential GPS (Trimble GeoXT); the location was logged as the average of 300 observations during a 5 minute period. Coordinates were corrected during post-processing by comparison with Gainesville Regional Airport base station. At all soil sample locations, surface water depths were measured using a meter stick. Soil Sampling and Analyses In each wetland, 60 soil (0–10 cm) samples were collected using a split-spoon coring probe, pushed to a depth greater than 10 cm. Each soil section from 0–10 cm was placed in a pre-labeled airtight bag and placed on ice in a cooler. On return to laboratory, soils were stored at 4uC until preparation for analyses. Soil pH was measured in a 1:2 soil to water ratio. Soils were homogenized and plant roots greater than 2 mm in diameter were removed. Soils were then oven dried (70uC) for three days, ground, and sieved through a #100 mesh. Organic matter, as determined by loss on ignition, was measured on a two gram oven-dry sample that was ignited at 550uC for four hours. The ash residue was then dissolved in 6 M HCl (Anderson 1976) and total P was analyzed colorimetrically using a Technicon auto-analyzer (Method 365.1; USEPA 1993). Statistical Analyses Means, standard deviations, and ranges were determined for each biogeochemical parameter at each of the four different wetlands. Data distributions were tested for normality. If data were not normally distributed, they were log transformed. One-way analysis of variance (ANOVA) was used to compare soil properties among sites. A three level nested ANOVA was used to compare soil properties across site, location and soil sampling cluster and a two level analysis within each site to determine if the relative proportion of short-range (within soil sampling cluster) and long-range (among clusters) variability is different among sites. All statistical
WETLANDS, Volume 28, No. 2, 2008 analyses were performed using Statistica ver. 7.1 (StatSoft, Inc. 2005). Geostatistical Analyses Non-stationary trends in the data were examined using second order trend removal; evidence for trends was evaluated by computing the correlation between the trend surface and observations. Where trend surfaces showed a significant (p , 0.05) correlation with observed soil properties, trend removal occurred prior to semi-variance analysis and kriging. The trend character (radial vs. saddle or gradient) was noted. Semivariance analysis using ArcGIS (v 9.1 – ESRI Inc.) was used to quantify spatial autocorrelation between sampled soil cores at each individual wetland and to facilitate subsequent mapping of soil properties (Boerner et al. 1998). This analysis calculates an index of autocorrelation (the semivariance) among groups of paired samples separated by increasing distances. Empirical semivariance values were calculated for 30 equal lag classes (lag 5 2 m) from 0–60 m. The empirical semi-variance data were then fit with a spherical semi-variogram model (Webster 1985). A number of parameters were extracted from the fitted models including the nugget (the semivariance at distance zero), the sill (the y-value at which the semivariance reaches an asymptote), and the range (the distance [x-value] at which this leveling occurs). We used a system proposed by Cambardella et al. (1994) to define different classes of spatial dependence for the soil properties measured in this study that are based on the ratio of the nugget to the sill. If the nugget to sill ratio was # 25%, the soil property was considered to be strongly spatially dependent, or distributed in patches; if the ratio was between 26% and 75%, the soil property was considered to be moderately spatially dependent; and if the ratio was . 75% the soil property was considered to be weakly spatially dependent (Cambardella et al. 1994). We also determined the ratio of the sill to the sum of the sill and nugget variance (Cambardella et al. 1994). This ratio represents the proportion of the sample variance explained by the fitted semi-variogram model. In a plot with strong spatial patterns, the ratio will approach 1.0; whereas in a plot without spatial pattern, the ratio will approach 0.0 (Morris 1999). The best-fit isotropic semi-variogram model was added to any observed trends and used to map the distribution of soil properties across the site by ordinary point kriging, a form of non-linear interpolation, which provides optimal, unbiased estimates at unsampled locations (Boerner et al.
Range
(3.7–6.2) (3.9–59.0) (40–773) 5.6 6 0.5 34.0 6 10.1 497 6 131 (0–40) (4.0–5.7) (3.5–60.7) (89–3,810) 10 0.4 14.0 1,075 6 6 6 6 "
{
WD 5 standing water depth; SOM 5 soil organic matter content; TP 5 total phosphorus. No standing water observed.
19.0 4.8 22.1 1,190 (0–22) (3.7–5.6) (3.9–44.0) (40–496) 8 0.3 6.7 110 6 6 6 6 8.0 3.9 14.4 211 (12–70) (3.3–4.3) (6.4–42.2) (32–660) 15 0.2 10.3 171 6 6 6 6 34.0 3.9 19.9 213 WD (cm) pH SOM (%) TP (mg kg21)
m 6 SD Range m 6 SD Range m 6 SD
"
Monte Carlo Simulation of Soil Sampling
Range
m 6 SD
415
1998, Ettema and Wardle 2002). To evaluate the prediction efficiency of the trend + kriging estimates, the cross-validation r2 between predicted and observed was used.
Parameter{
Urban (BuckBay Mobile Home Park) Improved Pasture (Hague Dairy) Tree Plantation (Austin Cary Mem. Forest) Minimally Impacted (Odum Dome) Site
Table 2. Descriptive statistics of sampled forested wetlands (n 5 60 per site). Values are means 6 one standard deviation, (minimum, and maximum). Sites were sampled during March, 2006.
Cohen et al., SPATIAL PATTERN IN ISOLATED WETLAND SOILS
Using the 60 samples obtained from each site, a Monte Carlo resampling algorithm was developed in Microsoft Excel that allowed quantification of the effect of sample size of system characterization accuracy. Randomly resampled observations (n 5 1, 3, 6, 9, 12, 15, 20, 25, 30, 35, 40, and 50) were obtained 1,000 times from the observed soil data (n 5 60) without replacement at each site. The results of each sampling (mean, standard deviation) were recorded to estimate the uncertainty associated with each sampling intensity vis-a`-vis the overall mean value obtained from the 60 samples. The standard deviation across the 1,000 simulations was used to compute a 95% confidence interval (1.96*SE); this confidence interval can be divided by the overall site mean to provide a measure of accuracy for a given sampling intensity. For example, if the 95% confidence interval for a given sampling intensity is 110 and the overall site mean is 220, the site characterization error is 50%. While identification of acceptable site characterization error is ultimately a subjective decision, we use 10% as a benchmark for examining sampling requirements. That is, 95% of the time, measurements at that sample intensity would yield a site mean within 10% of the true mean. RESULTS Site Statistics Soils varied significantly both among and within sites. All soils were acid (pH , 6.2; Table 2); mean pH values were similar between the minimally impacted and forest plantation sites, and both were significantly lower than the pasture and urban sites (Figure 2). Soils showed widely variant SOM content, with a total population range from 3.5%– 61.0%. SOM content also varied among the domes, with the forest plantation showing significantly lower levels than the other sites, and the urban site, which had no water present at the time of sampling, showing the highest SOM concentrations. The variability of SOM within wetlands were similar between wetlands (Table 2). Soil TP was strongly variable among sites, with the minimally impacted and forest plantation sites showing low levels (,210 mg/kg for both; Table 2). The urban dome
416
WETLANDS, Volume 28, No. 2, 2008 site level variance than was observed for pH. For soil TP, the site level variance was again the largest fraction (51%); error variance was, like pH, comparatively small (9%). Geostatistical Analyses of Wetland Soil Properties
Figure 2. Mean values (6 95% CI) for A) pH, SOM (%; values divided by 10 for scale) and TP (mg/kg) and B) variance explained by site, cluster-within-site and residual levels based on nested ANOVA. Means with different letters are significantly different (p , 0.01) among sites for the same parameter based on nested ANOVA.
had levels roughly twice that, and the pasture dome had by far the greatest soil total P content (TP 1,190 mg/kg). Soil total P was most variable (CV 5 0.90) at the improved pasture site and least variable (CV 5 0.26) at the urban site, probably resulting from different enrichment mechanisms. Comparison of means and distribution of variance into components (Figure 2) showed significant (p , 0.05) site-level differences for all parameters, with minimally impacted and tree plantation sites exhibiting similar pH and TP levels, both significantly lower than the pasture and urban sites. Our nested analysis suggests that most of the variance observed for pH was accounted for by site level effects (78%); within cluster variability accounted for an additional 16% of the variability. For organic matter, the variance partitioning was markedly different. The largest variance fraction (43%) was error variance (i.e., unexplained by the site or cluster effects) suggesting that variability in this quantity occurs at finer scales than our measurements, or that measurement error confounds spatial pattern detection. Cluster level variance was also larger relative to
Trend surface analyses showed a number of significant spatial patterns in soil properties across the sites (Table 3). Trends were present for all properties with the exception of pH at the forest plantation site, and SOM and TP at the urban site. Correlation between observations and extracted trends was highly variable. The radial trend for SOM and TP was strong at both the minimally impacted and forest plantation sites (p , 0.01). Notably, radial trends were observed only at these sites. Saddle-type 2nd order trends were observed at the improved pasture site (all parameters; weak for SOM), and for pH at minimally impacted (weak trend) and urban sites. No spatial structure was observed on the residuals for SOM at the pasture site, nor for TP at the urban site (Table 2); indeed, at the urban site, spatial structure for TP was entirely absent suggesting complex enrichment patterns. The range of autocorrelation varied by site and parameter (Table 3), with generally long range (. 20 m) at the minimally impacted site, and short range (, 10 m) at the urban and pasture sites. At the forest plantation site, the range for TP and pH was long, but short for SOM. The spatial structure of the residuals (Table 3) was strong (relative structure . 50%) for pH and SOM at the forest plantation site, and for pH at both the urban and pasture sites. While for TP, structure was moderate at minimally impacted and forest plantation sites (48% and 47% respectively), the overall explanatory power of spatial models (trend + kriging) was high. The combined spatial model accounted for 77% and 68% of the observed variance, with the radial trend accounting for most of the variability. In contrast, despite strong spatial structure, the overall prediction efficiency (r2) was low for pH and SOM at the forest plantation site. The overall (i.e., trend + kriging) efficiency of spatial prediction was high for TP at both minimally impacted and forest plantation sites, and for pH at both pasture and urban sites (Table 3). The concordance between strong spatial prediction and radial patterns supports the central premise of bathymetric/hydrologic controls of soil properties under reference conditions. We selected six representative maps of soil properties at specific sites that illustrate the range of spatial distributions observed in this study
Cohen et al., SPATIAL PATTERN IN ISOLATED WETLAND SOILS
417
Table 3. Spatial variability characteristics of soil properties from the four wetland sites, ranked in order of a priori disturbance intensity. Semi-variogram parameters are for trend removed data; trend type and correlation with observations are shown. Where no parameters are reported, the semi-variogram was pure nugget. Cross-validation statistics (r2 and RPD) are for trend + kriged residuals vs. observed. Minimally Impacted (Odum Dome) {
Property pH SOM Ln[TP]
Trend Type 2nd order radial radial
Trend Correlation (p-value) 0.26 (0.04) 0.62 (, 0.01) 0.82 (, 0.01)
Nugget{ 0.019 40.64 0.09
Sill1 0.027 56.1 0.16
Range"
S:N{{
r2{{
31% 28% 48%
1.42 1.38 1.78
0.11 0.47 0.77
Rel. Structure#
39.9 41.2 32.1
Forest Plantation (Austin Cary Memorial Forest) Property pH SOM Ln[TP]
Trend Type none radial radial
Trend Corr. Coeff.
Nugget
Sill
Range
Rel. Structure
S:N
r2
0.41 (, 0.01) 0.70 (, 0.01)
0.027 12.1 0.07
0.061 35.9 0.15
14.1 5.3 32.6
56% 68% 47%
2.26 2.97 2.14
0.02 0.26 0.68
Improved Pasture (Hague Dairy) Property pH SOM Ln[TP]
Trend Type 2nd order 2nd order 2nd order
Trend Corr. Coeff.
Nugget
Sill
Range
Rel. Structure
S:N
r2
0.70 (, 0.01) 0.26 (0.03) 0.55 (, 0.01)
0.021 0.34
0.082 0.62
3.70 9.67
74% 45%
3.90 1.82
0.56 0.10 0.39
Urban (Buck Bay Mobile Home Park) Property pH SOM Ln[TP]
Trend Type 2nd order none none
Trend Corr. Coeff.
Nugget
Sill
Range
Rel. Structure
S:N
r2
0.75 (, 0.01) -
0.033 64.8 -
0.105 88.4 -
9.7 5.47 -
67% 27% -
3.18 1.36 -
0.73 0.08 -
{
- SOM 5 soil organic matter, TP 5 total phosphorus. - Semi-variance at zero separation distance. 1 - Total semi-variance. " - Distance in meters over which auto-correlation is observed. # - Relative Structure – fraction of semi-variance explained (partial sill:sill). {{ - Sill:Nugget ratio. {{ - Coefficient of determination between predicted and observed in cross-validation. {
(Figure 3). High concentrations of TP in the minimally impacted site (Figure 3A) gradually reduced with increasing distance in any direction from the wetland center. Observations of pH in the minimally impacted dome, revealed a saddle-type 2nd order trend, with two patches of high values near the dome center, and towards the southern edge (Fig 3D); note the relatively small magnitude of whole-site variance in pH. Spatial distributions of TP and pH at the pasture dome showed a markedly different pattern (Figs. 3B and 3E), with soil TP hotspots away from the dome center (saddle-type trend), and localized clusters of high concentration. Soil TP was greatest in the northwest portion of the site and decreasing generally from north to south. While the pH appears to decrease diagonally from northwest to southeast, the map is dominated by artifacts of the kriging model, which underscores the influence of small scale variability, evident in the
high within cluster variance. The radial TP pattern observed in the forest plantation site is evident (Figure 3C), although weaker than the radial pattern at the minimally impacted site. There is a strong patchy saddle-type distribution of pH at the urban dome (Figure 3F); high relative structure leads to low within-cluster variability, and the patchiness arises due to the short range of autocorrelation (Table 3). Monte Carlo Simulation Using Monte Carlo simulation to repeatedly resample observed data, we observed, unsurprisingly, that system characterization accuracy improved with increasing number of soil samples collected from each wetland (Figure 4). A modified coefficient of variation termed the characterization accuracy (defined for this work as the ratio of the standard
418
WETLANDS, Volume 28, No. 2, 2008
Figure 3. Interpolated surfaces for select soil properties: Total P (mg/kg; back-transformed after kriging Ln-normalized data) for A) minimally impacted, B) improved pasture, and C) tree plantation, and pH for D) minimally impacted, E) improved pasture, and F) urban dome. Sampling locations and observed values (dot size) are shown. Coordinate grids are in meters.
error to the mean) is shown on the Y-axis; adequate characterization accuracy is defined to occur when this metric is below 10%, although this would vary with the motivation for sampling. The effect of sample numbers in describing soil variability was affected by both site and the soil property of interest.
We estimated sampling requirements to characterize soil TP to be 9, 20, 30, and 33 for urban, forest plantation, pasture, and minimally impacted sites, respectively. For soil organic matter, trends were similar to soil TP, but sample numbers required per site were lower (Figure 4). For soil pH, many fewer samples were required for adequate characteriza-
Cohen et al., SPATIAL PATTERN IN ISOLATED WETLAND SOILS
419
Figure 5. Correlation between strength of spatial pattern (population SD 4 validation RMS error) and sample size requirements. Sites with strong spatial pattern (high values on y-axis) require larger sample sizes for similar characterization efficiency. * - Low within-site pH variability meant that 2–3 samples were sufficient to meet the 10% characterization error criterion; for illustration of the association between pH pattern and sample size, a 2% criterion is used.
DISCUSSION
Figure 4. Number of soil samples (X-axis) versus site characterization error (ratio of the standard deviation against the mean value), which is on the Y axis, for soil total phosphorus, soil pH, and soil organic matter. Site characterization error values represent data that were repeatedly resampled (1,000 times) using Monte Carlo simulation.
tion. The number of samples required for adequate (, 10% different from true mean 95% of the time) site characterization error correlates positively with spatial structure (measured using the RMS error of crossvalidation, scaled by the population standard deviation) (Figure 5); note that the sample effort for pH is to meet a 2% site characterization error criterion. Generally, as spatial structure increases (y-axis), the number of random samples required increases (xaxis); with a priori knowledge of spatial pattern, sampling requirements would presumably decline.
Despite our relatively small sample size, we observed large differences in soil properties among sites. Differences were most pronounced for pH, which followed an increasing trend with land use intensity (Table 2). TP and SOM also generally increased with increasing land use intensity; TP was greatest in the pasture site at levels (. 1,200 mg kg21), and the SOM of the forest plantation sites was lower than in the minimally impacted site. Differences between sites with respect to the three measured soil properties underscores the importance of land use in modifying soils spatial patterns in cypress domes. We infer from our observations that forest plantation activities affect soil conditions far less than improved pasture and urban land uses, particularly for soil TP and pH. Within site variability also appears to increase, most markedly for TP in the pasture site. The magnitude of spatial variability in pH, soil OM, and TP observed in this study corroborate previous studies that reported substantial spatial variability of soil properties in other wetlands (Darke and Walbridge 2000, Johnston et al. 2001, Gallardo 2003, Bruland and Richardson 2004, Bruland and Richardson 2005). Moreover, variance partitioning suggests that site level variance dominates for pH and TP; cluster level variance is also large for TP.
420 Our study suggests that the influence of landscape development intensity (sensu Brown and Vivas 2005) may be pronounced, and supports use of soil measurement for wetland conditional assessment. The relationship between disturbance intensity and pH appears to be monotonic, increasing with landscape development intensity in the surrounding buffer. The response of TP to disturbance is nonlinear, with TP at the urban site elevated vis-a`-vis the minimally impacted site, but lower TP than the improved pasture site. Reiss (2006) observed similar non-linearity between soil and water column properties and landscape development intensity in a survey of 118 isolated cypress wetlands throughout Florida. Our spatial assessments suggest that pattern may be an important facet to consider for ecosystem conditional assessment, both because of the implications for effective system sampling, and because spatial pattern itself may be an indicator of ecosystem condition and type of impact. For example, the map of soil TP data at the minimally impacted site (Figure 3A) illustrates the radial spatial pattern we expected to observe in undisturbed cypress domes based on hydroperiod gradients from edge to center (Haag et al. 2005). Deviation from this pattern was observed with increasing disturbance (Tables 3, Figure 3), which may be a result of exogeneous hydrologic modifications and nutrient inputs. The observed spatial patterns in our study supports the dominance of endogenous (i.e., hydroperiod) forcing in the minimally impacted and forest plantation site for TP and soil OM. Overall, differences between the minimally impacted site and the forest plantation site were small, both in biogeochemical properties and spatial pattern, which supports previous work (Cohen et al. 2004) that found negligible differences in vegetative community composition between minimally impacted and forest plantation sites. In contrast, patterns observed in the improved pasture site were consistent with exogenous forcing; in particular, field observations of a cattle entry point in the NW corner of the site partially explain the observed pattern. Additionally, drainage water from a nearby two-lane paved road entered along the western edge of the site. Both are consistent with enriched P and elevated pH in the western part of the site, and reinforce our inference that exogenous drivers (e.g., sediment loading, soluble P transport) appear to be supplanting endogenous processes. Controlling factors at the urban dome were less obvious (Tables 3). First, no significant spatial pattern in soil TP existed; we would expect a pattern if the system were influenced by stormwater flows in ditches. There are two locations of diffuse storm
WETLANDS, Volume 28, No. 2, 2008 drainage into the site (NW, S), but no point sources (culverts). The spatial pattern observed for pH is both short-range (,15 m) and strongly localized, with limited evidence for either endogenous or exogenous factors controlling its pattern. The NWSE ridge of elevated pH that is evident may be a result of significant road runoff discharging water and sediments into the wetland from the west; thereby influencing wetland topography. Given the potential for need for regulatory determination of wetland nutrient status when numeric nutrient criteria are applied, a 10% accuracy criterion seems reasonable. The sampling intensity corresponding to this level of accuracy is about 11 to 33 samples depending on site, when soil TP is the parameter of interest. Despite additional sampling and laboratory work required to collect and process greater numbers of soil samples, increased sample intensity may be necessary to improve our understanding of ecosystem dynamics and assessment of ecosystem nutrient condition in these systems. Optical methods for increased sample throughput (Cohen et al. 2005, Brown et al. 2006) that are accurate, rapid, and low-cost may facilitate more routine assessment of ecosystem spatial variability and greatly increased sample sizes.
SUMMARY AND IMPLICATIONS Our results suggested a relationship between land use intensity and isolated wetland soil properties that could be used as a component of ecosystem conditional assessment. This relationship may be non-linear with land use intensity, but it clearly delineates low intensity (minimally impacted, forest plantation) from higher intensity (improved pasture, urban) sites. The spatial pattern of soil TP and SOM in these isolated cypress domes were strongly affected by land use intensity. Low-intensity sites exhibited characteristic radial trends in soil variability (ascribed to endogenous factors), while higher intensity sites exhibited non-radial trends (ascribed to the increasing influence of exogenous factors). If the spatial heterogeneity of soil properties observed in this study is representative of isolated forested wetlands and land use impacts elsewhere, there are a number of implications. It appears, for example, that inherent variability in cypress dome soils confounds attempts to characterize soil properties using sparse sampling. Reiterating what has been noted in previous studies of wetland soils (Reese and Moorehead 1996, Johnston et al. 2001, Bruland and Richardson 2005), we recommend sampling schemes in isolated forested wetlands be
Cohen et al., SPATIAL PATTERN IN ISOLATED WETLAND SOILS designed to account for and characterize spatial variability of soil properties. While our observations cannot be used to make a priori recommendations about sampling intensity in the absence of accuracy requirements for a particular application, we can offer some guidance illustrated by the sampling intensity-characterization accuracy trade-off (Figure 4). Summarizing, TP characterization required 11–33 samples, SOM required 8–25 samples, and pH required 2–3 samples. Notably, different soil properties had different patterns of spatial variability. Characterizing SOM across an isolated wetland does not necessarily provide inference about the distributions of pH, TP, or other physical and chemical properties. Moreover, the strength of spatial pattern in a given parameter strongly affects the intensity of sampling required for characterization; with increasing spatial structure, low density sampling becomes increasingly inadequate for system characterization (Figure 5). We note that the sampling frame used in this work is not proposed as an improved system; it was devised primarily to characterize short range variability. For optimal characterization efficiency, replicate observations should be separated by the autocorrelation range (generally ,10–20 m; Table 3). ACKNOWLEDGMENTS We gratefully acknowledge the input of two anonymous reviewers and the Associate Editor of Wetlands for their constructive input. We also acknowledge the field and laboratory assistance of Richard Plate, Ben Loughran, and Dr. Yu Wang. Funds for this work were provided by a new faculty seed grant from the School of Natural Resources and Environment (SNRE) at the University of Florida. LITERATURE CITED Adams, D. A. 1963. Factors influencing vascular plant zonation in North Carolina salt marshes. Ecology 44:445–56. Anderson, J. M. 1976. An ignition method for determination of total phosphorus in lake sediments. Water Research 10:329–31. Belyea, L. R. and J. Lancaster. 2002. Inferring landscape dynamics of bog pools from scaling relationships and spatial patterns. Journal of Ecology 90:223–34. Boerner, R. E. J., A. J. Scherzner, and J. A. Brinkman. 1998. Spatial patterns of inorganic N, P availability, and organic C in relation to soil disturbance: a chronosequence analysis. Applied Soil Ecology 7:159–77. Bridgham, S. D., C. A. Johnston, and J. P. Schubaurer-Berigan. 2001. P sorption dynamics in soils and coupling with surface and pore water in riverine wetlands. Soil Science Society of America Journal 65:577–88. Brown, D. J., K. D. Shepherd, M. G. Walsh, M. D. Mays, and T. G. Reinsch. 2006. Global soil characterization with VNIR diffuse reflectance spectroscopy. Geoderma 132:274–90.
421
Brown, M. T. and M. B. Vivas. 2005. Landscape development intensity index. Environmental Monitoring and Assessment 101:289–309. Bruland, G. L., S. Grunwald, T. Z. Osborne, K. R. Reddy, and S. Newman. 2006. Spatial distribution of soil properties in Water Conservation Area 3 of the Everglades. Soil Science Society of America Journal 70:1662–76. Bruland, G. L. and C. J. Richardson. 2004. A spatially explicit investigation of phosphorus sorption and related soil properties in two riparian wetlands. Journal of Environmental Quality 33:785–94. Bruland, G. L. and C. J. Richardson. 2005. Spatial variability of soil properties in created, restored and paired natural wetlands. Soil Science Society of America Journal 69:273–84. Cambardella, C. A., T. B. Moorman, J. M. Novak, T. B. Parkin, D. L. Karlen, R. F. Turco, and A. E. Konopka. 1994. Fieldscale variability of soil properties in Central Iowa soils. Soil Science Society of America Journal 58:1501–11. Clark, M. W. and K. R. Reddy. 2003. Spatial variability and modeling of soil accretion in Shark Slough. Everglades National Park, Homestead, FL, USA.H5000 01 0494. Cohen, M. J., S. Carstenn, and C. R. Lane. 2004. Evaluation of floristic quality indices for biotic assessment of depressional marsh condition in Florida. Ecological Applications 14:784–94. Cohen, M. J., J. P. Prenger, and W. F. DeBusk. 2005. Visiblenear infrared spectroscopy for rapid, non-destructive assessment of wetland soil quality. Journal of Environmental Quality 34:1422–34. Corstanje, R., S. Grunwald, K. R. Reddy, T. Z. Osborne, and S. Newman. 2006. Assessment of the spatial distribution of soil properties in a Northern Everglades marsh. Journal of Environmental Quality 35:938–49. Coultas, C. L. and M. J. Duever. 1984. Soils of cypress swamps. p. 51–59. In K. C. Ewel and H. T. Odum (eds.) Cyprus Swamps. University of Florida Press, Gainesville, FL, USA. Darke, A. K. and M. R. Walbridge. 2000. Al and Fe biogeochemistry in a floodplain forest: implications for P retention. Biogeochemistry 51:1–32. DeBusk, W. F., S. Newman, and K. R. Reddy. 2001. Spatiotemporal patterns of soil phosphorus enrichment in Everglades Water Conservation Area 2A. Soil Science Society of America Journal 60:1273–77. DeBusk, W. F., K. R. Reddy, M. S. Koch, and Y. Wang. 1994. Spatial distribution of soil nutrients in a northern Everglades marsh: Water Conservation Area 2A. Soil Science Society of America Journal 58:543–52. Earle, J. C. and K. A. Kershaw. 1989. Vegetation patterns in James Bay coastal marshes. III. Salinity and elevation as factors influencing plant zonation. Canadian Journal of Botany 67:2967–74. Ettema, C. E. and D. A. Wardle. 2002. Spatial soil ecology. Trends in Ecology and Evolution 17:177–83. Ewel, K. C. and H. T. Odum (eds.) Cypress Swamps. University of Florida Press, Gainesville, FL, USA. Gallardo, A. 2003. Spatial variability of soil properties in a floodplain forest in northwest Spain. Ecosystems 6:564–76. Glaser, P. H. 1987. The ecology of patterned boreal peatlands of Northern Minnesota: a community profile. Biological Report 85(7.14). U.S. Fish and Wildlife Service, Washington, DC, USA. Grunwald, S., R. Corstanje, B. E. Weinrich, and K. R. Reddy. 2006. Spatial patterns of labile forms of phosphorus in a subtropical wetland. Journal of Environmental Quality 35:378–89. Haag, K. H., T. M. Lee, and D. C. Herndon. 2005. Bathymetry and vegetation in isolated marsh and cypress wetlands in the northern Tampa Bay area, 2000–2004. USGS Scientific Investigations Report, Reston, VA, USA. #2005-5109. Heimburg, K. 1984. Hydrology of North-Central Florida cypress domes. p. 72–82. In K. C. Ewel and H. T. Odum (eds.) Cypress Swamps. University of Florida Press, Gainesville, FL, USA. Holling, C. S. and L. H. Gunderson. 2002. Resilience and adaptive cycles. p. 25–62. In L. H. Gunderson and C. S. Holling (eds.) Panarchy: Understanding Transformations in Human and Natural Systems. Island Press, Washington, DC, USA.
422 Johnston, C. A., S. D. Bridgham, and J. P. Schubaurer-Berigan. 2001. Nutrient dynamics in relation to geomorphology of riverine wetlands. Soil Science Society of America Journal 65:557–77. Klausmeier, C. A. 1999. Regular and irregular patterns in semiarid vegetation. Science 284:1824–26. Lugo, A. E. 1984. A review of early literature on forested wetland in the United States. p. 7–16. In K. C. Ewel and H. T. Odum (eds.) Cypress Swamps. University of Florida Press, Gainesville, FL, USA. Lyons, J. B., J. H. Gorres, and J. A. Amador. 1998. Spatial and temporal variability of phosphorus retention in a riparian forest soil. Journal of Environmental Quality 27:895–903. Morris, S. J. 1999. Spatial distribution of fungal and bacterial biomass in southern Ohio hardwood forest soils: fine scale variability and microscale patterns. Soil Biology and Biochemistry 31:1375–86. Reddy, K. R., Y. Wang, W. F. DeBusk, M. M. Fisher, and S. Newman. 1998. Forms of soil phosphorus in selected hydrologic units of the Florida Everglades. Soil Science Society of America Journal 62:1134–47. Reese, R. E. and K. K. Moorehead. 1996. Spatial characteristics of soil properties along an elevational gradient in a Carolina Bay wetland. Soil Science Society of America Journal 60:1273–77. Reiss, K. C. 2006. Florida wetland condition index for depressional forested wetlands. Ecological Indicators 6:337–52. Richardson, C. J. and P. Vaithiyanathan. 1995. P sorption characteristics of the Everglades soils along an eutrophication gradient. Soil Science Society of America Journal 59:1782–88. Rietkerk, M., S. C. Dekker, P. C. de Ruiter, and J. Van de Koppel. 2004. Self-organized patchiness and catastrophic shifts in ecosystems. Science 305:1926–29.
WETLANDS, Volume 28, No. 2, 2008 Ross, M. S., S. Mitchell-Bruker, J. P. Sah, S. Stothoff, P. L. Ruiz, D. L. Reed, K. Jayachandran, and C. L. Coultas. 2006. Interaction of hydrology and nutrient limitation in the Ridge and Slough landscape of the Southern Everglades. Hydrobiologia 569:37–59. Siegel, D. I. 1983. Ground water and evolution of patterned mires, glacial Lake Agassiz peatlands, northern Minnesota. Journal of Ecology 71:913–21. Spangler, D. P. 1984. Geologic variability among six cypress domes in North-Central Florida. p. 72–82. In K. C. Ewel and H. T. Odum (eds.) Cypress Swamps. University of Florida Press, Gainesville, FL, USA. StatSoft Inc. 2005. STATISTICA (data analysis software system), version 7.1. www.statsoft.com. Stolt, M. H., M. H. Genthner, W. L. Daniels, and V. A. Groover. 2001. Spatial variability in palustrine wetlands. Soil Science Society of America Journal 65:527–35. U.S. Environmental Protection Agency (USEPA). 1993. Methods for the Determination of Inorganic Substances in Environmental Samples 365.1. Environmental Monitoring Systems Laboratory, Office of Research and Development, Cincinnati, OH, USA. U.S. Environmental Protection Agency (USEPA). 2000. Nutrient Criteria Technical Guidance Manual: Rivers and Streams. United States Environmental Protection Agency, Washington, DC, USA.#EPA-822-B-00-002. Webster, R. 1985. Quantitative spatial analysis of soil in the field. Advances in Soil Science 3:1–70. White, W. A. 1970. The geomorphology of the Florida Peninsula. Bureau of Geology, Division of Interior Resources, Florida Department of Natural Resources, Tallahassee, FL, USA. Manuscript received 1 December 2006; accepted 4 February 2008.