Ekológia (Bratislava)
Vol. 30, No. 1, p. 1–11, 2011 doi:10.4149/ekol_2011_01_1
SPATIAL VARIABILITY OF PHYSICAL SOIL PROPERTIES IN CONDITIONS OF ECOLOGICAL FARMING IN PROTECTED AREA DANICA FAZEKAŠOVÁ1, DANA KOTOROVÁ2, PAVOL BALÁZS1, BEÁTA BARANOVÁ1, LENKA BOBUĽSKÁ1 1
2
University of Prešov, Faculty of Humanities and Natural Sciences, Department of Ecology, 081 16 Prešov, Ul. 17. Novembra č. 1, Slovak Republic; e-mail:
[email protected] Slovak Agricultural Research Centre – Institute of Agroecology Michalovce, Špitálska 1273, 071 01 Michalovce, Slovak Republic; e-mail:
[email protected] Abstract Fazekašová D., Kotorová D., Balázs P., Baranová B., Bobuľská L.: Spatial variability of physical soil properties in conditions of ecological farming in protected area. Ekológia (Bratislava), Vol. 30, No. 1, p. 1–11, 2011. In 2005–2009 the temporal and spatial dimensions in the six research sites were studied in order to assess the impact of environmental management on change of basic physical properties of the soil. Crop rotation was as follows: perennial fodder crops – perennial fodder crops – winter crops – root crops – spring crops – annual fodder crops. Soil sampling to determine bulk density, porosity and maximum capillary capacity was realised two times a year in spring and autumn at the six locations (I.–VI.) from the depth of 0.05 to 0.15 m. The results obtained were tested by statistical methods (analysis of variance, LSD-test). Soil bulk density is influenced by ecological farming in the five-year time series in comparison with 1996 and decreased its value in the interval ranging from 0.91 to 1.36 t m-3 in both samples. The porosity corresponded with bulk density, which in 2009 increased in all locations to the optimal levels for plant growth. The maximum capillary capacity in 1996 reached very low values (17.40 to 20.65%). In 2009 its value increased from 25.59 to 42.84%, which may be associated with sum of precipitation and ecological farming, too. The positive change of soil bulk density and porosity and increasing the maximum capillary capacity was recorded in comparison with 1996. Test of obtained results confirmed a statistically significant effect of experimental year and localities on the bulk density, porosity and maximum capillary capacity. The date of sampling significantly influenced the values of porosity and the maximum capillary capacity. Key words: ecological farming, physical properties of soil, bulk density, porosity, maximum capillary capacity
Introduction Ecological farming system is a modern form of land management in mountain areas and it is theoretically regarded as a transitional system from conventional agriculture to alternative 1
Ekol01_11.indd 1
18. 3. 2011 11:41:44
one (Olah, Boltižiar, 2009; Olah et al., 2009; Boltižiar et al., 2008; Boltižiar, 2006). The main criterion in introducing ecological farming systems on land is the application of knowledge of functioning of natural ecosystems, that are characterized by a variety of plant and animal species and where solar energy is the only power source. Authorities claim that management methods known as low-input, organic, ecological, biodynamical or biological (Petr, Dlouhý, 1992) are more durable and the system referred to as conventional agriculture is less permanent. In order to evaluate sustainability of the agro-ecosystems certain indicators are used that are generally understood as measurable expressions of the status or characteristics of the system (Klír, 1997). Physical, chemical and biological soil parameters can be used as indicators of sustainability (Michaeli, Boltižiar, 2010). Larson and Pierce (1991) confirmed that the basic physical indicators are suitable for assessment of soil quality and sustainability of the system. Šimansky et al. (2008) hold that ecological farming systems on brown soil have a more positive effect on physical and hydro-physical soil properties than an integrated farming system. The aim of our work was to investigate the basic physical soil properties in conditions of ecological farming system in the temporal and spatial dimensions.
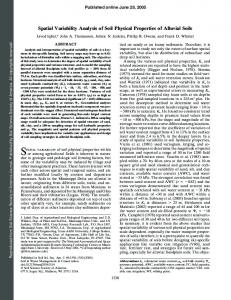
Material and methods The research project was carried out throughout the years 2005−2009 in production conditions in the investigated area Liptovská Teplička, where ecological farming system has been applied since 1996. The area of Liptovská Teplička is situated in the Nízke Tatry National Park at an altitude ranging from 846 to 1492 m a.s.l. In terms of geomorphological division it is a part of the subassemblies of the Kráľovohorské Tatry Mts. The climate is relatively homogeneous. The whole area is situated in the mild zone with sum of average daily temperatures above 10 ºC ranging from 1600 to 2000 and average precipitation of 700−1200 mm (Fig. 1). The soil conditions are relatively homogeneous, the largest area being represented by Cambisols mostly moderate and strongly skeletal, mainly in subsoil. The second most common type of soil is Rendzic, moderate, shallow and skeletal. In addition, Histosols occur in this territory (Table 1). From the point of view of relief, the majority of the land is situated on the slopes. In the current crop structure cereal acreage represents 33.3%, potatoes 16 to 18% and fodder crops 49.8%. Crop rotation is as follows: perennial fodder (clover mixture), perennial fodder (clover mixture), winter crops (winter wheat, T a b l e 1. Particle grain-size composition of soil (%) of the studied area Liptovská Teplička in depth 0.05−0.15 m. Diameter of the particles (mm) > 0.25 0.25−0.05 0.05−0.01 0.01−0.001 < 0.001 I. Category Soil
Studied locality I.
II.
III.
IV.
V.
VI.
Cambisols
Histosols
Cambisols
Cambisols
Cambisols
Cambisols
31.3 21.6 27.8 15.5 3.8 19.3 loamy sand
24.9 13.9 27.7 27.4 6.1 33.5 loam
14.5 15.5 32.4 29.3 8.3 37.6 loam
11.5 18.9 24.3 3.3 11.0 45.3 clayey loam
32.5 13.9 22.2 24.0 7.4 31.4 loam
16.0 14.9 31.3 2.6 8.2 37.8 loam
2
Ekol01_11.indd 2
18. 3. 2011 11:41:44
Fig. 1. The course of average air temperatures (ºC) and sum of precipitation (mm) during observed period.
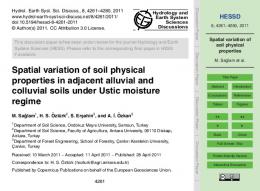
winter rye, triticale and winter barley), root crops (potatoes), spring crops (spring barley, oats), annual mixture (oats pea, peas, ryegrass). Arable land is fertilized with manure dosage of about 30 t ha-1 once in two years. The permitted phosphorous and potassium mineral fertilizers were not added in recent five years). The permanent grassland and arable land were fertilized with the Natural Harmony fertilizer in the spring season in dosage of 3 000 l.ha-1 (minimum nutrients content: total nitrogen as N in dry mass at least 15%, total phosphorus as P2O5 in dry mass less than 0.2%, total potassium as K2O in dry mass less than 0.4%, total sulfur as S in dry mass at least 16.5%). The soil samples for physical soil properties determination were sampled twice in year, in spring time in connected coppice, in summer time before harvest, two or three times repeatedly on six permanent research sites (Fig. 2) from the depth of 0.05 to 0.15 m. The research sites are indicated as follows: I. − Podždiar; II. − Záteplica I., III. − Záteplica II., IV. − Váh-Rovienky, V. − Predzatračany; VI. – Nový diel. We studied and evaluated the bulk density (t.m-3), porosity (%), maximum capillary capacity (%) in Kopecky physical cylinder with a capacity of 100 cm3 and grain composition by pipettes method of Kačinsky (Fiala et al., 1999). The obtained data were processed statistically by means of the software STATGRAPHIC (analysis of variance) and evaluated according to Grofík, Fľak (1990).
Results and discussion For physical and hydro-physical soil properties it is very important to classify soil type on the basis of grain composition. On the basis of clay particles content and in accordance with Novák´s classification scale (Fulajtár, 2006), soils in monitored sites are clay-sandy soils (site I), in sites II., III., V. and VI. clay soils and in IV. site clay-loam soils (Table 1). 3
Ekol01_11.indd 3
18. 3. 2011 11:41:44
capacity (%) in Kopecky physical cylinder with a capacity of 100 cm3 and grain composition by pipettes method of Ka�insky (Fiala et al., 1999). The obtained data were processed statistically by means of the software STATGRAPHIC (analysis of variance) and evaluated according to Grofík, F�ak (1990).
Fig. 2. Experimental localities of spatial variability of soil physical properties on the studied area Liptovská Teplička.
Bulk density as an integral value of the soil grain, humus content and anthropogenic impacts on soil should not exceed the limits given for individual types of soil (Table 2). T a b l e 2. Critical values of bulk density soil (t.m-3) and porosity for different of soil texture (Líška et al., 2008). Soil texture
Sandy
Bulk density Porosity
≥ 1.70 ≤ 38
Loamy sand Sandy loam ≥ 1.60 ≤ 40
≥ 1.55 ≤ 42
Loam
Clayey loam and clay
Clay
≥ 1.45 ≤ 45
≥ 1.40 ≤ 47
≥ 1.35 ≤ 48
4
Ekol01_11.indd 4
18. 3. 2011 11:41:44
management system. Bulk density is most sensitive to changes of environmental conditions, which was proved in the present study. Through the given year and growing season bulk density value varied as well, depending on water availability in the soil, weather
and
farming
methods.
1.6 1.4 1.2 1 0.8
spring
0.6
summer
0.4 0.2 0 1996 2005 2006
2007
2008
summer spring 2009
Fig. 3. Average values of bulk density (t.ha-1) on the localities of the studied area Liptovská Teplička in observed period 1996 and 2005–2009.
Fig. 3. Average values of bulk density (t.ha-1) on the localities of the studied area Research studiesTepli�ka show that the bulk density gets adjusted after a long-term application of Liptovská in observed period 1996 and 2005–2009. ecological farming system. The measured critical values of bulk density (1.53 to 1.63 t.m-3) in spring 1996 have been gradually reduced and in 2009 ranged from 0.94 to 1.22 t.m-3 (Table the totalbetter pore volume, which should below 38%offor soil and 3). Thus, From comparatively results were achieved fornot thatfall type and class soilsandy compared with the average values described in Líška et al. (2008). Similar trends in improving bulk below the clay-loam soil (Líška et al.,In2008), the share of non-capillary pores density were48% also for recorded in the summer sampling. 1996, critical values of bulk density ranging from 1.51 to 1.58 t.m-3 were found. releasing gravitational water reached and allowing airtoexchange Inrapidly 2009, the above-given soil parameter a valuegood of 0.92 1.23 tm-3between (Table 3, soil Fig. and
3). Physical soil properties change not only under the influence of weather conditions, crop should sufficient . Thethe share of non-capillary (Pn) in system. comparison year, climate vegetation pass,bebut also under influence of applied pores management Bulkwith density is most sensitive to changes of environmental conditions, which was proved in the present study. Through the given year and growing season bulk density value varied as well, depending on water availability in the soil, weather and farming methods. From the total pore volume, which should not fall below 38% for sandy soil and below 48% for the clay-loam soil (Líška et al., 2008), the share of non-capillary pores rapidly releasing gravitational water and allowing good air exchange between soil and climate should be sufficient. The share of non-capillary pores (Pn) in comparison with capillary pores (Pk) should be higher in heavy soils. The best conditions for growth of most crops are in the total porosity of 55−65% and 20−25% of air content in soil (Rode, 1969). The positive impact of ecological farming on the land was shown in the increase of total soil porosity, which is closely related to the bulk density of the soil. Low values of total porosity were measured in 1996, during the monitored period; however, they gradually increased and in 2009 reached the optimal conditions for plant growth (Table 3, Fig. 4). The maximum capillary capacity is a relatively unstable hydro-physical parameter and presents such an amount of water that soil that is normally able to retain in the soil 5
Ekol01_11.indd 5
18. 3. 2011 11:41:44
of total soil porosity, which is closely related to the bulk density of the soil. Low values
of total porosity were measured in 1996, during the monitored period; however, they gradually increased and in 2009 reached the optimal conditions for plant growth (Table 3, Fig. 4.). 70 60 50 40 30
spring
20
summer
10 0 1996
2005
2006
2007
2008
summer spring 2009
Fig. 4. Average porosity (%) on the localities of the studied area Liptovská Teplička in observed period 1996 and 2005–2009. Fig. 4. Average porosity (%) on the localities of the studied area Liptovská Tepli�ka in
observed period 1996 and 2005–2009.
capillary pores after the previous saturation. The values of maximum capillary capacThe maximum capillary capacity is a relatively unstable hydro-physical ity during the monitored period ranged from 27.70 to 42.84% in spring, parameter in comparison to 1996 when the low values of maximum capillary capacity (17.40 to 20.60%) were and presents such anresults amount of water that soil that summer is normally ablethe to retain the soil identified. Similar were recorded in the when valuesin were in the were26.00 significantly lower It is possiblecapacity to assume that the rainfalls interval to 42.84%. The(17.90 valuestoof20.65%). maximum capillary in summer 1996 capillary pores after the previous saturation. The values of maximum capillary capacity were significantly lower (17.90 to 20.65%). It is possible to assume that the rainfalls durduring this influenced period influenced theofvalues of this hydro-physical parameter ing this period the values this hydro-physical parameter (Table 3,(Table Fig. 5).3, Fig. during the monitored period ranged from 27.70 to 42.84% in spring, in comparison to A statistically significant effect of the location and year on bulk density, porosity and maxi5). 1996 when the low values of maximum capillary capacity (17.40 to 20.60%) were identified. Similar results were recorded in the summer when the values were in the 40
35 to 42.84%. The values of maximum capillary capacity in summer 1996 interval 26.00 30 25 20
spring
15
summer
10 5 0
1996 2005 2006
2007
2008
summer spring 2009
Fig. 5. Average values of maximum capillary capacity (%) on the localities of the studied area Liptovská Teplička in observed period 1996 and 2005–2009.
6
Fig. 5. Average values of maximum capillary capacity (%) on the localities of the studied area Liptovská Tepli�ka in observed period 1996 and 2005–2009. T a b l e 3. Basic physical soil properties on the localities of the studied area Liptovská Tepli�ka (depth of sampling 0.05�0.15 m).
Ekol01_11.indd 6
Parameter �d
Locality I.
Sampling spring
1996 1.39
2005 1.06
2006 1.27
2007 1.32
2008 1.09
2009
18. 3. 2011 1.22 11:41:45
T a b l e 3. Basic physical soil properties on the localities of the studied area Liptovská Teplička (depth of sampling 0.05−0.15 m). Parameter
2008
2009
1.39 1.06 1.27 1.32 1.09 spring I. summer 1.52 1.30 1.33 1.26 1.17 spring 1.33 0.91 1.17 0.98 0.85 II. summer 1.43 0.93 1.11 1.16 0.91 spring 1.60 1.08 1.19 1.22 1.12 III. summer 1.58 1.16 1.08 1.19 1.40 1.16 1.22 1.16 1.13 spring IV. summer 1.28 1.08 1.13 1.13 1.63 1.02 1.32 1.27 1.31 spring V. summer 1.51 1.30 1.36 1.29 1.21 spring 1.53 1.07 1.15 1.28 1.22 VI. summer 1.44 1.27 1.09 1.34 1.24 47.62 59.92 52.09 50.06 58.75 Po spring I. (%) summer 42.55 51.13 49.98 52.30 55.96 spring 49.81 65.55 55.72 63.06 67.79 II. summer 46.11 65.96 58.00 56.28 65.60 spring 39.74 59.30 55.21 54.09 57.91 III. summer 40.36 56.11 59.09 55.19 47.11 56.40 53.92 56.08 57.51 spring IV. summer 51.64 59.23 57.55 57.21 38.40 61.70 50.36 52.06 50.74 spring V. summer 43.00 50.87 48.77 51.51 54.30 spring 42.42 59.81 56.75 51.85 53.79 VI. summer 45.51 52.02 58.87 49.55 53.13 18.45 36.90 35.80 35.80 38.75 spring ΘMKK I. (%) summer 20.25 38.75 35.25 39.00 36.15 spring 20.60 41.10 39.75 35.65 38.05 II. summer 19.80 38.65 32.90 40.00 35.25 spring 18.20 32.55 29.00 31.60 34.40 III. summer 17.90 31.20 29.90 29.50 19.65 36.45 36.95 34.70 39.25 spring IV. summer 19.31 34.25 31.25 33.80 18.00 32.75 38.30 35.80 38.25 spring V. summer 20.65 37.85 35.60 38.40 39.l20 spring 17.40 30.09 35.95 29.90 38.50 VI. summer 19.10 30.25 28.25 33.85 31.80 Notes: ρd – bulk density, Po – porosity, ΘMKK – maximum capillary capacity, summer 2007 tilled.
1.22 1.11 0.99 0.88 0.98 0.92 1.05 1.14 1.22 1.23 0.94 1.24 53.78 58.13 62.82 66.75 62.96 65.27 60.48 56.82 54.02 53.76 64.49 53.34 38.42 31.38 42.84 32.89 27.70 26.00 31.87 30.27 36.29 32.10 25.59 31.05
ρd (t.m-3)
Locality
Sampling
1996
2005
2006
2007
mum capillary capacity was proved by the statistical test results obtained in the field conditions using analysis of variance (Table 4). Date of collection (spring, autumn) significantly influenced the values of capillary porosity and the maximum capacity. Sites VI., I. and 7
Ekol01_11.indd 7
18. 3. 2011 11:41:45
T a b l e 4. Analyses of physical parameters variance. Parameter
Source of variation
Degree of freedom
Calculated F-value
year 5 sampling 1 locality 5 residual 273 total 287 Po year 5 sampling 1 locality 5 residual 273 total 287 ΘMKK year 5 sampling 1 locality 5 residual 273 total 287 Notes: ++ P < 0.01 + P < 0.05; P – effect of factor significant at the level α = 0,05 or α = 0,01; ρd – bulk density; Po – porosity; ΘMKK – maximum capillary capacity. ρd
30.62 ++ 3.29 + 14.11 ++
28.89 ++ 14.68 ++ 8.51 ++
65.64 ++ 23.44 ++ 21.27 ++
V. located in a homogeneous group had the greatest potential impact on soil bulk density. Sites II., IV. and III. created another common homogenous group (Table 5). The bulk density was statistically most significant in 1996 and for the sites VI., I. and V. which were located in one homogeneous group. Difference between the median values of the bulk density was not significant. In all pairs of the monitored years, the differences were statistically significant, except for the years 2007−2009 and 2008−2009. Regarding the sites, the only ones without significant differences between the median of 95% probability level were III.−IV. and V.−VI. Regarding the porosity a significant impact on its values had the years 2008, 2005 and 2009 located in one homogeneous group, spring sampling before summer sampling and II. research site, all the other sites were located in one homogeneous group. Statistically significant differences were not found only between pairs of years 2007−1996 and 2008−2009. The difference between samples was significant. Statistical test sites showed that statistically significant differences in median values were only between sites II.−V. and II.−VI. The maximum capillary capacity was significantly influenced by all tested factors, with the biggest influence on the value in the years 2006, 2005 and 2008 that are located in one homogeneous group (Table 5). LSD-test confirmed the significant effect observed in the spring collection on hydro-physical soil characteristics, which is related to the supply of water in the soil (Mati et al., 2008). Sites V., I. and II. located in one homogeneous group had a significant influence on the maximum capillary capacity and site III. had the lowest impact. From determining the significance of differences between the medians using the Fischer’s LSD least significant difference procedures it follows that a statistically significant difference in the maximum capillary capacity was not observed only in the pair of years 2006−2009. The difference between samplings was statistically significant. 8
Ekol01_11.indd 8
18. 3. 2011 11:41:45
T a b l e 5. Multiplied test of soil parameters comparing (LSD0.05). Soil parameter Monitored factor ρd (t.m-3)
Average
2007 1023.31 x 2009 1076.73 x 2005 1111.71 2008 1130.83 2006 1201.65 1996 1470.00 sampling summer 1147.78 x spring 1190.29 x locality II 1054.15 x IV 1073.40 x III 1093.33 x VI 1234.21 I 1253.31 V 1305.83 Po (%) year 2007 44.74 x 1996 44.77 x 2006 54.69 2008 57.32 2005 58.08 2009 59.39 sampling summer 51.22 x spring 55.11 locality III 50.44 x V 50.79 x IV 51.41 x I 52.69 x VI 53.46 x II 60.20 ΘMKK (%) year 1996 19.11 x 2007 29.56 2009 32.20 2006 34.14 2005 35.07 2008 36.07 sampling summer 29.49 x spring 32.56 locality III 25.66 x IV 28.98 VI 29.37 V 33.60 I 33.74 II 34.79 Notes: ρd – bulk density; Po – porosity; ΘMKK – maximum capillary capacity.
Homogeneous group
year
x x x
x x x
x x x
x x x
x x x
x
x x x x
x x x
x x x x x x
9
Ekol01_11.indd 9
18. 3. 2011 11:41:45
Significant differences between the research sites were not found only between the pairs II.−V. and IV.−VI.
Conclusion On the basis of the research results reported in the production conditions of the years 2005–2009, the following conclusions can be made: 1. In soils with ecological farming systems, in the structures that are dominated by perennial fodder crops, as well as sufficiently high doses of organic fertilizer, positive changes of soil physical properties are observed. 2. The measured critical values of soil bulk density, porosity and maximum capillary capacity during the period were gradually adjusted and stabilized, reaching the levels comparable with the average values for the soil type. 3. In comparison with the year 1996, the positive change in the bulk density and porosity and the increase of the maximum capillary capacity was observed. 4. Test obtained results confirmed a statistically significant effect of experimental sites on the bulk density, porosity and maximum capillary capacity. The date of sampling significantly influenced the value of porosity and the maximum capillary capacity. Translated by the authors English corrected by M. Bilá and I. Cimermanová Acknowledgements Project was supported by VEGA 1/0601/08 – “Influence of the biotic and abiotic factors on agroecosystem sustainability.” References Boltižiar, M., 2006: Changes of high mountain landscape structure in the selected area of Predné Meďodoly valley (Belianske Tatry Mts) in 1949−1998. Ekológia (Bratislava), 25, Suppl. 1: 16−25. Boltižiar, M., Brůna, V., Křováková, K., 2008: Potential of antique maps and aerial photographs for landscape changes assessment – an example of High Tatras. Ekológia (Bratislava), 27, 1: 65−81. Fiala, K., Barančíková, G., Brečková, V., Búrik, V., Houšková, B., Chomaničová, A., Kobza, J., Litavec, T., Makovníková, J., Matúšková, L., Pechová, B., Váradiová, D., 1999: Partial monitoring system – soil (in Slovak). Výskumný ústav pôdoznalectva a ochrany pôdy, Bratislava, 138 pp. Fulajtár, E., 2006: Physical parameters of soil (in Slovak). VÚPOP, Bratislava, 142 pp. Grofík, R., Fľak, P., 1990: Statistical methods in agriculture (in Slovak). Príroda, Bratislava, 344 pp. Klír, J., 1997: Sustainable agriculture (in Czech). Ústav zemědělských a potravinářských informací, Praha, 40 pp. Larson, W.E., Pierce, F.J., 1991: Conservation and enhancement of soil quality. In Evaluation for sustainable land management in the developing world. Vol. 2. Technical Papers. IBSRAM Proc. No 12, p. 175−203. Líška, E., Bajla, J., Candráková, E., Frančák, J., Hrubý, D., Illeš, L., Korenko, M., Nozdrovický, L., Pospišil, R., Špánik, F., Žembery, J., 2008: General crop production (in Slovak). Slovenská poľnohospodárska univerzita v Nitre, Nitra, 452 pp.
10
Ekol01_11.indd 10
18. 3. 2011 11:41:45
Mati, R., Pavelková, D., Ivančo, J., 2008: Moisture regime of Gleyic Fluvisols on the East Slovak lowland (in Slovak). Acta Hydrologica Slovaca, 9, 1: 115−122. Michaeli, E., Boltižiar, M., 2010: The dump of metallurgical waste – lúženec and its impact of the landscape at Sereď in Slovak Republic. Növénytermelés, 59, Suppl.: 161−164. Olah, B., Boltižiar, M., 2009: Land use changes within the Slovak biosphere reserves zones. Ekológia (Bratislava), 28, 2: 127−151. Olah, B., Boltižiar, M., Gallay, I., 2009: Transformation of the Slovak cultural landscape since the 18th century and its recent trends. Journal of Landscape Ecology, 2, 2: 41−55. Petr, J., Dlouhý, J., 1992: Ecological agriculture (in Czech). Zemědělské nakladatelství Brázda, Praha, 312 pp. Rode, A.A., 1969: The study base of soil water (in Russian). Tom II. Gidrometeorologič. izd., Leningrad, 286 pp. Šimanský, V., Tobiašová, E., Šimanská, A., 2008: Physical properties of Haplic Luvisol under different farming systems and crop rotations. Agriculture (Poľnohospodárstvo), 54, 3: 131−137.
11
Ekol01_11.indd 11
18. 3. 2011 11:41:45