the order of a few microvolts (μV). This frequency range is further divided into. B. Gabrys, R.J. Howlett, and L.C. Jain (Eds.): KES 2006, Part I, LNAI 4251, pp.
Spiking Neural Network Based Classification of Task-Evoked EEG Signals Piyush Goel, Honghai Liu, David J. Brown, and Avijit Datta∗ Institute of Industrial Research, The University of Portsmouth, Portsmouth, PO1 3HE, England, UK ∗ Institute of Biomedical and Biomolecular Sciences, The University Of Portsmouth, Portsmouth, PO1 2DT,England, UK {piyush.goel, honghai.liu, david.j.brown, avijit.datta}@port.ac.uk
Abstract. This paper presents an improved technique to detect evoked potentials in continuous EEG recordings using a spiking neural network. Human EEG signals recorded during spell checking, downloaded from the BCI Competition website, were pre-processed using a Wavelet Transform to remove the noise and to extract the low frequency content of the signal. Analysis of the signals was performed on the ensemble EEG and the task of the neural network was to identify positive and negative peaks of different shapes. The network has a time-warp invariance property, which means that an input linearly compressed or elongated in time is still recognisable by the network. This enabled the network to train on one peak shape and generalize it to recognise similarly shaped peaks. The neural network presented was trained on one epoch of filtered EEG and was tested on the remaining samples. A post hoc examination of the averaged evoked EEG signal pre-designated as target and non-target show a nadir in the non-target, but not in the target signals. A new supplementary template containing a nadir was therefore created and the effectiveness of this was tested on the ability of the network to correctly identify evoked EEG. After final testing 94.7% of the signals assigned as containing P300 by the paradigm used for the data on the website were correctly classified as P300s, and 83.7% of the non-P300s were also classified as non-P300s. The sensitivity of the technique, utilising the data from this paradigm was 94.7%, specificity 83.68%, and positive predictive value was 53.71%.
1
Introduction
The electroencephalogram (EEG) was first recorded by Hans Berger in 1924 [1]. Electrical potentials are produced within the human brain as a result of neural firing. The collective firing of many neurons in the brain leads to the formation of small currents which diffuse around the head and can be measured as EEG at the scalp using electrodes. They have been proved to be highly beneficial for detecting brain conditions like epilepsy and strokes [2, 3, 4, 5, 6], and for constructing Brain-Computer Interfaces (BCIs) [7, 8, 9, 10, 11, 12]. Most of the brain activity of interest falls in the range of 0.1 Hz to 45 Hz with an amplitude of the order of a few microvolts (μV). This frequency range is further divided into B. Gabrys, R.J. Howlett, and L.C. Jain (Eds.): KES 2006, Part I, LNAI 4251, pp. 825–832, 2006. c Springer-Verlag Berlin Heidelberg 2006 �
826
P. Goel et al.
frequency bands of EEG activity - delta (0.1-4 Hz), theta (4-8 Hz), beta (8-13 Hz), alpha (13-25 Hz) and gamma (25-45 Hz). A slow positive potential, known as the P300 [13], appearing typically between 250-500 ms from the time of presentation of a stimulus has been of great interest to EEG research, for error detection and prediction [14] and for building BrainComputer Interfaces (BCI) [8, 9, 11]. Its shape can be represented as a Gaussian function with a standard deviation of 150ms and has amplitude of around 10 μV. The present study aims to classify evoked potentials depending on whether the signal contained the P300 component or not. It also analysed the importance of a negative dip before the P300-like peak in the non-target signals. This nadir was much evident in the non-target signals as compared to the target signals, where it was not present in most cases. Following the discovery, an additional module was added to identify the dip and improve the classification accuracy. To perform the recognition task, a spiking neuron model inspired by the mus silicium built by J.J. Hopfield and C. Brody [15, 16], was employed to detect the presence of P300 component in the EEG signal. The spiking neuron network comprises of three feed-forward (no backward connections) layers, namely, LayerA, Layer-W and γ-Layer. Before the network starts its computation, the raw input signal is pre-processed (for details please refer [15, 16]) before it is fed to the first layer (Layer-A). The pre-processing method looks for the times of certain features in the raw signals. Let these times of occurrence of features be referred as events.Occurrence of each event triggers a fixed set of twenty decaying currents with different pre-set decaying times. Each of these decaying currents is represented by a neuron in Layer-A which drives a pair of Layer-W neurons. Layer-W consists of leaky-integrate-and-fire (LIF) neurons [17]. An LIF neuron sums (integrates) all the input currents, over a period of time, discharges (leaks) exponentially continuously, and sends out an action potential (fires) whenever its membrane potential reaches a particular threshold, thus giving it the name.As the currents flow into the neuron, the charge induced is stored in a capacitor, thus increasing the membrane potential. When this potential reaches a threshold the neuron fires and the membrane potential is reset back to a reset value. The final layer in the network, γ-Layer, consists of ten LIF neurons, one for each of the words to be classified. Being LIF neurons, they principally work in the same way as Layer-W neurons but with a difference that they have a shorter time constant. Each γ-neuron takes input from many neurons in Layer-W, however, neither does it have any lateral connections to other neurons in the γ-Layer nor any external current inputs. Due to its short time constant, the γ-layer neuron accumulates charges only over a very short period of time. Hence, for the neuron to fire, it is essential that a lot of simultaneous W-neuron firings take place. When numerous neurons in layer-W synchronize, they provide enough current for the γ-neuron to fire. Hence, the firing of a γ-Layer neuron just after the end of the word indicates the presence of the word associated with that neuron in the input to the network. If the trained network is presented with a word different from the training word, then the temporal relationship between the features will
Spiking Neural Network Based Classification
827
not match and there will be no synchrony in the W-Layer neurons, rendering the γ-neurons unfired. Mus silicium was proposed primarily to recognise mono syllables as done by a biological brain. It uses the notion of transient synchrony [18] as a means of recognising the input. Testing it on speech data showed that the network was robust in the presence of noise. Moreover, it did not recognise a reversed sound for the same word, indicating that merely the presence of features was not sufficient, the temporal relationships between the features was critical for recognition. This network presents a time-warp invariant technique for feature detection, i.e., it would be able to recognise the input even it were stretched or compressed in time. These properties of the network provide a robust method for developing a template matching algorithm to detect features like the P300 in the on going EEG.
2
Data Pre-processing
The Wadsworth BCI Dataset (IIb) which is published on the BCI Competition 2003 Website [19] was used for this study. The data collected for one subject were examined. This dataset was collected using the BCI2000 platform (BCI2000 is a BCI research and development platform for research in brain signals, signal processing and user applications. For research purposes, it is freely available from the [20]). The following subsections describe the data in detail along with the collection method. The data were collected using the P3 Speller paradigm mentioned by [8]. In this paradigm, the subject was presented with a 6-by-6 grid of characters on a computer screen. He/she was then instructed to concentrate on letters of a particular word, one by one. The rows and columns of the grid were lit randomly while the subject was focusing on a letter in the grid. For each letter of the word, there were 12 illuminations (6 for the rows and 6 for the columns), out of which only 2 (1 row and 1 column) contained the letter which had the subjects focus. There were 15 repetitions of this set of 12 illuminations for each letter. The idea behind the paradigm is that, whenever the row or column containing the relevant letter is lit, it stimulates a P300 response in the brain of the subject and can be detected in the recorded EEG signal. To record the signals, 64 electrodes were placed on the scalp according to the standard 10-20 scheme. The signal was digitised at 240 Hz and recorded in three sessions, each consisting of a number of runs. The number of runs was equal to the number of words in the session and each run contained one word. The recording proceeded in the following manner: A blank matrix was displayed for 2.5s after which a row or column was illuminated for 100ms followed by 75ms of blank grid. This resulted in 12 such combinations for all rows and columns. This set of 12 intensifications was repeated 15 times for each letter of the word in a run making it a total of 180 intensifications for each letter. At the end of these 180 illuminations, the grid was blank for 2.5s indicating the end of intensifications for that letter. The letter to be concentrated on was shown in parentheses. The
828
P. Goel et al.
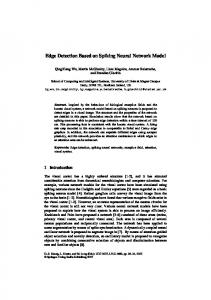
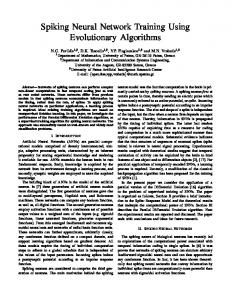
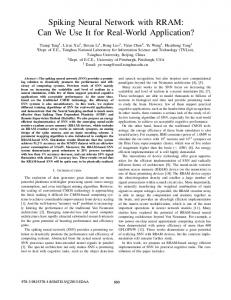
focus then shifted to the next letter of the word and the same process followed until the end of the word was reached. A single channel Cz from over the vertex, was used in the analysis of the signals. Due to the low signal-to-noise ratio, features of interest are not immediately apparent in single trial EEGs and generally an average of multiple trials is required to see them clearly. This makes the features common to all trials more visible and cancels out the random noise present in the signal [21]. In the present study, averages of fifteen trials were performed on the EEG data. From the stimulus onset time 600 ms worth of data was extracted from EEG for each trial, for each letter. This was subjected to wavelets analysis (for a review on wavelets, please refer to [22]) using Daubechies-6 wavelet as the mother wavelet. Approximation level 4 was regenerated using the wavelet coefficients. The resulting data represented the lower frequencies (delta band) of the EEG. Figure 1 shows an EEG signal filtered using wavelets.
Fig. 1. The result of filtering with wavelets. The wavy line shows the original signal and the smooth line shows the signal after filtering it with Daubechies-6 wavelet.
3
Feature Extraction/Selection
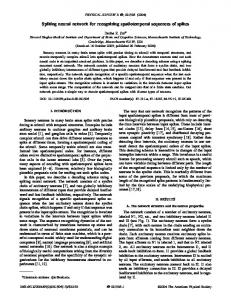
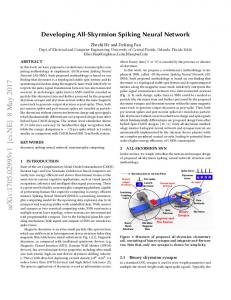
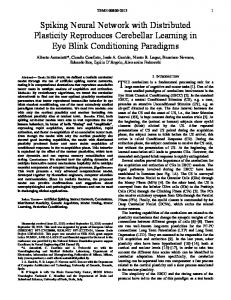
Once the signals are filtered in the pre-processing stage, they are suitable to be analysed. The first step of the analysis of signals involved training the spiking neural network with a sample of an EEG signal containing the P300 component. An EEG signal containing an ostensible P300 potential was manually chosen from the training data which lay completely within the prescribed P300 latency period (250-450ms). The training algorithm then searched for the maximum value (peak) of the signal in the window of 250-450ms from the time of the stimulus. Then seven points were marked vertically downward from the peak at equal steps. The values of the signal to the left and right of these points were searched for, yielding two points on the signal for each vertical step. The times of all these fourteen points, together with the time of the peak formed the input feature vector to train the network. Figure 2 shows the method pictorially. The above process trained the network to recognise peaks in the latency period of the P300 component. The trained network stored the temporal relationship between these features in the form of corresponding decaying rates for the different times of the points.
Spiking Neural Network Based Classification
829
Fig. 2. The training algorithm determines 15 points times of which form the input feature vector for the spiking neural network. The green vertical lines mark the bounds of the P300 latency period, the blue horizontal line is the zero value line. The red dots on the signal are the points marked by the algorithm with the peak being at the top.
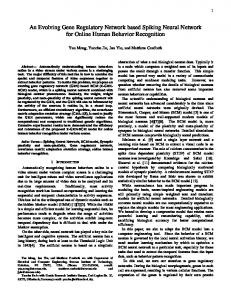
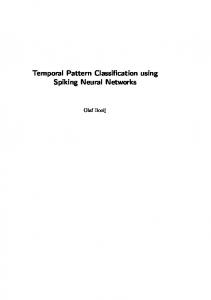
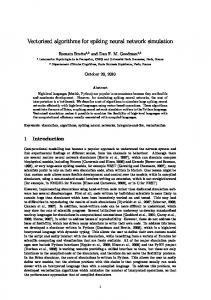
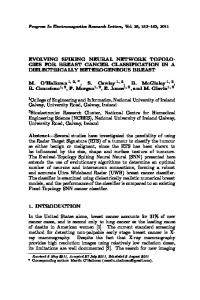
During the testing phase, the network searches for the highest value of the signal in the 250-450ms latency period, this is defined as the peak. If the peak is below a certain threshold, then the signal is classified as a non-target signal. If the peak happens to be above the threshold then the algorithm searches for the fourteen points as discussed above within the designated P300 time period. If the peak is not completely contained within the bounds of the designated period, then the points lying outside the bounds are ignored and are not included in the feature vector. This prevents the peaks that are near the P300 latency period but not within it, being classified as P300 responses. A peak which is narrower will have these point times compressed together and dilated for a broader peak. Due to the time warp invariant nature of the network, both of these types of peaks will be recognised by the network as P300s. Figure 3 shows signals that are classified as P300s with a tick and those that are not, with a cross. Figure 4 shows the averages of the filtered target and non-target signal responses. As can be seen from the figure, there is an evident negative dip in the P300 period for the non-target signals (dotted line in the figure). In many, non-target signals, the negative dip was followed by a positive peak. This positive peak is falsely classified as a P300 peak due to its shape and amplitude. In contrast, the positive peak in the target signals is not preceded by such a negative dip. Following this observation, an algorithm was devised to check for the nadir in a similar way in which the positive peak was detected for target signals as discussed above. The signals which had the positive peak in the P300 latency period but also had the negative preceding it, were classified as non-target signals.
4
Results and Discussion
The above mentioned method was applied to the BCI Competition dataset. Table 1 shows the results that were obtained without the application of nadir
830
P. Goel et al.
Fig. 3. The algorithm tested on four different types of EEG. The pattern of diagrams above follow that of Figure 2 and show only the region for the P300 latency period for each. The dashed line represents the threshold level (discussed in text). The peaks in the two signals on top are correctly recognised as P300s (marked with a tick) and the ones on the bottom are not (marked with a cross). The bottom left signal is below the threshold however the bottom right signal is above the threshold but out of bounds of the P300 region.
Fig. 4. Signals showing all the signals after filtering them with wavelets. The solid line shows the average of all the target responses and the dotted line shows the average of all the non-target responses.
detection [23] and Table 2 depicts the numbers as a result of negative dip detection. As can be seen from the table, there was no reduction to the rate of target signals being correctly identified but the number of falsely classified non-target signals was reduced significantly. The new results above correspond to a sensitivity of 94.7%, specificity of 83.68%, positive predictive value of 53.71%, and negative predictive value of 98.75%. We plan to use this technique to investigate sleepiness, human error detection due to low alertness and hence reduction of the same by making the subject aware of it through feedback. The present method shows promising results on the classification of EEG signals containing the stimulus response from the ones that do not appear to do so. The performance is close to the performance of the state of the art in the field [19] but has potential to improve as spiking neural network allows us to combine biological stimulus response into the networks and we are working on schemes to improve it.
Spiking Neural Network Based Classification
831
Table 1. BCI Competition Dataset Results before nadir detection P300 Non-P300 Identified Correctly 36 (94.7%) 132 (69.5%) Identified Incorrectly 2 (5.3%) 58 (30.5%) Table 2. BCI Competition Dataset Results after nadir detection P300 Non-P300 Identified Correctly 36 (94.7%) 159 (83.68%) Identified Incorrectly 2 (5.3%) 31 (16.32%)
The method we discuss here uses a single epoch of a stimulus signal containing the P300 component and is able to generalise it for peaks with similar but slightly different shapes. This can be seen as a method of template matching where one template can be used to identify many signals containing a similar peak. The performance of the process can be improved by involving many samples in the training stage to give multiple templates to be matched. These templates would run as parallel networks to identify the signal. The signal which is then recognised by the majority of this committee of networks would be deemed as a stimulus signal. This would reduce the number of non-target signals being recognised as target signals. Another direction for future work would be to use multiple channels to classify the signal.
References 1. H. Berger. On the electroencephalogram of man. Archiv fur Psychiatrie und Nervenkrankheiten, 87:527–570, 1929. 2. M. D’Alessandro, R. Esteller, G. Vachtsevanos, J. Hinson, A. andEchauz, and B. Litt. Epileptic seizure prediction using hybrid feature selection over multipleintracranial eeg electrode contacts: a report of four patients. IEEE Transactions on Biomedical Engineering, 50(5):603–615, May 2003. 3. M. Seeck, F. Lazeyras, C.M. Michel, O. Blanke, C.A. Gericke, J. Ives, J. Delavelle, X. Golay, N. Haenggeli, C.A. andde Tribolet, and T. Landis. Non-invasive epileptic focus localization using eeg-triggered functionalmri and electromagnetic tomography. Electroencephalography and Clinical Neurophysiology, 106(6):508–512, June 1998. 4. M.L.V. Quyen, J. Martinerie, C. Adam, and F.J. Varela. Nonlinear analyses of interictal eeg map the brain interdependences in humanfocal epilepsy. Physica D, 127(3):250–266, March 1999. 5. Z. Huang, W. Dong, Y. Yan, Q. Xiao, and Y. Man. Effects of intravenous mannitol on eeg recordings in stroke patients. Clinical Neurophysiology, 113(3):446–453, March 2002. 6. M. Molnar, G. Gacs, G. Ujvari, J.E. Skinner, and G. Karmos. Dimensional complexity of the eeg in subcortical stroke - a case study. International Journal of Psychophysiology, 25(3):193–199(7), April 1997.
832
P. Goel et al.
7. J.R. Wolpaw, D.J. McFarland, G.W. Neat, and C.A. Forneris. An eeg-based braincomputer interface for cursor control. Electroencephalography and Clinical Neurophysiology, 78(3):252–259, March 1991. 8. E. Donchin, K.M. Spencer, and R. Wijensinghe. The mental prosthesis: Assessing the speed of a p300-based brain-computerinterface. IEEE Trans. Rehab. Eng., (8):174–179, 2000. 9. N. Birbaumer, N. Ghanayim, T. Hinterberger, B. Iversen, I. andKotchoubey, A. K¨ ubler, J. Perelmouter, E. Taub, and H. Flor. The thought translation device (ttd) for completely paralyzed patients. IEEE Transactions on Rehabilitation Engineering, 8(2):190–193, June 2000. 10. G.E. Birch and S.G. Mason. Brain-computer interface research at the neil squire foundation. IEEE Transactions on Rehab. Eng., 8(2):193–195, June 2000. 11. J. D. Bayliss. The use of the p3 evoked potential component for control in a virtual apartment. IEEE Transactions on Neural Systems and Rehabilitation Engineering, 11(2), June 2003. 12. J.D.R. Mill´ an, F. Renkens, J. Mouri no, and W. Gerstner. Brain-actuated interaction. Artificial Intelligence, 159:241–259, 2004. 13. T.W. Piction. The p300 wave of the human event-related potential. J. Clin. Neurophysiol., 9:456–479, 1992. 14. A.K. Datta, A.K. Hawkins, J. Heutink, T. Manly, R. Cusack, C. Rorden, B. Davison, and I. Robertson. An electrophysiological predictor of human error. J. Physiology, 555P(PC107), 2004. 15. J.J. Hopfield and C.D. Brody. What is a moment? ”cortical” sensory integration over a brief interval. In Proceedings of the National Academy of Sciences of the USA, pages 97(25): 13919–13924, 2000. 16. J.J. Hopfield and C.D. Brody. What is moment? transient synchrony as a collective mechanism for spatiotemporalintegration. In Proceedings of the National Academy of Sciences of the USA, pages 98: 1282–1287, 2001. 17. W. Gerstner and W.M. Kistler. Spiking Neuron Models. Cambridge University Press, first edition, August 2002. 18. A.K. Datta and J.A. Stephens. Short term synchronization of motor unit activity during voluntary contractionin man. Physiol., (422):397–420, 1992. 19. B. Blankertz. Bci competition 2003, url: http://ida.first.fraunhofer.de/projects/bci /competition/index.html, 2003. 20. G. Schalk. Bci2000, url: http://www.bci2000.org, 2005. 21. T.W. Piction, O.G. Lins, and M. Scherg. The recording and analysis of eventrelated potentials. Handbook of Neuropsychology, (10):3–73, 1995. 22. S. Gilbert and T. Nguyen. Wavelets and filter banks. Wellesley-Cambridge Press, second edition, 1998. 23. P. Goel, D. Brown, H. Liu, C. James, and A. Datta. Analysis of evoked potentials using a spiking neural network. In IEE Advances in Medical, Signal and Information Processing (Accepted), 2006.